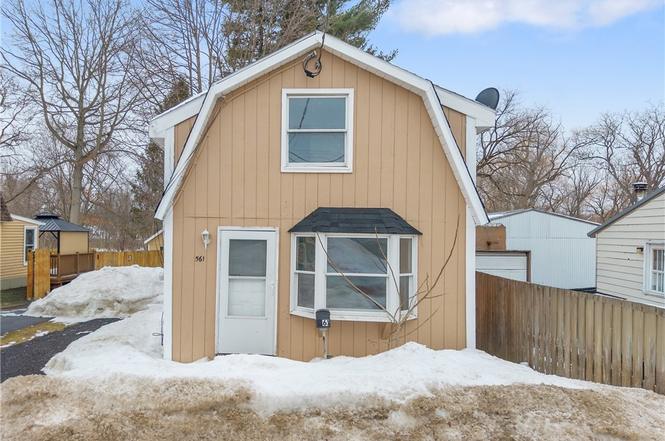
561 Main St · Phoenix, NY
Flood risk 9/10 · Severe
- FEMA flood zone
- X (unshaded)
- Chance of flooding over 30 yrs
- 0.99%
- Est. flood insurance / yr
- $473 – $860
Fire risk 3/10 · Minor
- Est. fire insurance / yr
- $691 – $1,283
Heat risk 2/10 · Minimal
- Hot days now (above 96°F)
- 7 days/yr
- Hot days in 30 yrs
- 16 days/yr
Wind risk 1/10 · Minimal
- Chance of severe wind over 30 yrs
- 0.0%
Air-quality risk 2/10 · Minimal
- Unhealthy air days now
- 1 days/yr
- Unhealthy air days in 30 yrs
- 1 days/yr
Risk factors via First Street. Map © Google.
Why this score? — see what drove the C- grade
The composite is a weighted blend of 9 inputs, each scored 0–100. Each bar is that input's sub-score; the figure is the points it added to the 100-point composite (weight × sub-score).
- ARV discount +13.4/15.0
- Appreciation +10.0/10.0
- Cash flow +8.8/30.0
- 1% rule +5.1/10.0
- Schools +4.1/10.0
- Livability +3.4/5.0
- Rent growth +2.5/5.0
- Condition / age +2.5/5.0
- DSCR +2.4/10.0
$115,000
🖨 Deal sheet (PDF) 📄 Offer letter ✓ Due diligence
Listing remarks
Welcome to this delightful 2-bedroom, 1.5-bath home full of warmth and character. Nestled in a peaceful setting, this quaint residence blends cozy charm with everyday functionality. Step inside to find a bright and inviting living space featuring abundant natural light and a comfortable layout perfect for relaxing or entertaining. The kitchen offers ample cabinetry and flows seamlessly into the dining area, creating an ideal space for gatherings. Both bedrooms are generously sized, while the full bath is thoughtfully appointed and the convenient half bath adds extra comfort for guests. Outside, enjoy a private yard with room for gardening, outdoor dining, or simply unwinding after a long da
Key facts
- Bright living space
- Ample cabinetry
- Dining area
Tags
Neighborhood map
What this means for you Summary
Snapshot
- This is a 2-bed/1.0-bath single-family listed at $115k.
Deal economics
- At list price, monthly cash flow is $-150 ($-2k/yr) — negative.
- To cash-flow at today's rent, offer at most $89k (23.0% below list).
- Meets the 1% rule at list price ($1k rent vs $115k).
- Recommended offer: $89k (23.0% below list) — sets the bar for cash-flow.
- Cap rate 5.3% vs local median 1.9% in Phoenix — top-decile yield for the area; either an underpriced asset or a hidden risk that comps aren't pricing in. Stress-test before assuming the spread holds.
Location & tenants
- Location reads 67/100 on livability (#613 in NY) — a middle-class / working-renter tenant base. Strengths: cost of living A+, housing A+, crime B+; Watch: employment C-, amenities F, commute F.
- Phoenix Central School District (suburban): math 45% / reading 51% proficiency, ranked #416 of 590 in NY (top 70%) — families likely to look elsewhere, expect single-tenant / working-renter base with shorter leases.
- Zoned schools: Michael A Maroun Elementary School (math 36% / reading 45%, grade F, #1,413 of 2,108 statewide, top 67%, 667 students, 58% FRL); Emerson J Dillon Middle School (math 35% / reading 40%, grade F, #445 of 729 statewide, top 61%, 514 students, 60% FRL); John C Birdlebough High School (math 87% / reading 87%, grade A, #311 of 1,100 statewide, top 30%, 473 students, 59% FRL) — zoned schools average 59% FRL vs 41% district-wide (18 pts higher); higher-poverty schools than district average — tighter screening recommended.
- Market conditions: 40 active listings in the ZIP; 172 units permitted in Oswego County in 2024 (27 in 5+ unit buildings).
Forward outlook
- In year one you build about $12k of equity ($795 loan paydown + $12k appreciation (10.0% local appreciation)).
- Oswego County population projected at -23% by 2050 — secular population decline; favor cash flow + early exit over multi-decade hold.
- By year 3, paydown + projected appreciation supports a ~$31k cash-out refi (75% LTV) — recoverable capital for the next deal without selling this one.
Negotiation context
- It's been on market 27 days — a 2% lower offer ($113k) is reasonable based on typical stale-listing flexibility.
- 4 sale attempts since 13y ago with the ask held roughly flat each time — persistent listings suggest the price (not the market) is what's stuck; bring a comps-based counter.
Risks & watch-outs
- Watch-outs: property tax is 3.8% of price; flood insurance adds $56/mo; built in 1900 — expect roof / HVAC / electrical / plumbing capex.
- Climate carrying-cost: severe flood risk — expect insurance premiums to compound above CPI over the hold.
Questions for the listing agent
- What do current leases actually rent for vs. the listed asking? Can we see a recent rent roll and the last 12 months of T-12 income?
- Built in 1900 — when were the roof, HVAC, electrical panel, plumbing, and water heater last replaced?
- Property tax is high relative to price — has the assessment been appealed recently, and will the sale trigger a re-assessment?
- What's the actual annual flood-insurance premium (NFIP or private), and is the property in a SFHA with mandatory coverage?
- Is there a deadline driving the sale (1031 exchange, divorce, estate, relocation)? That informs how much negotiation room exists.
- What's the average days-on-market for RENTAL listings here right now (not sales)? A rising rental-DOM trend means longer vacancies and softer asking-rent achievability than the comps imply.
- What's the recent tenant-quality profile in this submarket — average credit score on applications, eviction rate, late-payment / NSF rate, and stable-employment percentage? A property-management company in the area should have these aggregated.
- How much new for-sale + rental construction is in the pipeline within 1–3 miles? Heavy new supply typically softens prices + rents 12–24 months out; constrained supply supports both.
Investment metrics
- 1% rule
- 1.01% ✓
- Cap rate
- 5.31%
- Cash-on-cash
- -3.51%
- DSCR
- 0.84
- GRM
- 8.2
CMA / ARV
- ARV (on-the-fly)
- $132,480
- Comps found
- 2
Show comp detail 2 sales within ~0.75 mi
| Address | Dist | Beds/Ba | Sqft | Sold | Price | $/sf | Match |
|---|---|---|---|---|---|---|---|
| 561 Main St | 0.00mi | 2/1.5 | 720 (0%) | 0mo | $115,000 | $160 | 98 |
| 42 Davis St | 0.19mi | 2/1.0 | 640 (-11%) | 7mo | $118,000 | $184 | 67 |
Match score weights: distance 35% · size 25% · config 20% · recency 20%. Top-matched comps best support the ARV.
Projected returns pro-forma
10.0% appreciation · 3.0% rent growth · sell at horizon
- IRR
- 20.4%
- Equity multiple
- 2.65×
- Total profit
- $53,276
- Equity at exit
- $103,601
- IRR
- 18.6%
- Equity multiple
- 6.12×
- Total profit
- $164,767
- Equity at exit
- $223,420
Cash invested: $32,200 (down + closing). Projections, not guarantees.
Landlord ↔ Tenant lean methodology
- Overall (STATE)
- 15 Strongly Tenant-Friendly
- State New York
- 15 Strongly Tenant-Friendly · D+10
- County
- — inherits STATE
- City
- — inherits STATE
ZIP-level market 13135
- Home prices YoY
- 8.8%
- Active inventory
- 40
- Price-to-rent
- 8.2×
Monthly cashflow live
- Estimated rent
- $1,167 medium interval (Pro) →
- Mortgage (P&I)
- −$603
- Tax from tax record
- −$365 /mo · $4,381/yr
- Insurance
- −$48
- Flood insurance flood zone
- −$56 /mo · $666/yr
- HOA
- −$0
- Vacancy / Maint / Mgmt
- −$245
- Net cashflow
- $-150
Break-even live
Sensitivity live
| Price | -10% $-85 | -5% $-117 | +0% $-150 | +5% $-182 | +10% $-215 |
|---|---|---|---|---|---|
| Rent | -10% $-242 | -5% $-196 | +0% $-150 | +5% $-104 | +10% $-58 |
| Rate | -1.0pp $-92 | -0.5pp $-121 | base $-150 | +0.5pp $-180 | +1.0pp $-210 |
UW: 25.0% down · 7.5% · 30yr · 1.5% tax · 5.0% vac · 8.0% maint · 8.0% mgmt
Financing live
Cash to close
- Down payment
- $28,750
- Closing costs
- $3,450
- Reserves months
- —
- Total cash needed
- —
Loan-product check · same deal, 3 products live
Conventional
25% down · 7.5% · 30yr
- Down + closing
- —
- Monthly P&I
- —
- Monthly cashflow
- —
- DSCR
- —
- Eligible?
- —
Personal DTI + credit; lowest rate.
DSCR
20% down · 8.5% · 30yr
- Down + closing
- —
- Monthly P&I
- —
- Monthly cashflow
- —
- DSCR
- —
- Eligible?
- —
No personal income docs; deal must DSCR.
Hard money
10% down · 12.0% · 12mo
- Down + closing
- —
- Monthly P&I
- —
- Monthly cashflow
- —
- DSCR
- —
- Eligible?
- —
Short-term bridge; refi at stabilization.
Listing history 6 events
-
2026-03-25status Pending
-
2026-02-26$115,000 Active
-
2022-08-19historical
-
2022-03-23$100,000 Active
-
2015-10-29$41,999
-
2013-10-17$39,900
ⓘ Source: listings_history table (triggers on properties + properties_extension) + one-shot
backfill from property_details.listing_events for pre-trigger history.
Tax reassessment forecast NY · Partial reset (capped growth)
- Current annual tax
- $4,381 · $365/mo
- Projected year-2 tax
- $4,381 · $365/mo
- Expected delta
- $0/yr ($0/mo · 0.0%)
ⓘ Screening estimate from a state-policy table — verify with the county assessor before closing.
Climate risk First Street
- Flood 9/10 Extreme FEMA zone X (unshaded) · 99% chance over 30 yrs
- Wildfire 3/10 Moderate
- Heat 2/10 Low 7 d/yr ≥96°F today · 16 d/yr by 30 yrs out
- Wind 1/10 Low 0% chance of damaging wind over 30 yrs
- Air quality 2/10 Low 1 unhealthy d/yr today · 1 by 30 yrs out
Nearby sold comps map
Loading sold comps map…
Walkable amenities ~0.75 mi
Loading nearby amenities…
Taxation est. · year 1
- Rental income
- $14,002
- − Mortgage interest
- −$6,442
- − Property taxes
- −$4,381
- − Insurance
- −$1,242
- − Repairs & maintenance
- −$1,120
- − Management
- −$1,120
- − Depreciation
- −$3,345
- Taxable loss
- −$3,649
- Est. tax savings @ 24.0%
- +$876
- After-tax cash flow
- $-923/yr
For passive investors: Depreciation is non-cash, so a rental often shows a tax loss while cash-flowing — sheltering income. Rental losses are passive: they offset passive income freely, and up to $25,000/yr can offset ordinary (W-2) income if you actively participate and your MAGI is under $100k (phasing out to $0 by $150k); unused losses carry forward. On sale, claimed depreciation is recaptured at up to 25%, and gains may owe capital-gains tax (a 1031 exchange can defer both). Figures are a year-1 estimate at your 24.0% rate — not tax advice; consult a CPA.
Schools (NCES district)
- District
- Phoenix Central School District
- NCES district ID
- 3622920
- Math proficiency
- 45% ▼ -14.00%
- Reading proficiency
- 51% ▲ 5.00%
- Median HH income
- $52,419
- Composite
- 41.34/100
- National rank
- #3500
- State rank
- #416 of 590 in NY
Livability — Phoenix
- Score
- 67/100
- State rank
- #613
- US rank
- #11120
Category grades
Schools grade is shown separately in the Schools card above.
Census & demographics
- Census place
- Phoenix, NY
- Population (ZIP)
- 6,229
Population outlook (Oswego County) Hauer SSP2
- Today (2025)
- 114,465 people
- By 2030
- 109,968 · -3.9%
- By 2040
- 99,205 · -13.3%
- By 2050
- 87,979 · -23.1%
- By 2075
- 65,100 · -43.1%
- By 2100
- 47,117 · -58.8%
Race, ethnicity, and origin ACS 2023
- Neighborhood character
- Predominantly White (92%)
- Race & ethnicity
- White 92% Two or more races 5% Hispanic / Latino 2% Asian 2%
- Common ancestry
- Lithuanian 8% Romanian 5% Slovak 2%
- Foreign-born
- 2% · China, Vietnam
- Languages at home
- 97% English-only · Russian/Polish/Slavic 1% Vietnamese 1%
Political lean MEDSL · Oswego
- 2024 margin
- Strong R (+24.2) · D 37.9% · R 62.1%
- 2008→2024 swing
- -26.6pp toward R · 2008: 2.5pp · 2024: -24.2pp
- All cycles
- 2024: R+24.2 2020: R+20.2 2016: R+23.2 2012: D+7.9 2008: D+2.5
Not yet ingested
- Civics
- —
Market trends
- HPI YoY
- ▲ 25.32%
- Current HPI
- 313.5591
- Rent YoY
- —
- Metro
- —
- State GDP YoY
- ▲ 2.60%
- F500 in state
- 92
Industry mix (Fortune 500 HQ in NY)
| Industry | F500 HQs | Revenue |
|---|---|---|
| Financial Services | 10 | $950B |
|
||
| Consumer Goods | 9 | $162B |
|
||
| Insurance | 4 | $225B |
|
||
| Telecommunications | 2 | $144B |
|
||
| Pharmaceuticals | 2 | $112B |
|
||
| Media / Entertainment | 2 | $69B |
|
||
Price history
+188.2% since first listed6 events — show timeline
- 2026-03-25 Pending — CNYIS
- 2026-02-26 Listed $115,000 CNYIS
- 2022-08-19 Listing Removed — CNYIS
- 2022-03-23 Listed $100,000 CNYIS
- 2015-10-29 Listed $41,999 CNYIS
- 2013-10-17 Listed $39,900 CNYIS
Property tax history
+5.9%/yrLatest (2025): $4,381 · -0.6% YoY. Source: county tax records.
Cash-flow waterfall
monthlySold comps — $/sqft
last 12 mo · ≤1 miLoading sold comps…