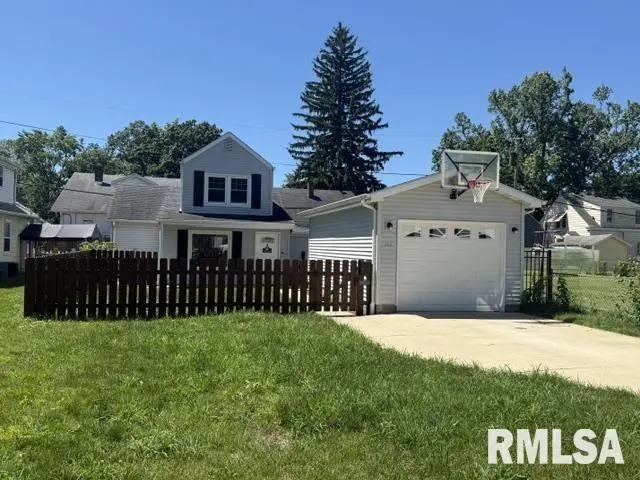
2512 W Laura Ave · West Peoria, IL
Flood risk 1/10 · Minimal
- FEMA flood zone
- X
- Chance of flooding over 30 yrs
- 0.0%
- Est. flood insurance / yr
- $473 – $860
Fire risk 1/10 · Minimal
- Est. fire insurance / yr
- $804 – $1,492
Heat risk 3/10 · Minor
- Hot days now (above 105°F)
- 7 days/yr
- Hot days in 30 yrs
- 18 days/yr
Wind risk 2/10 · Minimal
- Chance of severe wind over 30 yrs
- 1.0%
Air-quality risk 3/10 · Minor
- Unhealthy air days now
- 1 days/yr
- Unhealthy air days in 30 yrs
- 3 days/yr
Risk factors via First Street. Map © Google.
Why this score? — see what drove the C+ grade
The composite is a weighted blend of 9 inputs, each scored 0–100. Each bar is that input's sub-score; the figure is the points it added to the 100-point composite (weight × sub-score).
- Cash flow +25.4/30.0
- ARV discount +11.7/15.0
- 1% rule +8.6/10.0
- DSCR +8.4/10.0
- Livability +3.8/5.0
- Rent growth +3.1/5.0
- Condition / age +2.5/5.0
- Schools +1.1/10.0
- Appreciation +0.0/10.0
$95,000
🖨 Deal sheet 📄 Offer letter ✓ Due diligence
Listing remarks MLS
Adorable home with great location close to the Franciscan Recreational Center, Bradley University, and Bradley Park. Major renovations. New carpet throughout, kitchen cabinets, counter tops, and laminate floors. Newer furnace and air, water heater, roof, windows, garage and driveway. Icynene spray foam insulation which has a positive affect on utility bills!
Key facts
- Flex space
- Eat in kitchen
- Versatile office
Tags
Property features AI
Finance
- HOA & community: No association fee
Exterior
- Parking: Detached garage (1 car); On-street parking available
- Utilities: Public water; Public sewer
- Home design: Single family residence; Residential zoning; Built in 1924; Approximately 1,047 total building area
- Construction: Shingle roof; No basement
- Exterior features: Level lot; Paved road access; Shingle roof
Interior
- Kitchen: Refrigerator included
- Bedrooms: 2 bedrooms (one on the main level, one on the upper level); Primary bedroom approx. 9 x 13 with egress window; Second bedroom approx. 10 x 11 with egress window
- Flooring: Carpet in bedrooms and office; Laminate in dining room, kitchen, and laundry
- Bathrooms: 1 full bathroom
- Heating & cooling: Central air conditioning; Forced air heating; Gas water heater
- Interior features: Attic storage; Cable available
- Laundry & utility: Dedicated laundry room (main level)
Neighborhood map
What this means for you Summary
Snapshot
- This is a 3-bed/1.0-bath single-family listed at $95k.
Deal economics
- At list price, monthly cash flow is $219 ($3k/yr) — positive.
- The deal already cash-flows at list — no discount required.
- Meets the 1% rule at list price ($1k rent vs $95k).
- Cap rate 9.1% vs local median 6.2% in West Peoria — top-decile yield for the area; either an underpriced asset or a hidden risk that comps aren't pricing in. Stress-test before assuming the spread holds.
Location & tenants
- Location reads 76/100 on livability (#181 in IL, #3,474 nationally) — a middle-class / working-renter tenant base. Strengths: cost of living A+, housing A+, commute A-; Watch: amenities F.
- Peoria SD 150 (urban): math 11% / reading 14% proficiency, ranked #554 of 620 in IL (top 89%) — low school quality limits family demand, transient renter base, plan for 1-2y turnover; 70% free/reduced lunch — lower-income household profile, screen leases tightly.
- Zoned schools: Manual High School (math 2% / reading 2%, grade F, #659 of 693 statewide, top 100%, 656 students, 0% FRL) — zoned schools average 0% FRL vs 70% district-wide (70 pts lower); this property's tenant base skews higher-income than the district average.
- Market conditions: Rents rising (+2.3%/yr); 180 active listings in the ZIP; 19 comparable units currently listed for rent nearby; rentals leasing fast (median 13d on market — plan ~1-2 weeks tenant-placement turnaround); 73 units permitted in Peoria County in 2024 (0 in 5+ unit buildings).
Forward outlook
- Local home prices are declining (-3.0%/yr); year-one equity from $657 of loan paydown is wiped out by about $3k of value loss. Plan a longer hold.
- Peoria County population projected at -11% by 2050 — secular population decline; favor cash flow + early exit over multi-decade hold.
Negotiation context
- Only 1 days on market — expect competitive offers; lowballing is unlikely to land.
- 3 sale attempts since 21y ago; this cycle's ask is 19% above the opening price — seller raised mid-cycle; expect resistance to lowballs.
Risks & watch-outs
- Watch-outs: property tax is 3.3% of price; built in 1924 — expect roof / HVAC / electrical / plumbing capex.
Questions for the listing agent
- Built in 1924 — when were the roof, HVAC, electrical panel, plumbing, and water heater last replaced?
- Property tax is high relative to price — has the assessment been appealed recently, and will the sale trigger a re-assessment?
- Is there a deadline driving the sale (1031 exchange, divorce, estate, relocation)? That informs how much negotiation room exists.
- Schools are F-rated, which usually means shorter tenancies and higher turnover. Who's the typical renter profile here, and what's been the actual vacancy rate?
- What's the average days-on-market for RENTAL listings here right now (not sales)? A rising rental-DOM trend means longer vacancies and softer asking-rent achievability than the comps imply.
- What's the recent tenant-quality profile in this submarket — average credit score on applications, eviction rate, late-payment / NSF rate, and stable-employment percentage? A property-management company in the area should have these aggregated.
- How much new for-sale + rental construction is in the pipeline within 1–3 miles? Heavy new supply typically softens prices + rents 12–24 months out; constrained supply supports both.
Investment metrics
- 1% rule
- 1.36% ✓
- Cap rate
- 9.06%
- Cash-on-cash
- 9.89%
- DSCR
- 1.44
- GRM
- 6.1
CMA / ARV
- ARV (on-the-fly)
- $104,700
- Comps found
- 12
Show comp detail 12 sales within ~0.75 mi
| Address | Dist | Beds/Ba | Sqft | Sold | Price | $/sf | Match |
|---|---|---|---|---|---|---|---|
| 2511 W Downs Cir | 0.06mi | 2/1.0 (-1) | 1,063 (+2%) | 2mo | $101,000 | $95 | 88 |
| 2617 W Kenwood Ave | 0.15mi | 2/1.0 (-1) | 1,016 (-3%) | 4mo | $110,990 | $109 | 80 |
| 2111 W Callender Ave | 0.48mi | 3/1.0 | 1,050 (+0%) | 1mo | $43,500 | $41 | 76 |
| 1328 N Stever Ave | 0.43mi | 3/1.0 | 1,073 (+2%) | 2mo | $78,500 | $73 | 74 |
| 2310 W Heading Ave | 0.19mi | 2/1.0 (-1) | 970 (-7%) | 2mo | $99,000 | $102 | 73 |
| 2306 Laura Ave | 0.18mi | 2/1.0 (-1) | 1,159 (+11%) | 2mo | $116,000 | $100 | 67 |
| 2118 W Sherman Ave | 0.59mi | 3/1.0 | 1,075 (+3%) | 3mo | $85,000 | $79 | 66 |
| 2013 W Rohmann Ave | 0.44mi | 2/1.5 (-1) | 1,007 (-4%) | 7mo | $103,500 | $103 | 61 |
| 2920 W Alice Ave | 0.37mi | 2/1.0 (-1) | 934 (-11%) | 3mo | $50,000 | $54 | 58 |
| 2027 W Sherman Ave | 0.60mi | 3/1.0 | 1,109 (+6%) | 6mo | $110,000 | $99 | 57 |
| 1324 N Stella Ct | 0.64mi | 3/1.0 | 1,128 (+8%) | 7mo | $170,000 | $151 | 52 |
| 2507 W Moss Ave | 0.55mi | 2/1.0 (-1) | 944 (-10%) | 3mo | $120,000 | $127 | 50 |
Match score weights: distance 35% · size 25% · config 20% · recency 20%. Top-matched comps best support the ARV.
Projected returns pro-forma
-3.0% appreciation · 2.3% rent growth · sell at horizon
- IRR
- -2.2%
- Equity multiple
- 0.92×
- Total profit
- $-2,221
- Equity at exit
- $14,165
- IRR
- 6.7%
- Equity multiple
- 1.48×
- Total profit
- $12,838
- Equity at exit
- $8,214
Cash invested: $26,600 (down + closing). Projections, not guarantees.
Landlord ↔ Tenant lean methodology
- Overall (STATE)
- 43 Moderately Tenant-Leaning
- State Illinois
- 43 Moderately Tenant-Leaning · D+7
- County
- — inherits STATE
- City
- — inherits STATE
ZIP-level market 61604
- Home prices YoY
- -24.6%
- Rents YoY
- 2.3%
- Active inventory
- 180
- Price-to-rent
- 6.1×
Monthly cashflow live
- Estimated rent
- $1,290 high interval (Pro) →
- Mortgage (P&I)
- −$498
- Tax from tax record
- −$262 /mo · $3,146/yr
- Insurance
- −$40
- HOA
- −$0
- Vacancy / Maint / Mgmt
- −$271
- Net cashflow
- $219
Break-even live
UW: 25.0% down · 7.5% · 30yr · 1.5% tax · 5.0% vac · 8.0% maint · 8.0% mgmt
Financing live
Cash to close
- Down payment
- $23,750
- Closing costs
- $2,850
- Reserves months
- —
- Total cash needed
- —
Loan-product check · same deal, 3 products live
Conventional
25% down · 7.5% · 30yr
- Down + closing
- —
- Monthly P&I
- —
- Monthly cashflow
- —
- DSCR
- —
- Eligible?
- —
Personal DTI + credit; lowest rate.
DSCR
20% down · 8.5% · 30yr
- Down + closing
- —
- Monthly P&I
- —
- Monthly cashflow
- —
- DSCR
- —
- Eligible?
- —
No personal income docs; deal must DSCR.
Hard money
10% down · 12.0% · 12mo
- Down + closing
- —
- Monthly P&I
- —
- Monthly cashflow
- —
- DSCR
- —
- Eligible?
- —
Short-term bridge; refi at stabilization.
Rent comps 19 comps
| Address | Beds | Baths | Sqft | Rent | $/sqft | DOM | Units | Dist |
|---|---|---|---|---|---|---|---|---|
| 2601 W Kenwood Ave West Peoria, IL | 3.0 | 1.5 | 1405 | $1,500 | $1.07 | 13d | 1 | 0.10mi |
| 1723 W Fredonia Ave Peoria, IL | 4.0 | 2.5 | 1219 | $2,100 | $1.72 | 13d | 1 | 0.64mi |
| 1019 N Farmington Rd Unit 1017 Peoria, IL | 3.0 | 1.0 | 1304 | $1,600 | $1.23 | 43d | 1 | 0.64mi |
| 102 N Cedar Ave West Peoria, IL | 4.0 | 1.0 | 1272 | $995 | $0.78 | 43d | 1 | 0.76mi |
| 1801 N Gentry Ln West Peoria, IL | 3.0 | 1.0 | 1000 | $1,650 | $1.65 | 13d | 1 | 0.83mi |
| 2317 W Martin Luther King Junior Dr Peoria, IL | 1.0–2.0 | 1.0 | 697 | $800 | $1.15 | 13d | 3 | 0.88mi |
| 2317 W Martin Luther King Junior Dr Unit 2-214 Peoria, IL | 2.0 | 1.0 | 807 | $800 | $0.99 | 43d | 1 | 0.88mi |
| 2807 W Howett St Peoria, IL | 3.0 | 2.0 | 1388 | $1,550 | $1.12 | 43d | 1 | 1.07mi |
| 1401 W Adrian G Hinton Ave Peoria, IL | 2.0 | 1.0 | 1100 | $775 | $0.70 | 43d | 1 | 1.12mi |
| 1220 W John H Gwynn Jr Ave Peoria, IL | 2.0 | 1.0 | 853 | $745 | $0.87 | 21d | 1 | 1.16mi |
| 1540 W Kettelle St Peoria, IL | 3.0 | 1.0 | 1001 | $748 | $0.75 | 13d | 1 | 1.20mi |
| 3001 W Wiswall St Peoria, IL | 2.0 | 1.0 | 1000 | $1,100 | $1.10 | 13d | 1 | 1.25mi |
| 2109 N Abbey Cir Peoria, IL | 3.0 | 2.0 | 1088 | $1,009 | $0.93 | 13d | 1 | 1.27mi |
| 3031 W Wiswall St Peoria, IL | 2.0 | 1.0 | 1100 | $1,100 | $1.00 | 13d | 1 | 1.28mi |
| 2116 W Proctor St Peoria, IL | 2.0 | 1.0 | 912 | $879 | $0.96 | 13d | 1 | 1.38mi |
| 906 S Tonti Cir Peoria, IL | 2.0 | 1.0 | 780 | $950 | $1.22 | 13d | 1 | 1.41mi |
| 1214 W Butler St Peoria, IL | 4.0 | 1.0 | 1440 | $795 | $0.55 | 43d | 1 | 1.43mi |
| 2822 W Antoinette St Peoria, IL | 2.0 | 1.0 | 720 | $1,149 | $1.60 | 21d | 1 | 1.43mi |
| 2610 N Renwood Ave Peoria, IL | 2.0 | 1.0 | 904 | $1,300 | $1.44 | 13d | 1 | 1.49mi |
Listing history 4 events
-
2026-06-16status $95,000 Pending 1 DOM
-
2026-06-15status $95,000 Active 1 DOM
-
2026-06-13remarks 699-char remark
-
2026-06-13$95,000 Coming Soon 1 DOM
ⓘ Source: listings_history table (triggers on properties + properties_extension) + one-shot
backfill from property_details.listing_events for pre-trigger history.
Tax reassessment forecast IL · Partial reset (capped growth)
- Current annual tax
- $3,146 · $262/mo
- Projected year-2 tax
- $3,146 · $262/mo
- Expected delta
- $0/yr ($0/mo · -0.0%)
ⓘ Screening estimate from a state-policy table — verify with the county assessor before closing.
Climate risk First Street
- Flood 1/10 Low FEMA zone X · 0% chance over 30 yrs
- Wildfire 1/10 Low
- Heat 3/10 Moderate 7 d/yr ≥105°F today · 18 d/yr by 30 yrs out
- Wind 2/10 Low 100% chance of damaging wind over 30 yrs
- Air quality 3/10 Moderate 1 unhealthy d/yr today · 3 by 30 yrs out
Nearby sold comps map
Loading sold comps map…
Walkable amenities ~0.75 mi
Loading nearby amenities…
Taxation est. · year 1
- Rental income
- $15,483
- − Mortgage interest
- −$5,321
- − Property taxes
- −$3,146
- − Insurance
- −$475
- − Repairs & maintenance
- −$1,239
- − Management
- −$1,239
- − Depreciation
- −$2,764
- Taxable income
- $1,299
- Est. tax owed @ 24.0%
- −$312
- After-tax cash flow
- $2,320/yr
For passive investors: Depreciation is non-cash, so a rental often shows a tax loss while cash-flowing — sheltering income. Rental losses are passive: they offset passive income freely, and up to $25,000/yr can offset ordinary (W-2) income if you actively participate and your MAGI is under $100k (phasing out to $0 by $150k); unused losses carry forward. On sale, claimed depreciation is recaptured at up to 25%, and gains may owe capital-gains tax (a 1031 exchange can defer both). Figures are a year-1 estimate at your 24.0% rate — not tax advice; consult a CPA.
Schools (NCES district)
- District
- Peoria SD 150
- NCES district ID
- 1731230
- Math proficiency
- 11% ▼ -5.00%
- Reading proficiency
- 14% ▼ -4.00%
- Median HH income
- $41,951
- Composite
- 10.92/100
- National rank
- #9751
- State rank
- #554 of 620 in IL
Livability — West Peoria
- Score
- 76/100
- State rank
- #181
- US rank
- #3474
Category grades
Schools grade is shown separately in the Schools card above.
Census & demographics
- Census place
- West Peoria, IL
- County
- Peoria County · 120,495 people
- Metro
- Peoria, IL
- Population (ZIP)
- 28,313
- Household income
- $52,414
- Rent vs Own
- Severe rent burden
- 815.0
Population outlook (Peoria County) Hauer SSP2
- Today (2025)
- 183,007 people
- By 2030
- 179,643 · -1.8%
- By 2040
- 171,782 · -6.1%
- By 2050
- 163,508 · -10.7%
- By 2075
- 140,178 · -23.4%
- By 2100
- 114,493 · -37.4%
Race, ethnicity, and origin ACS 2023
- Neighborhood character
- Diverse neighborhood (Simpson 0.61)
- Race & ethnicity
- White 55% Black 29% Two or more races 10% Hispanic / Latino 7% Asian 2%
- Hispanic origin (detail)
- Mexican 5%
- Common ancestry
- Italian 2% Slovak 1% Iranian 1%
- Foreign-born
- 6% · Canada, China
- Languages at home
- 92% English-only · Spanish 4% Chinese 1% French/Haitian/Cajun 1%
Political lean MEDSL · Peoria
- 2024 margin
- Toss-up / Even · D 51.5% · R 46.9% · Other 1.6%
- 2008→2024 swing
- -9.2pp toward R · 2008: 13.9pp · 2024: 4.7pp
- All cycles
- 2024: D+4.7 2020: D+6.3 2016: D+2.8 2012: D+4.4 2008: D+13.9
Not yet ingested
- Civics
- —
Market trends
- HPI YoY
- ▼ -54.15%
- Current HPI
- 165.8838
- Rent YoY
- ▲ 2.30%
- Metro
- Peoria, IL
- State GDP YoY
- ▲ 1.59%
- F500 in state
- 60
Industry mix (Fortune 500 HQ in IL)
| Industry | F500 HQs | Revenue |
|---|---|---|
| Insurance | 4 | $201B |
|
||
| Consumer Goods | 4 | $87B |
|
||
| Industrial Machinery | 3 | $64B |
|
||
| Healthcare | 2 | $55B |
|
||
| Retail / Pharmacy | 1 | $148B |
|
||
| Agriculture / Food | 1 | $86B |
|
||
Price history
+58.6% since first listed10 events — show timeline
- 2026-06-12 Coming Soon $95,000 RMLSA as Distributed by MLS Grid
- 2021-08-06 Listing Removed — RMLSA as Distributed by MLS Grid
- 2019-05-31 Sold (Public Records) $111,000 Public Records
- 2019-05-29 Sold (MLS) $74,000 RMLSA as Distributed by MLS Grid
- 2019-01-14 Listed $79,900 RMLSA as Distributed by MLS Grid
- 2014-07-31 Sold (MLS) $20,500 RMLSA as Distributed by MLS Grid
- 2014-05-02 Listed $29,900 RMLSA as Distributed by MLS Grid
- 2005-08-15 Sold (Public Records) $53,000 Public Records
- 2005-08-12 Sold (MLS) $53,000 RMLSA as Distributed by MLS Grid
- 2005-05-27 Listed $59,900 RMLSA as Distributed by MLS Grid
Property tax history
+11.2%/yrLatest (2025): $3,146 · +11.5% YoY. Source: county tax records.
Cash-flow waterfall
monthlySold comps — $/sqft
last 12 mo · ≤1 miLoading sold comps…