258 North Main St Unit C22 · Spring Valley, NY
Flood risk 1/10 · Minimal
- FEMA flood zone
- X (unshaded)
- Chance of flooding over 30 yrs
- 0.0%
- Est. flood insurance / yr
- $507 – $1,088
Fire risk 1/10 · Minimal
- Est. fire insurance / yr
- $691 – $1,283
Heat risk 6/10 · Moderate
- Hot days now (above 97°F)
- 7 days/yr
- Hot days in 30 yrs
- 15 days/yr
Wind risk 4/10 · Minor
- Chance of severe wind over 30 yrs
- 24.0%
Air-quality risk 4/10 · Minor
- Unhealthy air days now
- 3 days/yr
- Unhealthy air days in 30 yrs
- 6 days/yr
Risk factors via First Street. Map © Google.
Why this score? — see what drove the C- grade
The composite is a weighted blend of 9 inputs, each scored 0–100. Each bar is that input's sub-score; the figure is the points it added to the 100-point composite (weight × sub-score).
- Cash flow +15.0/30.0
- ARV discount +15.0/15.0
- 1% rule +5.0/10.0
- DSCR +5.0/10.0
- Livability +3.4/5.0
- Schools +2.6/10.0
- Rent growth +2.5/5.0
- Condition / age +2.2/5.0
- Appreciation +0.0/10.0
$40,000
🖨 Deal sheet 📄 Offer letter ✓ Due diligence
Listing remarks
This Large One Bedroom Co-op features Kitchen, Dining Room, Living Room, Full Hallway Bathroom and Primary Bedroom. Needs T/L/C . Close to Public Transportation, Shopping and lots of Eateries.
Key facts
- Parking
- Pool
- Built 1968
Property features AI
Finance
- HOA & community: Association-managed (has association)
Exterior
- Parking: One assigned parking space; No parking fee; No carport
- Utilities: Public sewer; Electricity connected; Natural gas connected; Sewer connected; Private trash collection
- Home design: Stock cooperative
- Construction: Block and brick construction; Brick/mortar foundation
- Exterior features: In-ground pool; Not waterfront; No additional parcels
Interior
- Kitchen: Other appliances
- Bathrooms: One full bathroom
- Heating & cooling: Baseboard heating; No central cooling
- Interior features: Open floor plan; Open kitchen; No basement; One-level layout; Entry on level 2; Five total rooms
Neighborhood map
What this means for you Summary
Snapshot
- This is a 1-bed/1.0-bath condo listed at $40k. Condition is rated fair.
Deal economics
- At list price, monthly cash flow is $548 ($7k/yr) — positive.
- The deal already cash-flows at list — no discount required.
- Meets the 1% rule at list price ($2k rent vs $40k).
- Cap rate 22.7% vs local median 2.2% in Spring Valley — top-decile yield for the area; either an underpriced asset or a hidden risk that comps aren't pricing in. Stress-test before assuming the spread holds.
Location & tenants
- Location reads 67/100 on livability (#588 in NY) — a middle-class / working-renter tenant base. Strengths: commute A+, health & safety B+; Watch: employment D+, crime F, amenities F.
- East Ramapo Central School District (Spring Valley) (suburban): math 22% / reading 34% proficiency, ranked #576 of 590 in NY (top 98%) — low school quality limits family demand, transient renter base, plan for 1-2y turnover; 68% free/reduced lunch — lower-income household profile, screen leases tightly.
- Market conditions: 259 active listings in the ZIP; 3 comparable units currently listed for rent nearby; rentals leasing fast (median 1d on market — plan ~1-2 weeks tenant-placement turnaround); 429 units permitted in Rockland County in 2024 (231 in 5+ unit buildings).
Forward outlook
- Local home prices are declining (-3.0%/yr); year-one equity from $277 of loan paydown is wiped out by about $1k of value loss. Plan a longer hold.
- Rockland County population projected at +7% by 2050 — modest demand growth; plan on rents tracking national, not racing it.
- At projected returns (-3.0% appreciation + 3.0% rent growth), your $11k cash investment doubles in ~2 years — after that, you're playing with house money.
Negotiation context
- Only 11 days on market — expect competitive offers; lowballing is unlikely to land.
- 3 sale attempts; this cycle's ask is 33% above the opening price — seller raised mid-cycle; expect resistance to lowballs.
Risks & watch-outs
- Watch-outs: HOA is 38% of rent.
- Climate carrying-cost: extreme-heat days projected 7→15/yr by 2055 (HVAC capex compounding) — expect insurance premiums to compound above CPI over the hold.
Questions for the listing agent
- Have any recent inspections been done? Can we get a copy of the seller's disclosures and any deferred-maintenance estimates?
- Built in 1968 — when were the roof, HVAC, electrical panel, plumbing, and water heater last replaced?
- What does the HOA fee cover, when was the last increase, and are there any pending special assessments or reserve-fund shortfalls?
- Any open or pending special assessments — roof, HVAC, plumbing, elevator, façade? What's the per-unit balance and payoff schedule, and is the seller paying it off at close or rolling it to the buyer?
- Is there a deadline driving the sale (1031 exchange, divorce, estate, relocation)? That informs how much negotiation room exists.
- Crime grade is F in this area — have there been break-ins, vandalism, or insurance claims at this property in the last 3 years? What carrier currently insures it and at what premium?
- What's the average days-on-market for RENTAL listings here right now (not sales)? A rising rental-DOM trend means longer vacancies and softer asking-rent achievability than the comps imply.
- What's the recent tenant-quality profile in this submarket — average credit score on applications, eviction rate, late-payment / NSF rate, and stable-employment percentage? A property-management company in the area should have these aggregated.
- How much new apartment / multifamily construction is in the pipeline within 1–3 miles? Heavy new supply (>2% of stock underway) typically softens rents 12–24 months out; light construction supports rent growth.
Investment metrics
- 1% rule
- 4.97% ✓
- Cap rate
- 22.72%
- Cash-on-cash
- 58.68%
- DSCR
- 3.61
- GRM
- 1.7
CMA / ARV
- ARV (median comp)
- $74,467
- List price
- $40,000
- Delta
- -46.28%
- Verdict
- UNDERPRICED
- Comps
- 20 within 1.0 mi
Projected returns pro-forma
-3.0% appreciation · 3.0% rent growth · sell at horizon
- IRR
- 57.8%
- Equity multiple
- 3.58×
- Total profit
- $28,889
- Equity at exit
- $5,964
- IRR
- 62.8%
- Equity multiple
- 7.43×
- Total profit
- $72,060
- Equity at exit
- $3,458
Cash invested: $11,200 (down + closing). Projections, not guarantees.
Landlord ↔ Tenant lean methodology
- Overall (STATE)
- 15 Strongly Tenant-Friendly
- State New York
- 15 Strongly Tenant-Friendly · D+10
- County
- — inherits STATE
- City
- — inherits STATE
ZIP-level market 10977
- Active inventory
- 259
- Price-to-rent
- 1.7×
Monthly cashflow live
- Estimated rent
- $1,990 medium interval (Pro) →
- Mortgage (P&I)
- −$210
- Tax est. 1.5%
- −$50 /mo · $600/yr
- Insurance
- −$17
- HOA est. from 2 same-building comps
- −$748
- Vacancy / Maint / Mgmt
- −$418
- Net cashflow
- $548
Break-even live
UW: 25.0% down · 7.5% · 30yr · 1.5% tax · 5.0% vac · 8.0% maint · 8.0% mgmt
Financing live
Cash to close
- Down payment
- $10,000
- Closing costs
- $1,200
- Reserves months
- —
- Total cash needed
- —
Loan-product check · same deal, 3 products live
Conventional
25% down · 7.5% · 30yr
- Down + closing
- —
- Monthly P&I
- —
- Monthly cashflow
- —
- DSCR
- —
- Eligible?
- —
Personal DTI + credit; lowest rate.
DSCR
20% down · 8.5% · 30yr
- Down + closing
- —
- Monthly P&I
- —
- Monthly cashflow
- —
- DSCR
- —
- Eligible?
- —
No personal income docs; deal must DSCR.
Hard money
10% down · 12.0% · 12mo
- Down + closing
- —
- Monthly P&I
- —
- Monthly cashflow
- —
- DSCR
- —
- Eligible?
- —
Short-term bridge; refi at stabilization.
Rent comps 3 comps
| Address | Beds | Baths | Sqft | Rent | $/sqft | DOM | Units | Dist |
|---|---|---|---|---|---|---|---|---|
| 15 Summit Ave Spring Valley, NY | 1.0–2.0 | 1.0 | 800 | $1,700 | $2.12 | 43d | 2 | 1.38mi |
| 100 Avalon Gardens Dr Nanuet, NY | 1.0–3.0 | 1.0–2.0 | 1154 | $2,479 | $2.15 | 1d | 21 | 1.43mi |
| 42 Monsey Blvd Ramapo, NY | 1.0–2.0 | 1.0 | 620 | $1,950 | $3.15 | 1d | 2 | 1.50mi |
HOA detail condo
- Monthly dues
- $0 · $0/yr
- Assessments
- None detected in remarks — confirm with the listing agent.
Listing history 5 events
-
2026-05-07price $40,000
-
2026-05-04status Active
-
2026-04-30$30,000
-
2026-04-30historical
-
2026-04-30price $30,000
ⓘ Source: listings_history table (triggers on properties + properties_extension) + one-shot
backfill from property_details.listing_events for pre-trigger history.
Climate risk First Street
- Flood 1/10 Low FEMA zone X (unshaded) · 0% chance over 30 yrs
- Wildfire 1/10 Low
- Heat 6/10 Major 7 d/yr ≥97°F today · 15 d/yr by 30 yrs out
- Wind 4/10 Moderate 24% chance of damaging wind over 30 yrs
- Air quality 4/10 Moderate 3 unhealthy d/yr today · 6 by 30 yrs out
Nearby sold comps map
Loading sold comps map…
Walkable amenities ~0.75 mi
Loading nearby amenities…
Taxation est. · year 1
- Rental income
- $23,880
- − Mortgage interest
- −$2,241
- − Property taxes
- −$600
- − Insurance
- −$200
- − Repairs & maintenance
- −$1,910
- − Management
- −$1,910
- − HOA
- −$8,976
- − Depreciation
- −$1,164
- Taxable income
- $6,879
- Est. tax owed @ 24.0%
- −$1,651
- After-tax cash flow
- $4,921/yr
For passive investors: Depreciation is non-cash, so a rental often shows a tax loss while cash-flowing — sheltering income. Rental losses are passive: they offset passive income freely, and up to $25,000/yr can offset ordinary (W-2) income if you actively participate and your MAGI is under $100k (phasing out to $0 by $150k); unused losses carry forward. On sale, claimed depreciation is recaptured at up to 25%, and gains may owe capital-gains tax (a 1031 exchange can defer both). Figures are a year-1 estimate at your 24.0% rate — not tax advice; consult a CPA.
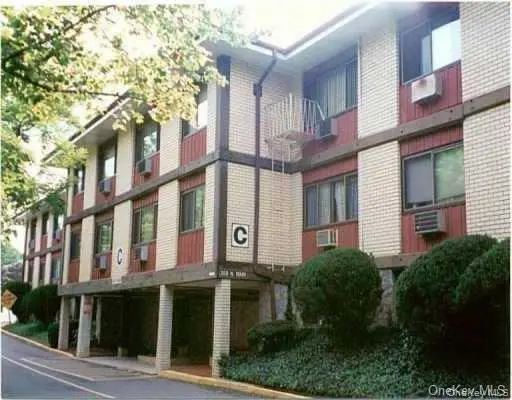
Condition & rehab AI · 7 photos
The home requires significant repairs, particularly a new roof, and some exterior maintenance. A comprehensive renovation would significantly increase its value.
Repairs flagged
- Major roof — The independent satellite image shows visible damage to the roof.
Value-add opportunities
- Both repair and replace roof — A new roof would significantly improve the home's condition and appeal, benefiting both resale and rental value.
- Both paint exterior walls — Repainting the exterior walls would enhance the home's curb appeal and value.
Renovation cost estimate screening
| Repair item | Severity | Est. cost |
|---|---|---|
| roof · The independent satellite image shows visible damage to the roof. | Major | $15,000–50,000 |
| Total estimated repair cost · 1 items | $15,000–50,000 |
Value-add ROI direction
- Both repair and replace roof — A new roof would significantly improve the home's condition and appeal, benefiting both resale and rental value. ↑
- Both paint exterior walls — Repainting the exterior walls would enhance the home's curb appeal and value. ↑
ⓘ Cost ranges are severity-bucket heuristics (US national rule-of-thumb). Get contractor quotes + a written scope before underwriting a rehab budget.
Schools (NCES district)
- District
- East Ramapo Central School District (Spring Valley)
- NCES district ID
- 3627810
- Math proficiency
- 22% ▼ -10.00%
- Reading proficiency
- 34% ▼ -2.00%
- Median HH income
- $61,547
- Composite
- 25.6/100
- National rank
- #7418
- State rank
- #576 of 590 in NY
Livability — Spring Valley
- Score
- 67/100
- State rank
- #588
- US rank
- #10623
Category grades
Schools grade is shown separately in the Schools card above.
Census & demographics
- Census place
- Spring Valley, NY
- City population
- 71,465
- Population (ZIP)
- 71,465
Population outlook (Rockland County) Hauer SSP2
- Today (2025)
- 339,642 people
- By 2030
- 345,987 · +1.9%
- By 2040
- 357,178 · +5.2%
- By 2050
- 362,456 · +6.7%
- By 2075
- 367,281 · +8.1%
- By 2100
- 328,211 · -3.4%
Race, ethnicity, and origin ACS 2023
- Neighborhood character
- Diverse neighborhood (Simpson 0.62)
- Race & ethnicity
- White 55% Hispanic / Latino 23% Black 16% Two or more races 5% Asian 3%
- Hispanic origin (detail)
- Mexican 1% Puerto Rican 2% Dominican 2%
- Common ancestry
- Hispanic 7% Romanian 5% Italian 2%
- Foreign-born
- 27% · Canada
- Languages at home
- 31% English-only · German/W. Germanic 32% Spanish 21% French/Haitian/Cajun 10%
Political lean MEDSL · Rockland
- 2024 margin
- R (+11.8) · D 44.1% · R 55.9%
- 2008→2024 swing
- -17.7pp toward R · 2008: 5.9pp · 2024: -11.8pp
- All cycles
- 2024: R+11.8 2020: D+1.7 2016: D+5.1 2012: D+6.6 2008: D+5.9
Not yet ingested
- Civics
- —
Market trends
- HPI YoY
- ▼ -518.82%
- Current HPI
- 378.2133
- Rent YoY
- —
- Metro
- —
- State GDP YoY
- ▲ 2.60%
- F500 in state
- 92
Industry mix (Fortune 500 HQ in NY)
| Industry | F500 HQs | Revenue |
|---|---|---|
| Financial Services | 10 | $950B |
|
||
| Consumer Goods | 9 | $162B |
|
||
| Insurance | 4 | $225B |
|
||
| Telecommunications | 2 | $144B |
|
||
| Pharmaceuticals | 2 | $112B |
|
||
| Media / Entertainment | 2 | $69B |
|
||
Price history
+33.3% since first listed6 events — show timeline
- 2026-05-21 Relisted — OneKey® MLS as Distributed by MLS Grid
- 2026-05-07 Price Changed $40,000 OneKey® MLS as Distributed by MLS Grid
- 2026-05-04 Relisted — OneKey® MLS as Distributed by MLS Grid
- 2026-04-30 Price Changed $30,000 OneKey® MLS as Distributed by MLS Grid
- 2026-04-30 Listing Removed — OneKey® MLS as Distributed by MLS Grid
- 2026-04-30 Listed $30,000 OneKey® MLS as Distributed by MLS Grid
Cash-flow waterfall
monthlySold comps — $/sqft
last 12 mo · ≤1 miLoading sold comps…