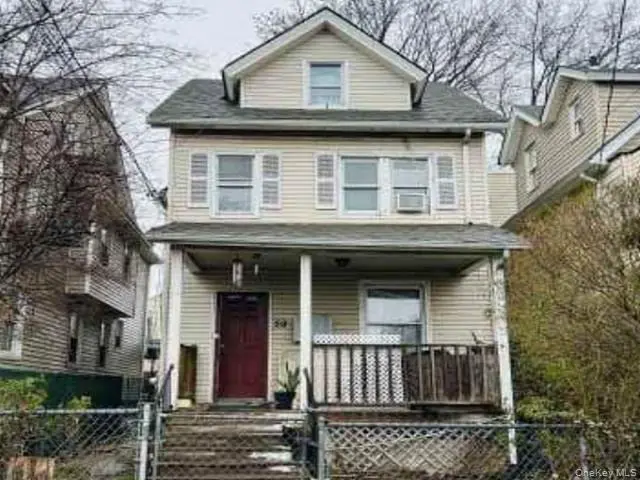
 Triplex
59 Crescent Ave · New Rochelle, NY
Flood risk 1/10 · Minimal
- FEMA flood zone
- X (unshaded)
- Chance of flooding over 30 yrs
- 0.0%
- Est. flood insurance / yr
- $473 – $860
Fire risk 1/10 · Minimal
- Est. fire insurance / yr
- $691 – $1,283
Heat risk 6/10 · Moderate
- Hot days now (above 98°F)
- 7 days/yr
- Hot days in 30 yrs
- 15 days/yr
Wind risk 6/10 · Moderate
- Chance of severe wind over 30 yrs
- 27.0%
Air-quality risk 5/10 · Moderate
- Unhealthy air days now
- 6 days/yr
- Unhealthy air days in 30 yrs
- 8 days/yr
Risk factors via First Street. Map © Google.
Why this score? — see what drove the B grade
The composite is a weighted blend of 9 inputs, each scored 0–100. Each bar is that input's sub-score; the figure is the points it added to the 100-point composite (weight × sub-score).
- Cash flow +30.0/30.0
- 1% rule +10.0/10.0
- DSCR +10.0/10.0
- ARV discount +7.5/15.0
- Schools +5.7/10.0
- Livability +3.5/5.0
- Rent growth +2.9/5.0
- Condition / age +2.5/5.0
- Appreciation +0.0/10.0
$607,500
🖨 Deal sheet (PDF) 📄 Offer letter ✓ Due diligence
Multi-family units
County records classify this as Multi-Family (2-4 Unit). Listing-text estimate: 3 units. confirmed
Listing remarks MLS
egal 3-family property located in New Rochelle. This pre-war multifamily offers approximately 1,744 sq ft of living space and is situated in a well-established urban neighborhood with close proximity to transportation, schools, parks, and neighborhood shopping. The area shows strong market activity with increasing values and typical marketing times under three months for competitively priced properties. Excellent opportunity for investors seeking long-term rental income or value-add potential. Property is being sold as-is.
Key facts
- 2,178 sq ft lot
- Built 1885
- Listed 72 days
Neighborhood map
What this means for you Summary
Snapshot
- This is a 3 × 2-bed/3.0-bath units multifamily listed at $608k.
Deal economics
- At list price, monthly cash flow is $4k ($49k/yr) — positive. Per door: $1k/mo.
- The deal already cash-flows at list — no discount required.
- Meets the 1% rule at list price ($10k rent vs $608k).
- Recommended offer: $571k (6.0% below list) — sets the bar for market timing.
Location & tenants
- Location reads 69/100 on livability (#487 in NY) — a middle-class / working-renter tenant base. Strengths: employment A+, crime A, amenities B+; Watch: housing D+, commute F, cost of living F.
- New Rochelle City School District (suburban): math 63% / reading 66% proficiency, ranked #171 of 590 in NY (top 29%) — acceptable for families but not a draw, mixed tenant base, ~2y average lease.
- Zoned schools: New Rochelle High School (math 87% / reading 72%, grade A-, #518 of 1,100 statewide, top 51%, 3,076 students, 57% FRL) — zoned schools average 57% FRL vs 41% district-wide (16 pts higher); higher-poverty schools than district average — tighter screening recommended.
- Zoned-school proficiency averages 80% at this address vs 64% district-wide (+15 pts) — the actual schools serving this property are materially stronger than the New Rochelle City School District average implies; a family-tenant draw the district grade alone would hide.
- Market conditions: Rents rising (+1.4%/yr); 141 active listings in the ZIP; 30 comparable units currently listed for rent nearby; rentals leasing fast (median 9d on market — plan ~1-2 weeks tenant-placement turnaround); solid renter incomes; 954 units permitted in Westchester County in 2024 (649 in 5+ unit buildings).
Forward outlook
- Local home prices are declining (-3.0%/yr); year-one equity from $4k of loan paydown is wiped out by about $18k of value loss. Plan a longer hold.
- Westchester County population projected at +10% by 2050 — modest demand growth; plan on rents tracking national, not racing it.
- At projected returns (-3.0% appreciation + 1.4% rent growth), your $170k cash investment doubles in ~5 years — after that, you're playing with house money.
Negotiation context
- It's been on market 72 days — a 6% lower offer ($571k) is reasonable based on typical stale-listing flexibility.
- 5 sale attempts since 23y ago; this cycle's ask has dropped $66k (10%) from the opening price — seller is motivated, your offer sets the floor, not the list.
- Current owner paid $460k; 32% above their basis — modest negotiation headroom, anchor on the comps not their cost.
Risks & watch-outs
- Watch-outs: built in 1885 — expect roof / HVAC / electrical / plumbing capex.
- Climate carrying-cost: major wind risk, 27% chance of damaging wind over 30y; extreme-heat days projected 7→15/yr by 2055 (HVAC capex compounding) — expect insurance premiums to compound above CPI over the hold.
Questions for the listing agent
- It's been on market 72 days. Have you received any prior offers? Is the seller open to a 6% concession, seller financing, or rate buy-down credit?
- Can we see the unit-by-unit rent roll, current vacancy, and any below-market leases? What's the average tenancy length?
- What capital expenditures (roof, boiler, parking lot, exteriors) have been made in the last 5 years, and what's planned in the next 2?
- Built in 1885 — when were the roof, HVAC, electrical panel, plumbing, and water heater last replaced?
- Why hasn't it sold? Are there any deal-killer items the seller is aware of (foundation, flood, title, zoning, code violations)?
- Is there a deadline driving the sale (1031 exchange, divorce, estate, relocation)? That informs how much negotiation room exists.
- What's the average days-on-market for RENTAL listings here right now (not sales)? A rising rental-DOM trend means longer vacancies and softer asking-rent achievability than the comps imply.
- What's the recent tenant-quality profile in this submarket — average credit score on applications, eviction rate, late-payment / NSF rate, and stable-employment percentage? A property-management company in the area should have these aggregated.
- How much new apartment / multifamily construction is in the pipeline within 1–3 miles? Heavy new supply (>2% of stock underway) typically softens rents 12–24 months out; light construction supports rent growth.
Investment metrics
- 1% rule
- 1.70% ✓
- Cap rate
- 14.43%
- Cash-on-cash
- 29.07%
- DSCR
- 2.29
- GRM
- 4.9
CMA / ARV
- ARV (median comp)
- $1,215,137
- List price
- $607,500
- Delta
- -50.01%
- Verdict
- UNDERPRICED
- Comps
- 20 within 1.0 mi
Show comp detail 2 sales within ~0.75 mi
| Address | Dist | Beds/Ba | Sqft | Sold | Price | $/sf | Match |
|---|---|---|---|---|---|---|---|
| 19 Jones St | 0.20mi | 4/2.0 (+1) | 1,840 (+6%) | 9mo | $765,000 | $416 | 64 |
| 5 Hill St | 0.56mi | 3/2.0 | 1,820 (+4%) | 17mo | $721,000 | $396 | 47 |
Match score weights: distance 35% · size 25% · config 20% · recency 20%. Top-matched comps best support the ARV.
Projected returns pro-forma
-3.0% appreciation · 1.42% rent growth · sell at horizon
- IRR
- 21.7%
- Equity multiple
- 1.87×
- Total profit
- $147,893
- Equity at exit
- $90,580
- IRR
- 28.7%
- Equity multiple
- 3.37×
- Total profit
- $402,768
- Equity at exit
- $52,525
Cash invested: $170,100 (down + closing). Projections, not guarantees.
Landlord ↔ Tenant lean methodology
- Overall (STATE)
- 15 Strongly Tenant-Friendly
- State New York
- 15 Strongly Tenant-Friendly · D+10
- County
- — inherits STATE
- City
- — inherits STATE
ZIP-level market 10801
- Rents YoY
- 1.4%
- Active inventory
- 141
- Price-to-rent
- 14.7×
Monthly cashflow live
- Estimated rent
- $10,302 high interval (Pro) →
- Mortgage (P&I)
- −$3,186
- Tax from tax record
- −$580 /mo · $6,954/yr
- Insurance
- −$253
- HOA
- −$0
- Vacancy / Maint / Mgmt
- −$2,163
- Net cashflow
- $4,120
Break-even live
Sensitivity live
| Price | -10% $4,464 | -5% $4,292 | +0% $4,120 | +5% $3,948 | +10% $3,776 |
|---|---|---|---|---|---|
| Rent | -10% $3,306 | -5% $3,713 | +0% $4,120 | +5% $4,527 | +10% $4,934 |
| Rate | -1.0pp $4,426 | -0.5pp $4,275 | base $4,120 | +0.5pp $3,963 | +1.0pp $3,803 |
3-unit breakdown (identical units grouped — click to expand)
| Units | Beds | Baths | Est. rent |
|---|---|---|---|
| 3× units | 2 | 3 | $10,302 |
| #1 | 2 | 3 | $3,434 |
| #2 | 2 | 3 | $3,434 |
| #3 | 2 | 3 | $3,434 |
| Total (3 units) | $10,302 | ||
UW: 25.0% down · 7.5% · 30yr · 1.5% tax · 5.0% vac · 8.0% maint · 8.0% mgmt
Financing live
Cash to close
- Down payment
- $151,875
- Closing costs
- $18,225
- Reserves months
- —
- Total cash needed
- —
Loan-product check · same deal, 3 products live
Conventional
25% down · 7.5% · 30yr
- Down + closing
- —
- Monthly P&I
- —
- Monthly cashflow
- —
- DSCR
- —
- Eligible?
- —
Personal DTI + credit; lowest rate.
DSCR
20% down · 8.5% · 30yr
- Down + closing
- —
- Monthly P&I
- —
- Monthly cashflow
- —
- DSCR
- —
- Eligible?
- —
No personal income docs; deal must DSCR.
Hard money
10% down · 12.0% · 12mo
- Down + closing
- —
- Monthly P&I
- —
- Monthly cashflow
- —
- DSCR
- —
- Eligible?
- —
Short-term bridge; refi at stabilization.
Rent comps 30 comps
| Address | Beds | Baths | Sqft | Rent | $/sqft | DOM | Units | Dist |
|---|---|---|---|---|---|---|---|---|
| 387 Huguenot St New Rochelle, NY | 2.0 | 1.0–2.0 | 753 | $3,575 | $4.75 | 0d | 5 | 0.17mi |
| 379 Huguenot St Unit 2 New Rochelle, NY | 3.0 | 1.0 | 1150 | $3,200 | $2.78 | 26d | 1 | 0.18mi |
| 333 Huguenot St New Rochelle, NY | 2.0 | 1.0–2.0 | 847 | $4,785 | $5.65 | 0d | 12 | 0.19mi |
| 360 Huguenot St New Rochelle, NY | 2.0 | 1.0–2.0 | 777 | $3,780 | $4.86 | 0d | 15 | 0.20mi |
| 325 Huguenot St New Rochelle, NY | 1.0–2.0 | 1.0–2.0 | 989 | $4,625 | $4.68 | 0d | 9 | 0.21mi |
| 194 Webster Ave Unit 1 New Rochelle, NY | 3.0 | 1.0 | 1050 | $3,500 | $3.33 | 45d | 1 | 0.22mi |
| 25 Maple Ave New Rochelle, NY | 2.0 | 1.0–2.0 | 748 | $3,897 | $5.21 | 0d | 10 | 0.27mi |
| 40 Memorial Hwy New Rochelle, NY | 3.0 | 1.0–2.0 | 917 | $4,580 | $4.99 | 0d | 49 | 0.31mi |
| 25 Leroy Pl #1 New Rochelle, NY | 2.0 | 2.5 | 1420 | $3,995 | $2.81 | 8d | 1 | 0.33mi |
| 1 Shearwood Pl New Rochelle, NY | 3.0 | 1.0–2.0 | 896 | $4,108 | $4.58 | 0d | 29 | 0.36mi |
| 55 Clinton Pl New Rochelle, NY | 3.0 | 1.0–2.0 | 991 | $6,747 | $6.80 | 0d | 24 | 0.38mi |
| 12 Church St New Rochelle, NY | 2.0 | 1.0–2.0 | 770 | $4,540 | $5.90 | 0d | 49 | 0.39mi |
| 50 Clinton Pl New Rochelle, NY | 2.0 | 1.0–2.0 | 844 | $7,811 | $9.25 | 0d | 32 | 0.41mi |
| 10 Lecount Pl New Rochelle, NY | 2.0 | 1.0–2.0 | 826 | $5,175 | $6.26 | 0d | 15 | 0.48mi |
| 175 Huguenot St #1402 New Rochelle, NY | 2.0 | 2.5 | 1475 | $4,750 | $3.22 | 26d | 1 | 0.51mi |
| 9 9th St Unit 1st Floor New Rochelle, NY | 3.0 | 1.0 | 1463 | $3,400 | $2.32 | 45d | 1 | 0.60mi |
| 10 9th St Unit 2 New Rochelle, NY | 2.0 | 1.0 | 1185 | $2,850 | $2.41 | 45d | 1 | 0.63mi |
| 133 Lincoln Ave Unit 1 New Rochelle, NY | 3.0 | 1.0 | 1112 | $6,500 | $5.85 | 4d | 1 | 0.64mi |
| 72 Soundview St Unit 2 New Rochelle, NY | 4.0 | 2.0 | 1500 | $3,850 | $2.57 | 45d | 1 | 0.69mi |
| 25 Acacia Ter Unit 1 New Rochelle, NY | 3.0 | 2.0 | 1400 | $3,800 | $2.71 | 45d | 1 | 0.79mi |
| 7 Alpha Pl Unit First floor New Rochelle, NY | 3.0 | 2.0 | 1538 | $4,700 | $3.06 | 20d | 1 | 0.80mi |
| 48 Lincoln St New Rochelle, NY | 2.0 | 1.0 | 1273 | $3,000 | $2.36 | 20d | 1 | 0.81mi |
| 300 Pelham Rd New Rochelle, NY | 2.0 | 1.0 | 1200 | $3,195 | $2.66 | 0d | 1 | 0.82mi |
| 14 Horton Ave Unit 3rd Fl New Rochelle, NY | 4.0 | 1.0 | 1300 | $3,600 | $2.77 | 45d | 1 | 0.83mi |
| 26 Coligni Ave Apt 12 New Rochelle, NY | 3.0 | 1.0 | 1100 | $3,950 | $3.59 | 45d | 1 | 0.88mi |
| 7 Lanecrest Ave New Rochelle, NY | 2.0 | 1.0 | 1100 | $2,690 | $2.45 | 19d | 1 | 0.88mi |
| 123 Clinton Ave Unit 2 New Rochelle, NY | 4.0 | 2.0 | 1378 | $4,250 | $3.08 | 45d | 1 | 0.93mi |
| 600 North Ave New Rochelle, NY | 2.0 | 1.0–2.0 | 869 | $4,350 | $5.01 | 0d | 10 | 1.02mi |
| 18 Shady Glen Ct New Rochelle, NY | 2.0 | 2.0 | 1700 | $5,800 | $3.41 | 13d | 1 | 1.05mi |
| 131 Pelhamdale Ave Mount Vernon, NY | 2.0 | 2.0 | 1600 | $3,300 | $2.06 | 6d | 1 | 1.47mi |
Listing history 29 events
-
2026-06-21days on market $607,500 Active 72 DOM
-
2026-06-18days on market $607,500 Active 69 DOM
-
2026-06-17pricedays on market $607,500 Active 68 DOM
-
2026-06-16days on market $639,500 Active 67 DOM
-
2026-06-15days on market $639,500 Active 66 DOM
-
2026-06-13days on market $639,500 Active 64 DOM
-
2026-06-09days on market $639,500 Active 60 DOM
-
2026-06-08days on market $639,500 Active 59 DOM
-
2026-06-07days on market $639,500 Active 58 DOM
-
2026-06-04days on market $639,500 Active 55 DOM
-
2026-06-03days on market $639,500 Active 54 DOM
-
2026-06-02days on market $639,500 Active 53 DOM
-
2026-06-01days on market $639,500 Active 52 DOM
-
2026-05-31days on market $639,500 Active 51 DOM
-
2026-05-15price $639,500 528-char remark
Show marketing remark (528 chars)
egal 3-family property located in New Rochelle. This pre-war multifamily offers approximately 1,744 sq ft of living space and is situated in a well-established urban neighborhood with close proximity to transportation, schools, parks, and neighborhood shopping. The area shows strong market activity with increasing values and typical marketing times under three months for competitively priced properties. Excellent opportunity for investors seeking long-term rental income or value-add potential. Property is being sold as-is.
-
2026-04-10$673,100 Active 528-char remark
Show marketing remark (528 chars)
egal 3-family property located in New Rochelle. This pre-war multifamily offers approximately 1,744 sq ft of living space and is situated in a well-established urban neighborhood with close proximity to transportation, schools, parks, and neighborhood shopping. The area shows strong market activity with increasing values and typical marketing times under three months for competitively priced properties. Excellent opportunity for investors seeking long-term rental income or value-add potential. Property is being sold as-is.
-
2024-01-22status Pending
-
2024-01-22historical
-
2024-01-18$425,000 Active
-
2007-03-08historical
-
2006-12-06
-
2006-03-16soldstatus $460,000
-
2005-12-08soldstatus $460,000
-
2005-09-20price $489,000
-
2005-09-20historical
-
2005-08-09$460,000
-
2003-08-05historical
-
2003-03-05
-
1999-11-19soldstatus $65,000
ⓘ Source: listings_history table (triggers on properties + properties_extension) + one-shot
backfill from property_details.listing_events for pre-trigger history.
Tax reassessment forecast NY · Partial reset (capped growth)
- Current annual tax
- $6,954 · $580/mo
- Projected year-2 tax
- $8,611 · $718/mo
- Expected delta
- +$1,656/yr (+$138/mo · 23.8%)
ⓘ Screening estimate from a state-policy table — verify with the county assessor before closing.
Climate risk First Street
- Flood 1/10 Low FEMA zone X (unshaded) · 0% chance over 30 yrs
- Wildfire 1/10 Low
- Heat 6/10 Major 7 d/yr ≥98°F today · 15 d/yr by 30 yrs out
- Wind 6/10 Major 27% chance of damaging wind over 30 yrs
- Air quality 5/10 Major 6 unhealthy d/yr today · 8 by 30 yrs out
Nearby sold comps map
Loading sold comps map…
Walkable amenities ~0.75 mi
Loading nearby amenities…
Taxation est. · year 1
- Rental income
- $123,624
- − Mortgage interest
- −$34,029
- − Property taxes
- −$6,954
- − Insurance
- −$3,038
- − Repairs & maintenance
- −$9,890
- − Management
- −$9,890
- − Depreciation
- −$17,673
- Taxable income
- $42,150
- Est. tax owed @ 24.0%
- −$10,116
- After-tax cash flow
- $39,326/yr
For passive investors: Depreciation is non-cash, so a rental often shows a tax loss while cash-flowing — sheltering income. Rental losses are passive: they offset passive income freely, and up to $25,000/yr can offset ordinary (W-2) income if you actively participate and your MAGI is under $100k (phasing out to $0 by $150k); unused losses carry forward. On sale, claimed depreciation is recaptured at up to 25%, and gains may owe capital-gains tax (a 1031 exchange can defer both). Figures are a year-1 estimate at your 24.0% rate — not tax advice; consult a CPA.
Schools (NCES district)
- District
- New Rochelle City School District
- NCES district ID
- 3620490
- Math proficiency
- 63% ▲ 3.00%
- Reading proficiency
- 66% ▲ 9.00%
- Median HH income
- $69,165
- Composite
- 56.63/100
- National rank
- #1139
- State rank
- #171 of 590 in NY
Livability — New Rochelle
- Score
- 69/100
- State rank
- #487
- US rank
- #8572
Category grades
Schools grade is shown separately in the Schools card above.
Census & demographics
- Census place
- New Rochelle, NY
- County
- Westchester County · 709,332 people
- City population
- 63,657
- Metro
- New York-Newark-Jersey City, NY-NJ-PA
- Population (ZIP)
- 42,754
- Household income
- $85,573
- Rent vs Own
- Severe rent burden
- 2797.0
Population outlook (Westchester County) Hauer SSP2
- Today (2025)
- 1,028,035 people
- By 2030
- 1,051,636 · +2.3%
- By 2040
- 1,098,520 · +6.9%
- By 2050
- 1,136,044 · +10.5%
- By 2075
- 1,196,925 · +16.4%
- By 2100
- 1,175,147 · +14.3%
Race, ethnicity, and origin ACS 2023
- Neighborhood character
- Highly diverse neighborhood (Simpson 0.72)
- Race & ethnicity
- Hispanic / Latino 36% White 30% Black 24% Two or more races 16% Asian 7%
- Hispanic origin (detail)
- Mexican 17% Puerto Rican 5% Dominican 3%
- Common ancestry
- Hispanic 3% Scotch-Irish 1% Romanian 1%
- Foreign-born
- 34% · Canada, Jamaica, China
- Languages at home
- 54% English-only · Spanish 32% Other Indo-European 5% French/Haitian/Cajun 4%
Political lean MEDSL · Westchester
- 2024 margin
- Strong D (+26.3) · D 63.1% · R 36.9%
- 2008→2024 swing
- -1.3pp toward R · 2008: 27.6pp · 2024: 26.3pp
- All cycles
- 2024: D+26.3 2020: D+36.3 2016: D+32.8 2012: D+22.2 2008: D+27.6
Not yet ingested
- Civics
- —
Market trends
- HPI YoY
- ▼ -910.37%
- Current HPI
- 270.8019
- Rent YoY
- ▲ 1.42%
- Metro
- New York-Newark-Jersey City, NY-NJ-PA
- State GDP YoY
- ▲ 2.60%
- F500 in state
- 92
Industry mix (Fortune 500 HQ in NY)
| Industry | F500 HQs | Revenue |
|---|---|---|
| Financial Services | 10 | $950B |
|
||
| Consumer Goods | 9 | $162B |
|
||
| Insurance | 4 | $225B |
|
||
| Telecommunications | 2 | $144B |
|
||
| Pharmaceuticals | 2 | $112B |
|
||
| Media / Entertainment | 2 | $69B |
|
||
Price history
+883.8% since first listed15 events — show timeline
- 2026-05-15 Price Changed $639,500 OneKey® MLS as Distributed by MLS Grid
- 2026-04-10 Listed $673,100 OneKey® MLS as Distributed by MLS Grid
- 2024-01-22 Pending — OneKey® MLS as Distributed by MLS Grid
- 2024-01-22 Listing Removed — OneKey® MLS as Distributed by MLS Grid
- 2024-01-18 Listed $425,000 OneKey® MLS as Distributed by MLS Grid
- 2007-03-08 Delisted — HGMLS
- 2006-12-06 Listed — HGMLS
- 2006-03-16 Sold (Public Records) $460,000 Public Records
- 2005-12-08 Sold (MLS) $460,000 HGMLS
- 2005-09-20 Delisted — HGMLS
- 2005-09-20 Price Changed $489,000 HGMLS
- 2005-08-09 Listed $460,000 HGMLS
- 2003-08-05 Delisted — HGMLS
- 2003-03-05 Listed — HGMLS
- 1999-11-19 Sold (Public Records) $65,000 Public Records
Property tax history
-3.4%/yrLatest (2025): $6,954 · -28.4% YoY. Source: county tax records.
Cash-flow waterfall
monthlySold comps — $/sqft
last 12 mo · ≤1 miLoading sold comps…