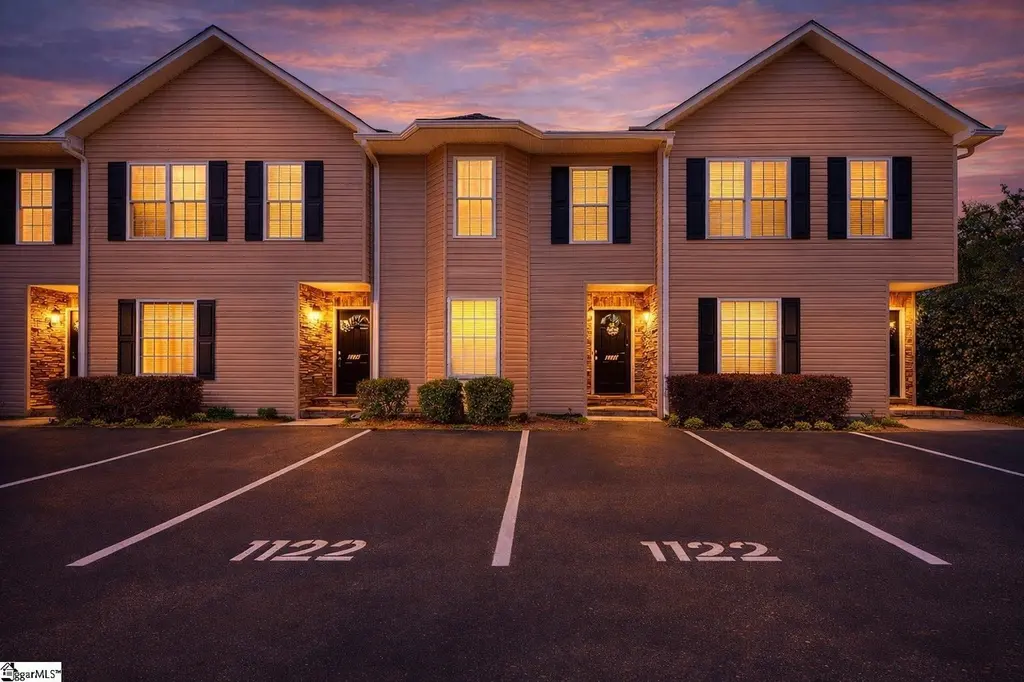
1122 E Lee Rd · Wade Hampton, SC
Flood risk 1/10 · Minimal
- FEMA flood zone
- X (unshaded)
- Chance of flooding over 30 yrs
- 0.0%
- Est. flood insurance / yr
- $473 – $860
Fire risk 1/10 · Minimal
- Est. fire insurance / yr
- $783 – $1,453
Heat risk 6/10 · Moderate
- Hot days now (above 103°F)
- 7 days/yr
- Hot days in 30 yrs
- 17 days/yr
Wind risk 2/10 · Minimal
- Chance of severe wind over 30 yrs
- 1.0%
Air-quality risk 4/10 · Minor
- Unhealthy air days now
- 4 days/yr
- Unhealthy air days in 30 yrs
- 5 days/yr
Risk factors via First Street. Map © Google.
Why this score? — see what drove the D+ grade
The composite is a weighted blend of 9 inputs, each scored 0–100. Each bar is that input's sub-score; the figure is the points it added to the 100-point composite (weight × sub-score).
- ARV discount +15.0/15.0
- Cash flow +12.1/30.0
- Schools +4.2/10.0
- Livability +3.8/5.0
- DSCR +3.6/10.0
- 1% rule +3.4/10.0
- Condition / age +2.5/5.0
- Rent growth +2.4/5.0
- Appreciation +0.0/10.0
$212,000
🖨 Deal sheet 📄 Offer letter ✓ Due diligence
Listing remarks
Welcome to 1122 E Lee Rd, a rare opportunity to own a freshly updated, move-in ready 3BR/2.5BA townhome in the heart of Taylors at an exceptional value. Recently fully repainted, this spacious, open-concept floor plan offers over 1,500 square feet of comfortable living, perfect for both everyday living and entertaining. The main level features a bright and inviting living area that flows seamlessly into the dining space and kitchen, complete with ample cabinetry, stainless refrigerator, and all appliances included (even the clothes washer and dryer). Upstairs, the generously sized primary suite offers a private retreat with a full en-suite bath and large walk-in closet, while two additional
Key facts
- Move-in ready
- Ample cabinetry
- $100 HOA
Tags
Property features AI
Finance
- HOA & community: Property is part of an HOA; HOA covers exterior maintenance, insurance, lawn maintenance, street lights, termite contract, and bylaws
Exterior
- Parking: Assigned parking for 2 spaces
- Utilities: Public water; Electric water heater; Public sewer; Public garbage pickup
- Home design: Two-story residential property; Approximate age: 31–50 years; Crawl space foundation
- Construction: Partial brick veneer; Vinyl siding; Wood elements; Architectural roof
- Exterior features: Screened porch; Tilt-out windows; Vinyl/aluminum trim; Thermal windows; Level lot; Underground utilities
Interior
- Kitchen: Dishwasher; Disposal; Electric oven; Built-in microwave; Refrigerator
- Bedrooms: Primary bedroom on 2nd level with full bath, tub/shower and walk-in closet (approx. 15 x 14); Second bedroom approx. 12 x 11; Third bedroom approx. 11 x 9
- Flooring: Carpet; Vinyl; Luxury vinyl tile/plank
- Bathrooms: 2 full bathrooms; 1 half bathroom
- Heating & cooling: Electric forced air heating; Central forced cooling (electric)
- Interior features: Attic stairs (disappearing); Cable available; 9+ foot ceilings; Ceiling fans; Smooth ceilings; Solid surface countertops; Laminate countertops; Open floor plan; Smoke detector; Walk-in closets; Attic (storage)
- Laundry & utility: Laundry on 1st floor in closet-style space; Washer connection; Electric dryer hookup
Neighborhood map
What this means for you Summary
Snapshot
- This is a 3-bed/2.5-bath single-family listed at $212k.
Deal economics
- At list price, monthly cash flow is $-45 ($-541/yr) — negative.
- To cash-flow at today's rent, offer at most $204k (3.8% below list).
- To meet the 1% rule (rent ≥ 1% of price), the offer needs to be $178k (16.2% below list).
- Recommended offer: $178k (16.2% below list) — sets the bar for 1% rule.
- Cap rate 6.0% vs local median 2.8% in Wade Hampton — top-decile yield for the area; either an underpriced asset or a hidden risk that comps aren't pricing in. Stress-test before assuming the spread holds.
Location & tenants
- Location reads 75/100 on livability (#26 in SC, #3,981 nationally) — a middle-class / working-renter tenant base. Strengths: housing A+, cost of living A-, health & safety A-; Watch: commute D+, amenities F.
- Greenville 01 (suburban): math 44% / reading 54% proficiency, ranked #10 of 80 in SC (top 12%) — families likely to look elsewhere, expect single-tenant / working-renter base with shorter leases.
- Zoned schools: Lake Forest Elementary (math 45% / reading 42%, grade F, #246 of 597 statewide, top 42%, 809 students, 100% FRL) — zoned schools average 100% FRL vs 42% district-wide (58 pts higher); higher-poverty schools than district average — tighter screening recommended.
- Market conditions: Rents soft (-0.5%/yr); 299 active listings in the ZIP; 9 comparable units currently listed for rent nearby; rentals at typical pace (median 24d on market — plan ~3-4 weeks tenant-placement turnaround); solid renter incomes; 5,595 units permitted in Greenville County in 2024 (566 in 5+ unit buildings).
Forward outlook
- Local home prices are declining (-3.0%/yr); year-one equity from $1k of loan paydown is wiped out by about $6k of value loss. Plan a longer hold.
- Greenville County population projected at +34% by 2050 — long-run rental-demand tailwind backs the buy-and-hold thesis.
Negotiation context
- It's been on market 77 days — a 6% lower offer ($199k) is reasonable based on typical stale-listing flexibility.
- 13 sale attempts since 17y ago with the ask held roughly flat each time — persistent listings suggest the price (not the market) is what's stuck; bring a comps-based counter.
Risks & watch-outs
- Climate carrying-cost: extreme-heat days projected 7→17/yr by 2055 (HVAC capex compounding) — expect insurance premiums to compound above CPI over the hold.
Questions for the listing agent
- What do current leases actually rent for vs. the listed asking? Can we see a recent rent roll and the last 12 months of T-12 income?
- It's been on market 77 days. Have you received any prior offers? Is the seller open to a 16% concession, seller financing, or rate buy-down credit?
- What does the HOA fee cover, when was the last increase, and are there any pending special assessments or reserve-fund shortfalls?
- Why hasn't it sold? Are there any deal-killer items the seller is aware of (foundation, flood, title, zoning, code violations)?
- Is there a deadline driving the sale (1031 exchange, divorce, estate, relocation)? That informs how much negotiation room exists.
- Schools are B-rated — typically a magnet for longer-tenancy family renters. What's the average tenant stay here, and is there a school-zone premium baked into asking?
- The area grade is low — what's the realistic commute time and amenity access for the typical tenant pool here? Any planned neighborhood developments (good or bad) we should know about?
- What's the average days-on-market for RENTAL listings here right now (not sales)? A rising rental-DOM trend means longer vacancies and softer asking-rent achievability than the comps imply.
- What's the recent tenant-quality profile in this submarket — average credit score on applications, eviction rate, late-payment / NSF rate, and stable-employment percentage? A property-management company in the area should have these aggregated.
- How much new for-sale + rental construction is in the pipeline within 1–3 miles? Heavy new supply typically softens prices + rents 12–24 months out; constrained supply supports both.
Investment metrics
- 1% rule
- 0.84% ✗
- Cap rate
- 6.04%
- Cash-on-cash
- -0.91%
- DSCR
- 0.96
- GRM
- 9.9
CMA / ARV
- ARV (on-the-fly)
- $319,032
- Comps found
- 12
Show comp detail 12 sales within ~0.75 mi
| Address | Dist | Beds/Ba | Sqft | Sold | Price | $/sf | Match |
|---|---|---|---|---|---|---|---|
| 103 Brushy Creek Rd | 0.27mi | 3/2.0 | 1,541 (+2%) | 2mo | $275,000 | $178 | 80 |
| 7 Hastings Cir | 0.44mi | 3/1.5 | 1,472 (-3%) | 6mo | $315,000 | $214 | 66 |
| 301 Havenhurst Dr | 0.64mi | 3/2.0 | 1,582 (+5%) | 2mo | $415,100 | $262 | 59 |
| 19 Owens Rd | 0.43mi | 3/1.5 | 1,422 (-6%) | 10mo | $280,000 | $197 | 58 |
| 126 Avon Dr | 0.60mi | 3/2.0 | 1,401 (-7%) | 1mo | $249,900 | $178 | 57 |
| 102 Longwood Dr | 0.24mi | 3/1.5 | 1,307 (-14%) | 8mo | $290,000 | $222 | 56 |
| 4 Kitty Ln | 0.63mi | 3/2.0 | 1,460 (-3%) | 10mo | $335,000 | $229 | 54 |
| 2 Runion Dr | 0.40mi | 3/1.5 | 1,644 (+9%) | 11mo | $230,000 | $140 | 53 |
| 3507 Edwards Rd | 0.66mi | 3/1.5 | 1,400 (-7%) | 2mo | $280,800 | $201 | 52 |
| 102 Coral Dr | 0.54mi | 3/2.0 | 1,400 (-7%) | 11mo | $295,000 | $211 | 52 |
| 3302 Edwards Rd | 0.74mi | 4/2.5 (+1) | 1,358 (-10%) | 5mo | $264,000 | $194 | 39 |
| 5 Brewster Dr | 0.75mi | 3/2.0 | 1,300 (-14%) | 3mo | $360,000 | $277 | 37 |
Match score weights: distance 35% · size 25% · config 20% · recency 20%. Top-matched comps best support the ARV.
Projected returns pro-forma
-3.0% appreciation · 0.0% rent growth · sell at horizon
- IRR
- -21.2%
- Equity multiple
- 0.29×
- Total profit
- $-42,413
- Equity at exit
- $31,610
- IRR
- -23.6%
- Equity multiple
- -0.02×
- Total profit
- $-60,682
- Equity at exit
- $18,330
Cash invested: $59,360 (down + closing). Projections, not guarantees.
Landlord ↔ Tenant lean methodology
- Overall (STATE)
- 90 Strongly Landlord-Friendly
- State South Carolina
- 90 Strongly Landlord-Friendly · R+6
- County
- — inherits STATE
- City
- — inherits STATE
ZIP-level market 29687
- Rents YoY
- -0.5%
- Active inventory
- 299
- Price-to-rent
- 9.9×
Monthly cashflow live
- Estimated rent
- $1,777 high interval (Pro) →
- Mortgage (P&I)
- −$1,112
- Tax from tax record
- −$148 /mo · $1,782/yr
- Insurance
- −$88
- HOA
- −$100
- Vacancy / Maint / Mgmt
- −$373
- Net cashflow
- $-45
Break-even live
UW: 25.0% down · 7.5% · 30yr · 1.5% tax · 5.0% vac · 8.0% maint · 8.0% mgmt
Financing live
Cash to close
- Down payment
- $53,000
- Closing costs
- $6,360
- Reserves months
- —
- Total cash needed
- —
Loan-product check · same deal, 3 products live
Conventional
25% down · 7.5% · 30yr
- Down + closing
- —
- Monthly P&I
- —
- Monthly cashflow
- —
- DSCR
- —
- Eligible?
- —
Personal DTI + credit; lowest rate.
DSCR
20% down · 8.5% · 30yr
- Down + closing
- —
- Monthly P&I
- —
- Monthly cashflow
- —
- DSCR
- —
- Eligible?
- —
No personal income docs; deal must DSCR.
Hard money
10% down · 12.0% · 12mo
- Down + closing
- —
- Monthly P&I
- —
- Monthly cashflow
- —
- DSCR
- —
- Eligible?
- —
Short-term bridge; refi at stabilization.
Rent comps 9 comps
| Address | Beds | Baths | Sqft | Rent | $/sqft | DOM | Units | Dist |
|---|---|---|---|---|---|---|---|---|
| 400 Fairhaven Dr Taylors, SC | 3.0 | 2.0 | 1738 | $1,875 | $1.08 | 23d | 1 | 0.35mi |
| 102 Tiffany Dr Taylors, SC | 3.0 | 2.0 | 1392 | $1,735 | $1.25 | 23d | 1 | 0.42mi |
| 104 Bluet Ln Taylors, SC | 3.0 | 3.0 | 1565 | $1,895 | $1.21 | 23d | 1 | 0.55mi |
| 7 Pembroke Ln Taylors, SC | 3.0 | 2.0 | 1094 | $1,650 | $1.51 | 23d | 1 | 0.76mi |
| 7 Stonington Way Taylors, SC | 3.0 | 2.0 | 1650 | $1,845 | $1.12 | 23d | 1 | 0.92mi |
| 9 Forestdale Dr Taylors, SC | 3.0 | 2.0 | 1250 | $1,795 | $1.44 | 11d | 1 | 1.04mi |
| 30 Broad Vista Blvd Taylors, SC | 3.0 | 2.0 | 1500 | $1,895 | $1.26 | 3d | 1 | 1.20mi |
| 124 Creekland Way Taylors, SC | 3.0 | 2.5 | 1579 | $1,695 | $1.07 | 3d | 1 | 1.44mi |
| 5 Robin Hood Rd Unit A Taylors, SC | 2.0 | 2.5 | 1280 | $1,550 | $1.21 | 23d | 1 | 1.49mi |
HOA detail
- Monthly dues
- $100 · $1,200/yr
Listing history 50 events
-
2026-06-18days on market $212,000 Active 77 DOM
-
2026-06-17days on market $212,000 Active 76 DOM
-
2026-06-16days on market $212,000 Active 75 DOM
-
2026-06-15days on market $212,000 Active 74 DOM
-
2026-06-13days on market $212,000 Active 72 DOM
-
2026-06-13days on market $212,000 Active 71 DOM
-
2026-06-10days on market $212,000 Active 69 DOM
-
2026-06-09days on market $212,000 Active 68 DOM
-
2026-06-08days on market $212,000 Active 67 DOM
-
2026-06-07days on market $212,000 Active 66 DOM
-
2026-06-03days on market $212,000 Active 62 DOM
-
2026-06-03days on market $212,000 Active 61 DOM
-
2026-06-01days on market $212,000 Active 60 DOM
-
2026-05-31days on market $212,000 Active 59 DOM
-
2026-04-02$212,000 Active
-
2025-11-07historical
-
2025-10-16historical
-
2025-07-14$225,000 Active
-
2025-07-14$225,000 Active
-
2025-07-14$225,000 Active
-
2025-06-21historical
-
2025-05-29price $239,000
-
2025-03-21$242,900 Active
-
2025-02-22price $242,900
-
2025-02-05price $244,900
-
2024-12-11$245,900 Active
-
2024-12-11historical
-
2024-10-21$245,900 Active
-
2024-10-16historical
-
2024-08-29price $236,000
-
2024-08-19price $238,000
-
2024-07-15price $240,000
-
2024-07-04price $242,000
-
2024-06-26price $245,000
-
2024-06-12price $249,900
-
2024-05-18$250,000 Active
-
2022-10-28soldstatus $206,700 Sold
-
2022-09-30historical Contingency Contract
-
2022-09-24$209,000 Active
-
2020-07-01soldstatus $157,000
-
2020-06-30soldstatus $157,000 Sold
-
2020-05-09status Pending
-
2020-04-23status Active
-
2020-04-06historical Contingency Contract
-
2020-02-26$159,900 Active
-
2013-09-03soldstatus $100,000
-
2013-08-05historical
-
2010-08-04$104,500
-
2009-06-29historical
-
2009-03-12$125,000
ⓘ Source: listings_history table (triggers on properties + properties_extension) + one-shot
backfill from property_details.listing_events for pre-trigger history.
Tax reassessment forecast SC · Resets to sale price
- Current annual tax
- $1,782 · $148/mo
- Projected year-2 tax
- $1,782 · $148/mo
- Expected delta
- $0/yr ($0/mo · 0.0%)
ⓘ Screening estimate from a state-policy table — verify with the county assessor before closing.
Climate risk First Street
- Flood 1/10 Low FEMA zone X (unshaded) · 0% chance over 30 yrs
- Wildfire 1/10 Low
- Heat 6/10 Major 7 d/yr ≥103°F today · 17 d/yr by 30 yrs out
- Wind 2/10 Low 100% chance of damaging wind over 30 yrs
- Air quality 4/10 Moderate 4 unhealthy d/yr today · 5 by 30 yrs out
Nearby sold comps map
Loading sold comps map…
Walkable amenities ~0.75 mi
Loading nearby amenities…
Taxation est. · year 1
- Rental income
- $21,319
- − Mortgage interest
- −$11,875
- − Property taxes
- −$1,782
- − Insurance
- −$1,060
- − Repairs & maintenance
- −$1,706
- − Management
- −$1,706
- − HOA
- −$1,200
- − Depreciation
- −$6,167
- Taxable loss
- −$4,176
- Est. tax savings @ 24.0%
- +$1,002
- After-tax cash flow
- $462/yr
For passive investors: Depreciation is non-cash, so a rental often shows a tax loss while cash-flowing — sheltering income. Rental losses are passive: they offset passive income freely, and up to $25,000/yr can offset ordinary (W-2) income if you actively participate and your MAGI is under $100k (phasing out to $0 by $150k); unused losses carry forward. On sale, claimed depreciation is recaptured at up to 25%, and gains may owe capital-gains tax (a 1031 exchange can defer both). Figures are a year-1 estimate at your 24.0% rate — not tax advice; consult a CPA.
Schools (NCES district)
- District
- Greenville 01
- NCES district ID
- 4502310
- Math proficiency
- 44% ▼ -10.00%
- Reading proficiency
- 54% ▼ -2.00%
- Median HH income
- $49,596
- Composite
- 41.88/100
- National rank
- #3370
- State rank
- #10 of 80 in SC
Livability — Wade Hampton
- Score
- 75/100
- State rank
- #26
- US rank
- #3981
Category grades
Schools grade is shown separately in the Schools card above.
Census & demographics
- Census place
- Wade Hampton, SC
- County
- Greenville County · 573,815 people
- Metro
- Greenville-Anderson, SC
- Population (ZIP)
- 44,861
- Household income
- $80,051
- Rent vs Own
- Severe rent burden
- 897.0
Population outlook (Greenville County) Hauer SSP2
- Today (2025)
- 574,580 people
- By 2030
- 615,615 · +7.1%
- By 2040
- 695,373 · +21.0%
- By 2050
- 769,367 · +33.9%
- By 2075
- 933,296 · +62.4%
- By 2100
- 1,029,196 · +79.1%
Race, ethnicity, and origin ACS 2023
- Neighborhood character
- Predominantly White (72%)
- Race & ethnicity
- White 72% Black 12% Hispanic / Latino 11% Two or more races 6% Asian 3%
- Hispanic origin (detail)
- Mexican 5% Puerto Rican 1%
- Common ancestry
- Serbian 3% Slovak 3% Lithuanian 1%
- Foreign-born
- 9% · Canada, Vietnam, Jamaica
- Languages at home
- 87% English-only · Spanish 9% Vietnamese 1% German/W. Germanic 1%
Political lean MEDSL · Greenville
- 2024 margin
- Strong R (+22.2) · D 38.0% · R 60.2% · Other 1.8%
- 2008→2024 swing
- +1.7pp toward D · 2008: -23.9pp · 2024: -22.2pp
- All cycles
- 2024: R+22.2 2020: R+18.2 2016: R+24.7 2012: R+27.8 2008: R+23.9
Not yet ingested
- Civics
- —
Market trends
- HPI YoY
- ▼ -189.27%
- Current HPI
- 252.7649
- Rent YoY
- ▼ -0.51%
- Metro
- Greenville-Anderson, SC
- State GDP YoY
- ▲ 4.51%
- F500 in state
- 2
Industry mix (Fortune 500 HQ in SC)
| Industry | F500 HQs | Revenue |
|---|---|---|
| Packaging | 1 | $7B |
|
||
Price history
+69.6% since first listed36 events — show timeline
- 2026-04-02 Listed $212,000 Greater Greenville MLS
- 2025-11-07 Listing Removed — WUMLS
- 2025-10-16 Listing Removed — Greater Greenville MLS
- 2025-07-14 Listed $225,000 SPMLS
- 2025-07-14 Listed $225,000 Greater Greenville MLS
- 2025-07-14 Listed $225,000 WUMLS
- 2025-06-21 Listing Removed — Greater Greenville MLS
- 2025-05-29 Price Changed $239,000 SPMLS
- 2025-03-21 Listed $242,900 Greater Greenville MLS
- 2025-02-22 Price Changed $242,900 SPMLS
- 2025-02-05 Price Changed $244,900 SPMLS
- 2024-12-11 Listed $245,900 SPMLS
- 2024-12-11 Delisted — SPMLS
- 2024-10-21 Listed $245,900 SPMLS
- 2024-10-16 Listing Removed — Greater Greenville MLS
- 2024-08-29 Price Changed $236,000 Greater Greenville MLS
- 2024-08-19 Price Changed $238,000 Greater Greenville MLS
- 2024-07-15 Price Changed $240,000 Greater Greenville MLS
- 2024-07-04 Price Changed $242,000 Greater Greenville MLS
- 2024-06-26 Price Changed $245,000 Greater Greenville MLS
- 2024-06-12 Price Changed $249,900 Greater Greenville MLS
- 2024-05-18 Listed $250,000 Greater Greenville MLS
- 2022-10-28 Sold (MLS) $206,700 Greater Greenville MLS
- 2022-09-30 Contingent — Greater Greenville MLS
- 2022-09-24 Listed $209,000 Greater Greenville MLS
- 2020-07-01 Sold (Public Records) $157,000 Public Records
- 2020-06-30 Sold (MLS) $157,000 Greater Greenville MLS
- 2020-05-09 Pending — Greater Greenville MLS
- 2020-04-23 Relisted — Greater Greenville MLS
- 2020-04-06 Contingent — Greater Greenville MLS
- 2020-02-26 Listed $159,900 Greater Greenville MLS
- 2013-09-03 Sold (MLS) $100,000 Greater Greenville MLS
- 2013-08-05 Listing Removed — Greater Greenville MLS
- 2010-08-04 Listed $104,500 Greater Greenville MLS
- 2009-06-29 Listing Removed — Greater Greenville MLS
- 2009-03-12 Listed $125,000 Greater Greenville MLS
Property tax history
+10.1%/yrLatest (2025): $1,782 · +4.8% YoY. Source: county tax records.
Cash-flow waterfall
monthlySold comps — $/sqft
last 12 mo · ≤1 miLoading sold comps…