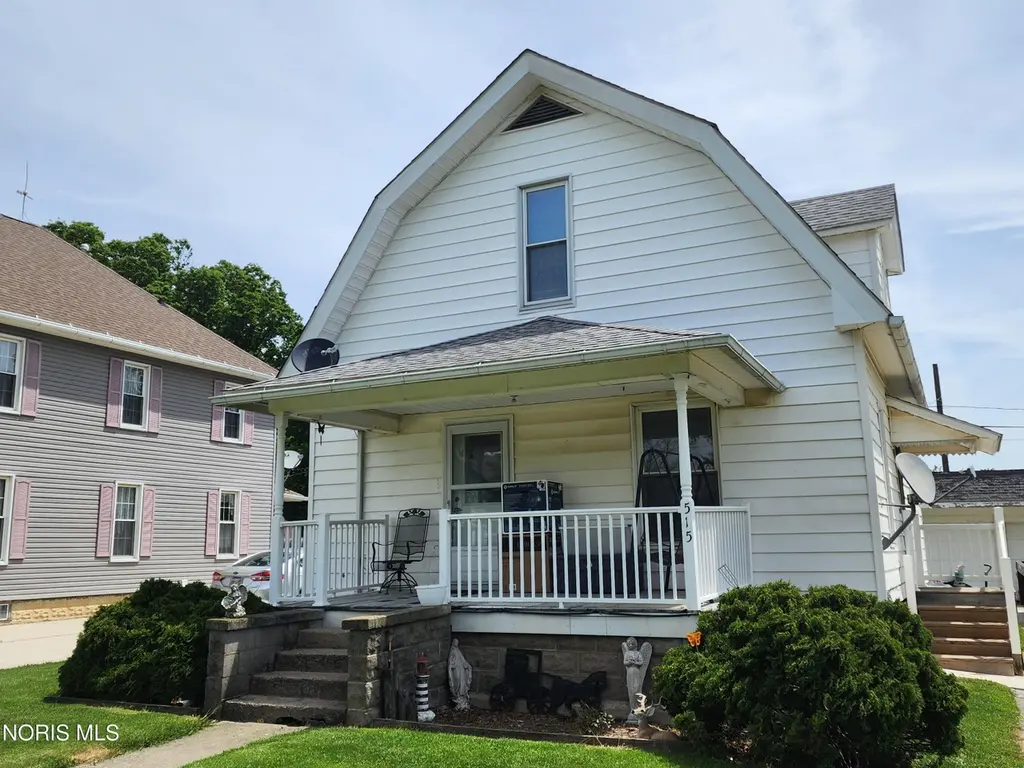
515 S East St · McClure, OH
Flood risk 1/10 · Minimal
- FEMA flood zone
- —
- Chance of flooding over 30 yrs
- 0.0%
- Est. flood insurance / yr
- —
Fire risk 1/10 · Minimal
- Est. fire insurance / yr
- $713 – $1,323
Heat risk 3/10 · Minor
- Hot days now (above 99°F)
- 7 days/yr
- Hot days in 30 yrs
- 17 days/yr
Wind risk 2/10 · Minimal
- Chance of severe wind over 30 yrs
- —
Air-quality risk 2/10 · Minimal
- Unhealthy air days now
- 1 days/yr
- Unhealthy air days in 30 yrs
- 2 days/yr
Risk factors via First Street. Map © Google.
Why this score? — see what drove the C+ grade
The composite is a weighted blend of 9 inputs, each scored 0–100. Each bar is that input's sub-score; the figure is the points it added to the 100-point composite (weight × sub-score).
- Cash flow +15.5/30.0
- ARV discount +13.2/15.0
- Appreciation +10.0/10.0
- Schools +5.6/10.0
- DSCR +4.8/10.0
- 1% rule +3.5/10.0
- Livability +3.0/5.0
- Rent growth +2.5/5.0
- Condition / age +2.5/5.0
$125,000
🖨 Deal sheet 📄 Offer letter ✓ Due diligence
Listing remarks MLS
Ready To Move Into * Natural Woodwork * Hardwood Floors * Modeern Kitchen * Ceiling Fans * Extra Large Back Yard * Rear Deck & Front Porch * Easy To Show, Need 24 Hr Notice
Key facts
- 0.49 acre lot
- Garage
- Built 1900
Property features AI
Exterior
- Parking: Detached garage (1 car); Carport (2 car); Gravel parking areas
- Utilities: Cable available; Electricity connected; Natural gas connected; Public water; Public sewer (including storm and sanitary)
- Home design: Single-family residence; One and one-half levels (2 stories total); Not attached to other units; No common walls
- Construction: Vinyl siding; Block foundation; Asphalt shingle roof
- Exterior features: Front porch; Shed(s); Level lot
Interior
- Kitchen: Eat-in kitchen
- Bedrooms: Bedroom on main level (approx. 11 x 11); Bedroom on upper level (approx. 14 x 10); Bedroom on upper level (approx. 14 x 14)
- Flooring: Carpet; Vinyl; Wood
- Bathrooms: 1 full bathroom; 1 half bathroom
- Heating & cooling: Baseboard heating; Boiler
- Interior features: Eat-in kitchen; Ceiling fan(s); Basement
- Laundry & utility: Main-level laundry inside the home
Neighborhood map
What this means for you Summary
Snapshot
- This is a 3-bed/1.0-bath single-family listed at $125k.
Deal economics
- At list price, monthly cash flow is $50 ($606/yr) — positive.
- The deal already cash-flows at list — no discount required.
- To meet the 1% rule (rent ≥ 1% of price), the offer needs to be $107k (14.8% below list).
- Recommended offer: $107k (14.8% below list) — sets the bar for 1% rule.
Location & tenants
- Location reads 59/100 on livability (#1,004 in OH) — a working-class tenant base; expect higher turnover. Strengths: cost of living A+, housing A+; Watch: crime D+, amenities F, commute F.
- Napoleon Area City (town): math 62% / reading 69% proficiency, ranked #208 of 656 in OH (top 32%) — acceptable for families but not a draw, mixed tenant base, ~2y average lease.
- Zoned schools: Napoleon Elementary School (math 75% / reading 74%, grade A, #272 of 1,584 statewide, top 19%, 975 students, 37% FRL); Napoleon Junior/Senior High School (math 49% / reading 64%, grade C, #291 of 781 statewide, top 37%, 787 students, 30% FRL).
- Market conditions: 7 active listings in the ZIP; solid renter incomes; 18 units permitted in Henry County in 2024 (0 in 5+ unit buildings).
- This rent is only 15% of the median local income ($83k/yr) — well below the 30% rent-burden line; pricing power to push rent on renewal without tenant pushback.
Forward outlook
- In year one you build about $13k of equity ($864 loan paydown + $12k appreciation (10.0% local appreciation)).
- Henry County population projected at -14% by 2050 — secular population decline; favor cash flow + early exit over multi-decade hold.
- At projected returns (10.0% appreciation + 3.0% rent growth), your $35k cash investment doubles in ~3 years — after that, you're playing with house money.
- By year 3, paydown + projected appreciation supports a ~$34k cash-out refi (75% LTV) — recoverable capital for the next deal without selling this one.
Negotiation context
- Only 6 days on market — expect competitive offers; lowballing is unlikely to land.
- 4 sale attempts since 26y ago; this cycle's ask is 41% above the opening price — seller raised mid-cycle; expect resistance to lowballs.
- Current owner paid $77k; list at $125k implies a 62% gain — meaningful room to come down on a strong offer.
Risks & watch-outs
- Watch-outs: built in 1900 — expect roof / HVAC / electrical / plumbing capex.
Questions for the listing agent
- Built in 1900 — when were the roof, HVAC, electrical panel, plumbing, and water heater last replaced?
- Is there a deadline driving the sale (1031 exchange, divorce, estate, relocation)? That informs how much negotiation room exists.
- Schools are F-rated, which usually means shorter tenancies and higher turnover. Who's the typical renter profile here, and what's been the actual vacancy rate?
- Crime grade is D in this area — have there been break-ins, vandalism, or insurance claims at this property in the last 3 years? What carrier currently insures it and at what premium?
- What's the average days-on-market for RENTAL listings here right now (not sales)? A rising rental-DOM trend means longer vacancies and softer asking-rent achievability than the comps imply.
- What's the recent tenant-quality profile in this submarket — average credit score on applications, eviction rate, late-payment / NSF rate, and stable-employment percentage? A property-management company in the area should have these aggregated.
- How much new for-sale + rental construction is in the pipeline within 1–3 miles? Heavy new supply typically softens prices + rents 12–24 months out; constrained supply supports both.
Investment metrics
- 1% rule
- 0.85% ✗
- Cap rate
- 6.78%
- Cash-on-cash
- 1.73%
- DSCR
- 1.08
- GRM
- 9.8
CMA / ARV
- ARV (on-the-fly)
- $143,000
- Comps found
- 7
Show comp detail 7 sales within ~0.75 mi
| Address | Dist | Beds/Ba | Sqft | Sold | Price | $/sf | Match |
|---|---|---|---|---|---|---|---|
| 206 Henry St | 0.13mi | 3/1.0 | 1,235 (+8%) | 16mo | $130,000 | $105 | 67 |
| 255 W Summit St | 0.19mi | 2/1.0 (-1) | 1,062 (-7%) | 9mo | $134,900 | $127 | 67 |
| 520 W North St | 0.40mi | 3/1.0 | 1,056 (-8%) | 3mo | $125,000 | $118 | 66 |
| 325 E North St | 0.30mi | 3/1.0 | 1,276 (+12%) | 6mo | $93,000 | $73 | 62 |
| 210 Union St | 0.33mi | 2/1.0 (-1) | 1,020 (-11%) | 1mo | $137,500 | $135 | 61 |
| 639 W North St | 0.50mi | 2/1.5 (-1) | 1,242 (+9%) | 7mo | $166,000 | $134 | 49 |
| 3677 US Highway 6 | 0.39mi | 2/2.0 (-1) | 1,000 (-13%) | 16mo | $125,000 | $125 | 38 |
Match score weights: distance 35% · size 25% · config 20% · recency 20%. Top-matched comps best support the ARV.
Projected returns pro-forma
10.0% appreciation · 3.0% rent growth · sell at horizon
- IRR
- 25.5%
- Equity multiple
- 3.04×
- Total profit
- $71,266
- Equity at exit
- $112,610
- IRR
- 22.4%
- Equity multiple
- 6.92×
- Total profit
- $207,279
- Equity at exit
- $242,848
Cash invested: $35,000 (down + closing). Projections, not guarantees.
Landlord ↔ Tenant lean methodology
- Overall (STATE)
- 73 Landlord-Friendly
- State Ohio
- 73 Landlord-Friendly · R+6
- County
- — inherits STATE
- City
- — inherits STATE
ZIP-level market 43534
- Home prices YoY
- 4.6%
- Active inventory
- 7
- Price-to-rent
- 9.8×
Monthly cashflow live
- Estimated rent
- $1,065 medium interval (Pro) →
- Mortgage (P&I)
- −$656
- Tax from tax record
- −$83 /mo · $1,001/yr
- Insurance
- −$52
- HOA
- −$0
- Vacancy / Maint / Mgmt
- −$224
- Net cashflow
- $50
Break-even live
UW: 25.0% down · 7.5% · 30yr · 1.5% tax · 5.0% vac · 8.0% maint · 8.0% mgmt
Financing live
Cash to close
- Down payment
- $31,250
- Closing costs
- $3,750
- Reserves months
- —
- Total cash needed
- —
Loan-product check · same deal, 3 products live
Conventional
25% down · 7.5% · 30yr
- Down + closing
- —
- Monthly P&I
- —
- Monthly cashflow
- —
- DSCR
- —
- Eligible?
- —
Personal DTI + credit; lowest rate.
DSCR
20% down · 8.5% · 30yr
- Down + closing
- —
- Monthly P&I
- —
- Monthly cashflow
- —
- DSCR
- —
- Eligible?
- —
No personal income docs; deal must DSCR.
Hard money
10% down · 12.0% · 12mo
- Down + closing
- —
- Monthly P&I
- —
- Monthly cashflow
- —
- DSCR
- —
- Eligible?
- —
Short-term bridge; refi at stabilization.
Listing history 10 events
-
2026-06-18days on market $125,000 Active 6 DOM
-
2026-06-17days on market $125,000 Active 5 DOM
-
2026-06-16days on market $125,000 Active 4 DOM
-
2026-06-15days on market $125,000 Active 3 DOM
-
2026-06-12statusdays on market $125,000 Active 1 DOM
-
2026-06-09days on market $125,000 Coming Soon 5 DOM
-
2026-06-08days on market $125,000 Coming Soon 4 DOM
-
2026-06-08days on market $125,000 Coming Soon 3 DOM
-
2026-06-07remarks 188-char remark
-
2026-06-07$125,000 Coming Soon 2 DOM
ⓘ Source: listings_history table (triggers on properties + properties_extension) + one-shot
backfill from property_details.listing_events for pre-trigger history.
Tax reassessment forecast OH · Partial reset (capped growth)
- Current annual tax
- $1,001 · $83/mo
- Projected year-2 tax
- $1,476 · $123/mo
- Expected delta
- +$474/yr (+$40/mo · 47.4%)
ⓘ Screening estimate from a state-policy table — verify with the county assessor before closing.
Climate risk First Street
- Flood 1/10 Low 0% chance over 30 yrs
- Wildfire 1/10 Low
- Heat 3/10 Moderate 7 d/yr ≥99°F today · 17 d/yr by 30 yrs out
- Wind 2/10 Low
- Air quality 2/10 Low 1 unhealthy d/yr today · 2 by 30 yrs out
Nearby sold comps map
Loading sold comps map…
Walkable amenities ~0.75 mi
Loading nearby amenities…
Taxation est. · year 1
- Rental income
- $12,783
- − Mortgage interest
- −$7,002
- − Property taxes
- −$1,001
- − Insurance
- −$625
- − Repairs & maintenance
- −$1,023
- − Management
- −$1,023
- − Depreciation
- −$3,636
- Taxable loss
- −$1,527
- Est. tax savings @ 24.0%
- +$367
- After-tax cash flow
- $972/yr
For passive investors: Depreciation is non-cash, so a rental often shows a tax loss while cash-flowing — sheltering income. Rental losses are passive: they offset passive income freely, and up to $25,000/yr can offset ordinary (W-2) income if you actively participate and your MAGI is under $100k (phasing out to $0 by $150k); unused losses carry forward. On sale, claimed depreciation is recaptured at up to 25%, and gains may owe capital-gains tax (a 1031 exchange can defer both). Figures are a year-1 estimate at your 24.0% rate — not tax advice; consult a CPA.
Schools (NCES district)
- District
- Napoleon Area City
- NCES district ID
- 3904443
- Math proficiency
- 62% ▼ -14.00%
- Reading proficiency
- 69% ▼ -4.00%
- Median HH income
- $49,144
- Composite
- 55.53/100
- National rank
- #1243
- State rank
- #208 of 656 in OH
Livability — McClure
- Score
- 59/100
- State rank
- #1004
- US rank
- #19674
Category grades
Schools grade is shown separately in the Schools card above.
Census & demographics
- Census place
- McClure, OH
- County
- Henry · 27,211 people
- Population (ZIP)
- 1,501
- Household income
- $83,191
- Rent vs Own
- Severe rent burden
- 2.5
Population outlook (Henry County) Hauer SSP2
- Today (2025)
- 27,204 people
- By 2030
- 26,657 · -2.0%
- By 2040
- 25,149 · -7.6%
- By 2050
- 23,361 · -14.1%
- By 2075
- 20,409 · -25.0%
- By 2100
- 18,199 · -33.1%
Race, ethnicity, and origin ACS 2023
- Neighborhood character
- Predominantly White (85%)
- Race & ethnicity
- White 85% Hispanic / Latino 9% Two or more races 9% Asian 2%
- Hispanic origin (detail)
- Mexican 5% Puerto Rican 3%
- Common ancestry
- Lithuanian 6% Romanian 2% Slovak 2%
- Foreign-born
- 2%
- Languages at home
- 97% English-only · Spanish 3%
Political lean MEDSL · Henry
- 2024 margin
- Solid R (+46.7) · D 26.2% · R 72.9%
- 2008→2024 swing
- -33.8pp toward R · 2008: -12.9pp · 2024: -46.7pp
- All cycles
- 2024: R+46.7 2020: R+43.5 2016: R+39.8 2012: R+18.6 2008: R+12.9
Not yet ingested
- Civics
- —
Market trends
- HPI YoY
- ▲ 10.08%
- Current HPI
- 227.694
- Rent YoY
- —
- Metro
- —
- State GDP YoY
- ▲ 1.98%
- F500 in state
- 48
Industry mix (Fortune 500 HQ in OH)
| Industry | F500 HQs | Revenue |
|---|---|---|
| Insurance | 3 | $145B |
|
||
| Industrial Machinery | 3 | $49B |
|
||
| Financial Services | 3 | $24B |
|
||
| Consumer Goods | 2 | $93B |
|
||
| Aerospace / Defense | 2 | $47B |
|
||
| Utilities | 2 | $33B |
|
||
Price history
+331.0% since first listed15 events — show timeline
- 2026-06-04 Coming Soon $125,000 NORIS
- 2025-10-14 Price Changed $77,000 NORIS
- 2003-07-24 Sold (Public Records) $75,000 Public Records
- 2003-07-24 Sold (MLS) $77,000 NORIS
- 2003-02-14 Listed $88,900 NORIS
- 2002-12-06 Listing Removed — NORIS
- 2002-06-06 Listed $88,900 NORIS
- 2001-04-20 Sold (Public Records) $77,500 Public Records
- 2001-04-16 Sold (MLS) $77,500 NORIS
- 2001-03-08 Price Changed $77,500 NORIS
- 2001-03-05 Listed $74,900 NORIS
- 2001-03-04 Listing Removed — NORIS
- 2000-09-05 Listed $76,000 NORIS
- 1997-12-10 Sold (Public Records) $56,000 Public Records
- 1991-04-05 Sold (Public Records) $29,000 Public Records
Property tax history
-6.9%/yrLatest (2025): $1,001 · -5.5% YoY. Source: county tax records.
Cash-flow waterfall
monthlySold comps — $/sqft
last 12 mo · ≤1 miLoading sold comps…