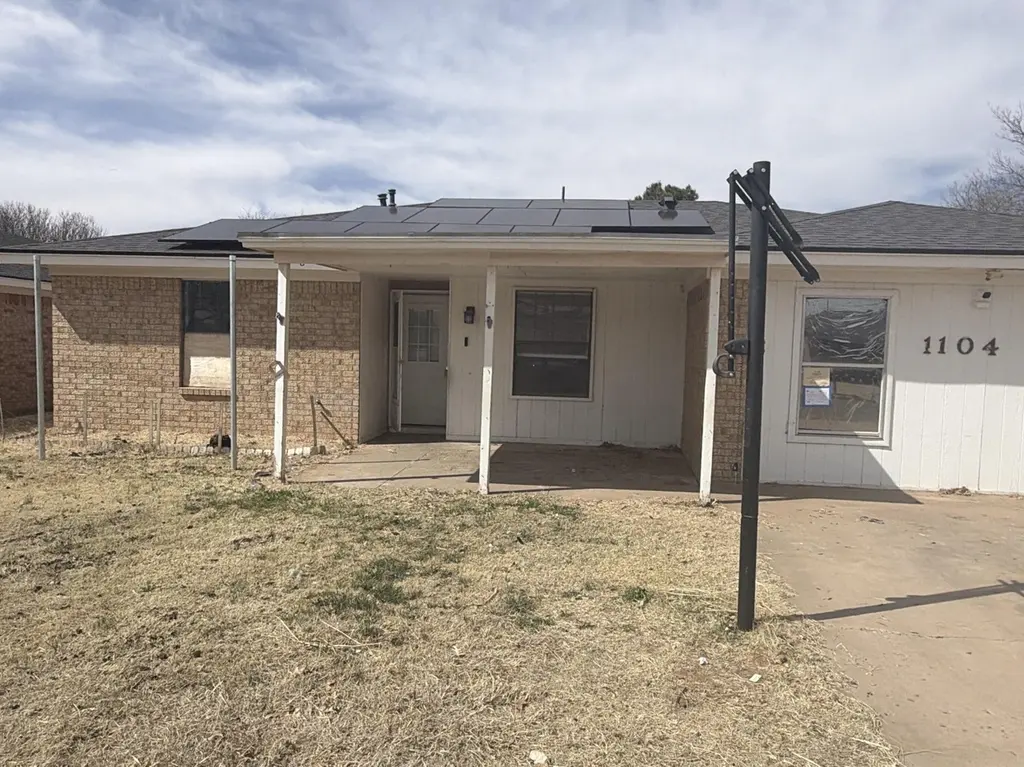
1104 Huron Ave · Lubbock, TX
Flood risk 1/10 · Minimal
- FEMA flood zone
- X (unshaded)
- Chance of flooding over 30 yrs
- 0.0%
- Est. flood insurance / yr
- $507 – $1,088
Fire risk 1/10 · Minimal
- Est. fire insurance / yr
- $1,222 – $2,270
Heat risk 5/10 · Moderate
- Hot days now (above 99°F)
- 7 days/yr
- Hot days in 30 yrs
- 21 days/yr
Wind risk 2/10 · Minimal
- Chance of severe wind over 30 yrs
- —
Air-quality risk 2/10 · Minimal
- Unhealthy air days now
- 1 days/yr
- Unhealthy air days in 30 yrs
- 1 days/yr
Risk factors via First Street. Map © Google.
Why this score? — see what drove the B grade
The composite is a weighted blend of 9 inputs, each scored 0–100. Each bar is that input's sub-score; the figure is the points it added to the 100-point composite (weight × sub-score).
- Cash flow +25.5/30.0
- ARV discount +15.0/15.0
- DSCR +8.5/10.0
- 1% rule +8.2/10.0
- Schools +4.4/10.0
- Livability +4.0/5.0
- Rent growth +3.1/5.0
- Condition / age +2.5/5.0
- Appreciation +0.0/10.0
$125,750
🖨 Deal sheet (PDF) 📄 Offer letter ✓ Due diligence
Listing remarks MLS
4bedoom, 3 bath home with large backyard and fireplace
Key facts
- 6,900 sq ft lot
- Built 1981
- Listed 52 days
Neighborhood map
What this means for you Summary
Snapshot
- This is a 4-bed/3.0-bath single-family listed at $126k.
Deal economics
- At list price, monthly cash flow is $294 ($4k/yr) — positive.
- The deal already cash-flows at list — no discount required.
- Meets the 1% rule at list price ($2k rent vs $126k).
- Recommended offer: $122k (3.0% below list) — sets the bar for market timing.
Location & tenants
- Location reads 80/100 on livability (#37 in TX, #1,749 nationally) — a professional / high-income tenant draw. Strengths: commute A+, cost of living A+, housing A+; Watch: employment C-, crime F.
- Frenship ISD (urban): math 47% / reading 54% proficiency, ranked #162 of 826 in TX (top 20%) — acceptable for families but not a draw, mixed tenant base, ~2y average lease.
- Zoned schools: North Ridge El (math 44% / reading 47%, grade D-, #1,112 of 4,322 statewide, top 26%, 738 students, 63% FRL); Terra Vista Middle (math 37% / reading 44%, grade F, #637 of 1,662 statewide, top 39%, 891 students, 66% FRL); Frenship H S (math 44% / reading 65%, grade C-, #379 of 1,632 statewide, top 26%, 3,247 students, 46% FRL) — zoned schools average 58% FRL vs 36% district-wide (22 pts higher); higher-poverty schools than district average — tighter screening recommended.
- Market conditions: Rents rising (+2.2%/yr); 464 active listings in the ZIP; 40 comparable units currently listed for rent nearby; rentals at typical pace (median 23d on market — plan ~3-4 weeks tenant-placement turnaround); 2,219 units permitted in Lubbock County in 2024 (252 in 5+ unit buildings).
- This rent runs 31% of the median local income ($64k/yr) — at the standard rent-burdened threshold; future hikes will face affordability resistance.
Forward outlook
- Local home prices are declining (-3.0%/yr); year-one equity from $870 of loan paydown is wiped out by about $4k of value loss. Plan a longer hold.
- Lubbock County population projected at +39% by 2050 — long-run rental-demand tailwind backs the buy-and-hold thesis.
Negotiation context
- It's been on market 52 days — a 3% lower offer ($122k) is reasonable based on typical stale-listing flexibility.
- 4 sale attempts since 13y ago; this cycle's ask has dropped $10k (7%) from the opening price — seller is motivated, your offer sets the floor, not the list.
Risks & watch-outs
- Watch-outs: property tax is 2.9% of price.
- Climate carrying-cost: extreme-heat days projected 7→21/yr by 2055 (HVAC capex compounding) — expect insurance premiums to compound above CPI over the hold.
Questions for the listing agent
- It's been on market 52 days. Have you received any prior offers? Is the seller open to a 3% concession, seller financing, or rate buy-down credit?
- Property tax is high relative to price — has the assessment been appealed recently, and will the sale trigger a re-assessment?
- Is there a deadline driving the sale (1031 exchange, divorce, estate, relocation)? That informs how much negotiation room exists.
- Schools are D-rated, which usually means shorter tenancies and higher turnover. Who's the typical renter profile here, and what's been the actual vacancy rate?
- Crime grade is F in this area — have there been break-ins, vandalism, or insurance claims at this property in the last 3 years? What carrier currently insures it and at what premium?
- What's the average days-on-market for RENTAL listings here right now (not sales)? A rising rental-DOM trend means longer vacancies and softer asking-rent achievability than the comps imply.
- What's the recent tenant-quality profile in this submarket — average credit score on applications, eviction rate, late-payment / NSF rate, and stable-employment percentage? A property-management company in the area should have these aggregated.
- How much new for-sale + rental construction is in the pipeline within 1–3 miles? Heavy new supply typically softens prices + rents 12–24 months out; constrained supply supports both.
Investment metrics
- 1% rule
- 1.32% ✓
- Cap rate
- 9.10%
- Cash-on-cash
- 10.01%
- DSCR
- 1.45
- GRM
- 6.3
CMA / ARV
- ARV (median comp)
- $179,311
- List price
- $125,750
- Delta
- -29.87%
- Verdict
- UNDERPRICED
- Comps
- 4 within 2.0 mi
Show comp detail 1 sale within ~0.75 mi
| Address | Dist | Beds/Ba | Sqft | Sold | Price | $/sf | Match |
|---|---|---|---|---|---|---|---|
| 6116 10th St | 0.23mi | 3/2.0 (-1) | 1,632 (-2%) | 14mo | $195,000 | $119 | 65 |
Match score weights: distance 35% · size 25% · config 20% · recency 20%. Top-matched comps best support the ARV.
Projected returns pro-forma
-3.0% appreciation · 2.21% rent growth · sell at horizon
- IRR
- -2.2%
- Equity multiple
- 0.92×
- Total profit
- $-2,859
- Equity at exit
- $18,750
- IRR
- 6.6%
- Equity multiple
- 1.48×
- Total profit
- $16,791
- Equity at exit
- $10,873
Cash invested: $35,210 (down + closing). Projections, not guarantees.
Landlord ↔ Tenant lean methodology
- Overall (STATE)
- 87 Strongly Landlord-Friendly
- State Texas
- 87 Strongly Landlord-Friendly · R+5
- County
- — inherits STATE
- City
- — inherits STATE
ZIP-level market 79416
- Home prices YoY
- -20.0%
- Rents YoY
- 2.2%
- Active inventory
- 464
- Price-to-rent
- 6.3×
Monthly cashflow live
- Estimated rent
- $1,655 high interval (Pro) →
- Mortgage (P&I)
- −$659
- Tax from tax record
- −$302 /mo · $3,626/yr
- Insurance
- −$52
- HOA
- −$0
- Vacancy / Maint / Mgmt
- −$348
- Net cashflow
- $294
Break-even live
Sensitivity live
| Price | -10% $365 | -5% $329 | +0% $294 | +5% $258 | +10% $223 |
|---|---|---|---|---|---|
| Rent | -10% $163 | -5% $228 | +0% $294 | +5% $359 | +10% $425 |
| Rate | -1.0pp $357 | -0.5pp $326 | base $294 | +0.5pp $261 | +1.0pp $228 |
UW: 25.0% down · 7.5% · 30yr · 1.5% tax · 5.0% vac · 8.0% maint · 8.0% mgmt
Financing live
Cash to close
- Down payment
- $31,438
- Closing costs
- $3,772
- Reserves months
- —
- Total cash needed
- —
Loan-product check · same deal, 3 products live
Conventional
25% down · 7.5% · 30yr
- Down + closing
- —
- Monthly P&I
- —
- Monthly cashflow
- —
- DSCR
- —
- Eligible?
- —
Personal DTI + credit; lowest rate.
DSCR
20% down · 8.5% · 30yr
- Down + closing
- —
- Monthly P&I
- —
- Monthly cashflow
- —
- DSCR
- —
- Eligible?
- —
No personal income docs; deal must DSCR.
Hard money
10% down · 12.0% · 12mo
- Down + closing
- —
- Monthly P&I
- —
- Monthly cashflow
- —
- DSCR
- —
- Eligible?
- —
Short-term bridge; refi at stabilization.
Rent comps 40 comps
| Address | Beds | Baths | Sqft | Rent | $/sqft | DOM | Units | Dist |
|---|---|---|---|---|---|---|---|---|
| 6111 10th Dr Lubbock, TX | 4.0 | 2.0 | 1917 | $1,649 | $0.86 | 22d | 1 | 0.25mi |
| 6106 17th St Lubbock, TX | 3.0 | 2.0 | 1589 | $1,400 | $0.88 | 45d | 1 | 0.30mi |
| 6101 7th St Lubbock, TX | 3.0 | 2.0 | 1239 | $1,375 | $1.11 | 15d | 1 | 0.31mi |
| 6112 7th Dr Lubbock, TX | 3.0 | 2.0 | 1224 | $1,350 | $1.10 | 45d | 1 | 0.39mi |
| 6112 7th Dr Lubbock, TX | 3.0 | 2.0 | 1224 | $1,375 | $1.12 | 22d | 1 | 0.39mi |
| 5839 7th St Unit D Lubbock, TX | 3.0 | 2.0 | 1159 | $1,050 | $0.91 | 45d | 1 | 0.41mi |
| 5863 6th St Lubbock, TX | 3.0 | 2.0 | 1116 | $1,325 | $1.19 | 22d | 1 | 0.42mi |
| 5846 7th St Lubbock, TX | 3.0 | 2.0 | 1159 | $1,145 | $0.99 | 22d | 1 | 0.42mi |
| 5833 7th St Lubbock, TX | 3.0 | 2.0 | 1159 | $1,125 | $0.97 | 22d | 1 | 0.43mi |
| 1106 Kline Ave Lubbock, TX | 3.0 | 2.0 | 1272 | $1,350 | $1.06 | 22d | 1 | 0.44mi |
| 5834 7th St Lubbock, TX | 3.0 | 2.0 | 1200 | $1,125 | $0.94 | 22d | 1 | 0.45mi |
| 6336 9th St Lubbock, TX | 3.0 | 2.0 | 1476 | $1,650 | $1.12 | 22d | 1 | 0.54mi |
| 310 Homestead Ave Unit 4 Lubbock, TX | 3.0 | 2.5 | 1783 | $1,795 | $1.01 | 15d | 1 | 0.57mi |
| 310 Homestead Ave Unit 12 Lubbock, TX | 3.0 | 2.5 | 1571 | $1,595 | $1.02 | 15d | 1 | 0.57mi |
| 310 Homestead Ave Unit 17 Lubbock, TX | 3.0 | 2.5 | 1571 | $1,595 | $1.02 | 46d | 1 | 0.57mi |
| 310 Homestead Ave Lubbock, TX | 3.0 | 3.0 | 1783 | $1,995 | $1.12 | 45d | 1 | 0.57mi |
| 403 Kirby Ave Lubbock, TX | 3.0 | 2.0 | 1800 | $695 | $0.39 | 45d | 1 | 0.59mi |
| 6505 8th St Lubbock, TX | 3.0 | 2.0 | 1633 | $1,600 | $0.98 | 15d | 1 | 0.66mi |
| 6504 7th St Lubbock, TX | 3.0 | 2.0 | 1500 | $1,495 | $1.00 | 46d | 1 | 0.68mi |
| 6513 8th St Lubbock, TX | 3.0 | 2.0 | 1720 | $1,750 | $1.02 | 45d | 1 | 0.69mi |
| 221 Grover Ave Lubbock, TX | 3.0 | 2.0 | 1184 | $1,295 | $1.09 | 15d | 1 | 0.71mi |
| 6521 8th St Lubbock, TX | 3.0 | 2.0 | 1865 | $1,795 | $0.96 | 45d | 1 | 0.72mi |
| 5603 15th St Lubbock, TX | 3.0 | 2.0 | 1564 | $2,000 | $1.28 | 15d | 1 | 0.78mi |
| 5540 18th St Lubbock, TX | 3.0 | 2.0 | 1249 | $1,350 | $1.08 | 22d | 1 | 0.78mi |
| 6040 24th St Unit 8 Lubbock, TX | 3.0 | 3.5 | 1699 | $1,600 | $0.94 | 45d | 1 | 0.79mi |
| 6040 24th St Unit 17 Lubbock, TX | 3.0 | 2.0 | 1700 | $1,729 | $1.02 | 22d | 1 | 0.80mi |
| 6040 24th St Unit 17 Lubbock, TX | 3.0 | 3.5 | 1700 | $1,729 | $1.02 | 45d | 1 | 0.80mi |
| 6040 24th St Unit 33 Lubbock, TX | 3.0 | 3.5 | 1795 | $1,600 | $0.89 | 22d | 1 | 0.80mi |
| 5522 13th St Unit A Lubbock, TX | 3.0 | 2.0 | 1200 | $1,250 | $1.04 | 15d | 1 | 0.80mi |
| 6040 24th St Apt 25 Lubbock, TX | 3.0 | 2.5 | 1795 | $1,700 | $0.95 | 22d | 1 | 0.83mi |
| 6040 24th St Lubbock, TX | 3.0 | 3.5 | 1795 | $1,650 | $0.92 | 45d | 1 | 0.83mi |
| 6040 24th St Unit 16 Lubbock, TX | 3.0 | 3.5 | 1600 | $1,699 | $1.06 | 15d | 1 | 0.83mi |
| 6040 24th St Apt 25 Lubbock, TX | 3.0 | 3.5 | 1795 | $1,700 | $0.95 | 45d | 1 | 0.83mi |
| 6040 24th St Lubbock, TX | 3.0 | 3.0 | 1795 | $1,799 | $1.00 | 22d | 1 | 0.83mi |
| 5518 16th Pl Lubbock, TX | 3.0 | 2.0 | 1637 | $1,700 | $1.04 | 15d | 1 | 0.84mi |
| 1003 Oshkosh Ave Lubbock, TX | 3.0 | 2.0 | 1835 | $2,000 | $1.09 | 15d | 1 | 0.84mi |
| 5503 10th St Lubbock, TX | 3.0 | 2.0 | 1311 | $1,500 | $1.14 | 22d | 1 | 0.90mi |
| 5519 18th St Lubbock, TX | 3.0 | 1.0 | 1258 | $1,200 | $0.95 | 22d | 1 | 0.90mi |
| 5519 18th St Lubbock, TX | 3.0 | 2.0 | 1258 | $1,200 | $0.95 | 45d | 1 | 0.90mi |
| 204 Genoa Ave Lubbock, TX | 3.0 | 2.0 | 1400 | $1,400 | $1.00 | 15d | 1 | 0.91mi |
Listing history 16 events
-
2026-06-05statusdays on market $125,750 Pending 52 DOM
-
2026-06-03days on market $125,750 Active 51 DOM
-
2026-06-02days on market $125,750 Active 50 DOM
-
2026-06-01days on market $125,750 Active 49 DOM
-
2026-05-31days on market $125,750 Active 48 DOM
-
2026-05-30days on market $125,750 Active 47 DOM
-
2026-04-13$135,750 Active 54-char remark
Show marketing remark (54 chars)
4bedoom, 3 bath home with large backyard and fireplace
-
2021-11-15soldstatus 700-char remark
Show marketing remark (700 chars)
4 bedrooms and 3 bathrooms! This is a good one! This spacious home has a lot to offer! Exterior was just painted and new roof is on the way. Located in Frenship ISD and convenient to Texas Tech, LCU and the Medical District. Large living room with brick fireplace. Some of the interior has fresh paint. There are 2 double carports in the back - enough covered space to park 4 vehicles, plus driveway parking in the front. Works great for a large family or roommates, or has enough space for your work-at-home office! Covered patio and storage shed in back yard. With 2 water heaters, those long, hot showers are never a problem! Washer/Dryer/Refrigerator can stay. Make your viewing appointment soon!
-
2021-11-15soldstatus
Show marketing remark (700 chars)
4 bedrooms and 3 bathrooms! This is a good one! This spacious home has a lot to offer! Exterior was just painted and new roof is on the way. Located in Frenship ISD and convenient to Texas Tech, LCU and the Medical District. Large living room with brick fireplace. Some of the interior has fresh paint. There are 2 double carports in the back - enough covered space to park 4 vehicles, plus driveway parking in the front. Works great for a large family or roommates, or has enough space for your work-at-home office! Covered patio and storage shed in back yard. With 2 water heaters, those long, hot showers are never a problem! Washer/Dryer/Refrigerator can stay. Make your viewing appointment soon!
-
2021-10-06$157,500 700-char remark
Show marketing remark (700 chars)
4 bedrooms and 3 bathrooms! This is a good one! This spacious home has a lot to offer! Exterior was just painted and new roof is on the way. Located in Frenship ISD and convenient to Texas Tech, LCU and the Medical District. Large living room with brick fireplace. Some of the interior has fresh paint. There are 2 double carports in the back - enough covered space to park 4 vehicles, plus driveway parking in the front. Works great for a large family or roommates, or has enough space for your work-at-home office! Covered patio and storage shed in back yard. With 2 water heaters, those long, hot showers are never a problem! Washer/Dryer/Refrigerator can stay. Make your viewing appointment soon!
-
2021-07-02$155,000
-
2014-07-24soldstatus
-
2014-07-23soldstatus
-
2013-08-05$99,900
-
2008-06-06soldstatus
-
2004-11-01soldstatus
ⓘ Source: listings_history table (triggers on properties + properties_extension) + one-shot
backfill from property_details.listing_events for pre-trigger history.
Tax reassessment forecast TX · Resets to sale price
- Current annual tax
- $3,626 · $302/mo
- Projected year-2 tax
- $3,626 · $302/mo
- Expected delta
- $0/yr ($0/mo · 0.0%)
ⓘ Screening estimate from a state-policy table — verify with the county assessor before closing.
Climate risk First Street
- Flood 1/10 Low FEMA zone X (unshaded) · 0% chance over 30 yrs
- Wildfire 1/10 Low
- Heat 5/10 Major 7 d/yr ≥99°F today · 21 d/yr by 30 yrs out
- Wind 2/10 Low
- Air quality 2/10 Low 1 unhealthy d/yr today · 1 by 30 yrs out
Nearby sold comps map
Loading sold comps map…
Walkable amenities ~0.75 mi
Loading nearby amenities…
Taxation est. · year 1
- Rental income
- $19,864
- − Mortgage interest
- −$7,044
- − Property taxes
- −$3,626
- − Insurance
- −$629
- − Repairs & maintenance
- −$1,589
- − Management
- −$1,589
- − Depreciation
- −$3,658
- Taxable income
- $1,729
- Est. tax owed @ 24.0%
- −$415
- After-tax cash flow
- $3,110/yr
For passive investors: Depreciation is non-cash, so a rental often shows a tax loss while cash-flowing — sheltering income. Rental losses are passive: they offset passive income freely, and up to $25,000/yr can offset ordinary (W-2) income if you actively participate and your MAGI is under $100k (phasing out to $0 by $150k); unused losses carry forward. On sale, claimed depreciation is recaptured at up to 25%, and gains may owe capital-gains tax (a 1031 exchange can defer both). Figures are a year-1 estimate at your 24.0% rate — not tax advice; consult a CPA.
Schools (NCES district)
- District
- Frenship ISD
- NCES district ID
- 4819830
- Math proficiency
- 47% ▼ -8.00%
- Reading proficiency
- 54% ▬ 0.00%
- Median HH income
- $54,376
- Composite
- 43.59/100
- National rank
- #2976
- State rank
- #162 of 826 in TX
Livability — Lubbock
- Score
- 80/100
- State rank
- #37
- US rank
- #1749
Category grades
Schools grade is shown separately in the Schools card above.
Census & demographics
- Census place
- Lubbock, TX
- County
- Lubbock County · 293,542 people
- City population
- 283,030
- Metro
- Lubbock, TX
- Population (ZIP)
- 36,442
- Household income
- $63,896
- Rent vs Own
- Severe rent burden
- 2214.0
Population outlook (Lubbock County) Hauer SSP2
- Today (2025)
- 345,960 people
- By 2030
- 371,449 · +7.4%
- By 2040
- 424,539 · +22.7%
- By 2050
- 481,150 · +39.1%
- By 2075
- 633,467 · +83.1%
- By 2100
- 746,853 · +115.9%
Race, ethnicity, and origin ACS 2023
- Neighborhood character
- Diverse neighborhood (Simpson 0.62)
- Race & ethnicity
- White 49% Hispanic / Latino 35% Two or more races 14% Black 9% Asian 3%
- Hispanic origin (detail)
- Mexican 28%
- Common ancestry
- Slovak 3% Italian 1% Serbian 1%
- Foreign-born
- 7% · Canada, China, South Korea
- Languages at home
- 81% English-only · Spanish 13% Chinese 1% Tagalog/Filipino 1%
Political lean MEDSL · Lubbock
- 2024 margin
- Solid R (+39.5) · D 29.7% · R 69.2% · Other 1.0%
- 2008→2024 swing
- -2.8pp toward R · 2008: -36.7pp · 2024: -39.5pp
- All cycles
- 2024: R+39.5 2020: R+32.2 2016: R+38.4 2012: R+40.9 2008: R+36.7
Not yet ingested
- Civics
- —
Market trends
- HPI YoY
- ▼ -56.94%
- Current HPI
- 227.7841
- Rent YoY
- ▲ 2.21%
- Metro
- Lubbock, TX
- State GDP YoY
- ▲ 3.95%
- F500 in state
- 110
Industry mix (Fortune 500 HQ in TX)
| Industry | F500 HQs | Revenue |
|---|---|---|
| Energy | 16 | $1,198B |
|
||
| Technology | 5 | $198B |
|
||
| Engineering / Construction | 4 | $72B |
|
||
| Energy Services | 3 | $60B |
|
||
| Utilities | 3 | $41B |
|
||
| Healthcare | 2 | $330B |
|
||
Price history
+35.9% since first listed10 events — show timeline
- 2026-04-13 Listed $135,750 LARMLS
- 2021-11-15 Sold (Public Records) — Public Records
- 2021-11-15 Sold (MLS) — LARMLS
- 2021-10-06 Listed $157,500 LARMLS
- 2021-07-02 Listed $155,000 LARMLS
- 2014-07-24 Sold (Public Records) — Public Records
- 2014-07-23 Sold (MLS) — LARMLS
- 2013-08-05 Listed $99,900 LARMLS
- 2008-06-06 Sold (Public Records) — Public Records
- 2004-11-01 Sold (Public Records) — Public Records
Property tax history
+5.0%/yrLatest (2025): $3,626 · -1.7% YoY. Source: county tax records.
Cash-flow waterfall
monthlySold comps — $/sqft
last 12 mo · ≤1 miLoading sold comps…