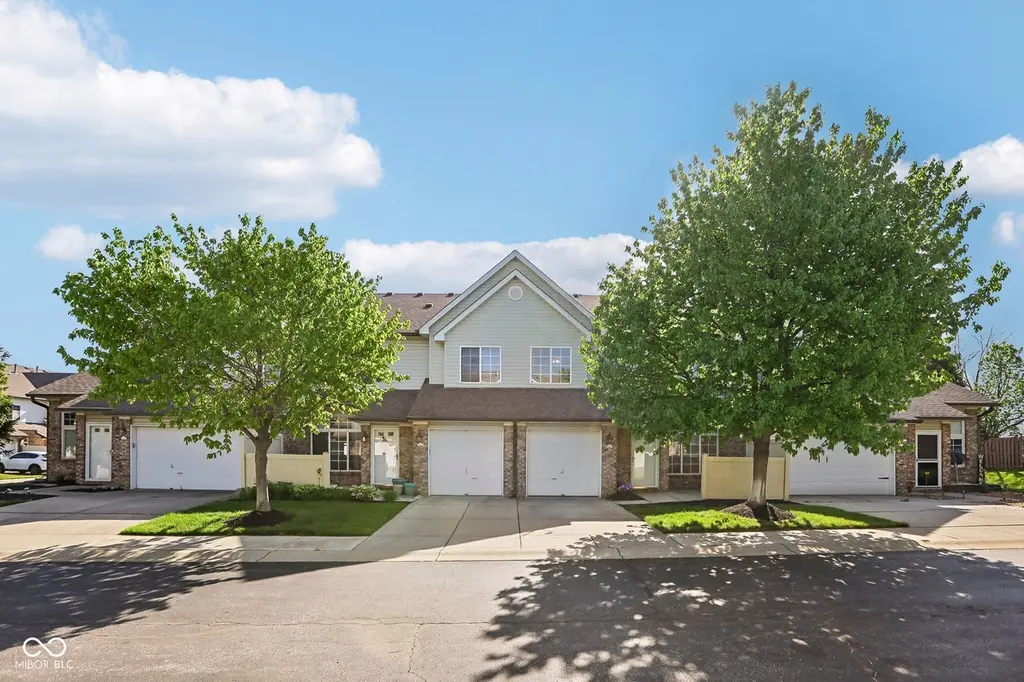
253 Provincial Ln Unit C · Avon, IN
Flood risk 1/10 · Minimal
- FEMA flood zone
- X (unshaded)
- Chance of flooding over 30 yrs
- 0.0%
- Est. flood insurance / yr
- $507 – $1,088
Fire risk 1/10 · Minimal
- Est. fire insurance / yr
- $717 – $1,331
Heat risk 3/10 · Minor
- Hot days now (above 102°F)
- 7 days/yr
- Hot days in 30 yrs
- 19 days/yr
Wind risk 2/10 · Minimal
- Chance of severe wind over 30 yrs
- 0.0%
Air-quality risk 2/10 · Minimal
- Unhealthy air days now
- 1 days/yr
- Unhealthy air days in 30 yrs
- 2 days/yr
Risk factors via First Street. Map © Google.
Why this score? — see what drove the D- grade
The composite is a weighted blend of 9 inputs, each scored 0–100. Each bar is that input's sub-score; the figure is the points it added to the 100-point composite (weight × sub-score).
- Cash flow +10.6/30.0
- ARV discount +7.5/15.0
- Schools +4.7/10.0
- 1% rule +4.4/10.0
- Livability +3.7/5.0
- Rent growth +3.2/5.0
- DSCR +3.1/10.0
- Condition / age +2.5/5.0
- Appreciation +0.0/10.0
$195,000
🖨 Deal sheet 📄 Offer letter ✓ Due diligence
Listing remarks MLS
BEAUTIFUL TOWNHOUSE CONDO W/9' CEILINGS AND LARGE WINDOWS CREATE AN OPEN & BRIGHT FLOOR PLAN.KITCHEN HAS BREAKFAST BAR AND BUILT-IN MICROWAVE.LARGE MASTER HAS 2 CLOSETS.CONVENIENT UPSTAIRS LAUNDRY.GOOD STORAGE SPACE.1 C AR ATTACHED GARAGE.CUTE PATIO IN FRONT.QUIET NEIGHBORHOOD,CLOSE TO EVERYTHING.WATER INCLUDED IN MAINTENANCE FEE.
Key facts
- Fresh paint
- New flooring
- Two levels
Tags
Property features AI
Finance
- Other: Mandatory fee ownership interest
- HOA & community: HOA with monthly fee of $200; HOA covers lawn care, snow removal, and trash; Community snow removal and trash services
Exterior
- Parking: Attached garage (1 car)
- Utilities: Public water; Municipal sewer connected; No solid waste service listed
- Home design: Residential condominium (attached); Horizontal condo, ground-level description; Two levels; Entry/facing information not provided
- Construction: Vinyl with brick and brick exterior; Full foundation and slab
- Exterior features: Sidewalks; 1 common wall; Less than 1/4 acre
Interior
- Kitchen: Dishwasher; Microwave; Refrigerator
- Bedrooms: 2 bedrooms on the upper level
- Bathrooms: 1 full bathroom; 1 half bathroom
- Heating & cooling: Forced air heating (natural gas); Central air conditioning
- Interior features: Vaulted ceilings; Pantry; Smoke detector(s)
- Laundry & utility: Washer; Dryer
Neighborhood map
What this means for you Summary
Snapshot
- This is a 2-bed/1.5-bath condo listed at $195k.
Deal economics
- At list price, monthly cash flow is $-97 ($-1k/yr) — negative.
- To cash-flow at today's rent, offer at most $178k (8.8% below list).
- To meet the 1% rule (rent ≥ 1% of price), the offer needs to be $184k (5.8% below list).
- Recommended offer: $178k (8.8% below list) — sets the bar for cash-flow.
- Cap rate 5.7% vs local median 3.8% in Avon — top-decile yield for the area; either an underpriced asset or a hidden risk that comps aren't pricing in. Stress-test before assuming the spread holds.
Location & tenants
- Location reads 74/100 on livability (#75 in IN, #4,686 nationally) — a middle-class / working-renter tenant base. Strengths: employment A+, cost of living A+, housing A+; Watch: amenities F, commute F.
- Avon Community School Corporation (suburban): math 51% / reading 53% proficiency, ranked #32 of 301 in IN (top 11%) — acceptable for families but not a draw, mixed tenant base, ~2y average lease; only 20% free/reduced lunch — higher-income household profile.
- Zoned schools: Avon High School (math 44% / reading 76%, grade C+, #46 of 369 statewide, top 13%, 3,348 students, 38% FRL) — zoned schools average 38% FRL vs 20% district-wide (19 pts higher); higher-poverty schools than district average — tighter screening recommended.
- Market conditions: Rents rising (+3.0%/yr); 380 active listings in the ZIP; 14 comparable units currently listed for rent nearby; rentals at typical pace (median 24d on market — plan ~3-4 weeks tenant-placement turnaround); solid renter incomes; 1,294 units permitted in Hendricks County in 2024 (18 in 5+ unit buildings).
Forward outlook
- Local home prices are declining (-3.0%/yr); year-one equity from $1k of loan paydown is wiped out by about $6k of value loss. Plan a longer hold.
- Hendricks County population projected at +35% by 2050 — long-run rental-demand tailwind backs the buy-and-hold thesis.
Negotiation context
- Only 8 days on market — expect competitive offers; lowballing is unlikely to land.
- 5 sale attempts since 26y ago with the ask held roughly flat each time — persistent listings suggest the price (not the market) is what's stuck; bring a comps-based counter.
Questions for the listing agent
- What do current leases actually rent for vs. the listed asking? Can we see a recent rent roll and the last 12 months of T-12 income?
- What does the HOA fee cover, when was the last increase, and are there any pending special assessments or reserve-fund shortfalls?
- Any open or pending special assessments — roof, HVAC, plumbing, elevator, façade? What's the per-unit balance and payoff schedule, and is the seller paying it off at close or rolling it to the buyer?
- Is there a deadline driving the sale (1031 exchange, divorce, estate, relocation)? That informs how much negotiation room exists.
- Schools are A-rated — typically a magnet for longer-tenancy family renters. What's the average tenant stay here, and is there a school-zone premium baked into asking?
- The area grade is low — what's the realistic commute time and amenity access for the typical tenant pool here? Any planned neighborhood developments (good or bad) we should know about?
- What's the average days-on-market for RENTAL listings here right now (not sales)? A rising rental-DOM trend means longer vacancies and softer asking-rent achievability than the comps imply.
- What's the recent tenant-quality profile in this submarket — average credit score on applications, eviction rate, late-payment / NSF rate, and stable-employment percentage? A property-management company in the area should have these aggregated.
- How much new apartment / multifamily construction is in the pipeline within 1–3 miles? Heavy new supply (>2% of stock underway) typically softens rents 12–24 months out; light construction supports rent growth.
Investment metrics
- 1% rule
- 0.94% ✗
- Cap rate
- 5.70%
- Cash-on-cash
- -2.13%
- DSCR
- 0.91
- GRM
- 8.8
CMA / ARV
No comps found within radius.
Projected returns pro-forma
-3.0% appreciation · 2.98% rent growth · sell at horizon
- IRR
- -19.7%
- Equity multiple
- 0.31×
- Total profit
- $-37,656
- Equity at exit
- $29,075
- IRR
- -12.5%
- Equity multiple
- 0.26×
- Total profit
- $-40,275
- Equity at exit
- $16,860
Cash invested: $54,600 (down + closing). Projections, not guarantees.
Landlord ↔ Tenant lean methodology
- Overall (STATE)
- 90 Strongly Landlord-Friendly
- State Indiana
- 90 Strongly Landlord-Friendly · R+11
- County
- — inherits STATE
- City
- — inherits STATE
ZIP-level market 46123
- Home prices YoY
- -21.3%
- Rents YoY
- 3.0%
- Active inventory
- 380
- Price-to-rent
- 8.8×
Monthly cashflow live
- Estimated rent
- $1,837 high interval (Pro) →
- Mortgage (P&I)
- −$1,023
- Tax from tax record
- −$245 /mo · $2,934/yr
- Insurance
- −$81
- HOA
- −$200
- Vacancy / Maint / Mgmt
- −$386
- Net cashflow
- $-97
Break-even live
UW: 25.0% down · 7.5% · 30yr · 1.5% tax · 5.0% vac · 8.0% maint · 8.0% mgmt
Financing live
Cash to close
- Down payment
- $48,750
- Closing costs
- $5,850
- Reserves months
- —
- Total cash needed
- —
Loan-product check · same deal, 3 products live
Conventional
25% down · 7.5% · 30yr
- Down + closing
- —
- Monthly P&I
- —
- Monthly cashflow
- —
- DSCR
- —
- Eligible?
- —
Personal DTI + credit; lowest rate.
DSCR
20% down · 8.5% · 30yr
- Down + closing
- —
- Monthly P&I
- —
- Monthly cashflow
- —
- DSCR
- —
- Eligible?
- —
No personal income docs; deal must DSCR.
Hard money
10% down · 12.0% · 12mo
- Down + closing
- —
- Monthly P&I
- —
- Monthly cashflow
- —
- DSCR
- —
- Eligible?
- —
Short-term bridge; refi at stabilization.
Rent comps 14 comps
| Address | Beds | Baths | Sqft | Rent | $/sqft | DOM | Units | Dist |
|---|---|---|---|---|---|---|---|---|
| 481 Villa Meadow Dr Avon, IN | 3.0 | 2.0 | 1300 | $1,900 | $1.46 | 23d | 1 | 0.18mi |
| 9661 Trail Dr Avon, IN | 3.0 | 2.0 | 1444 | $1,925 | $1.33 | 17d | 1 | 0.27mi |
| 9762 Trail Dr Avon, IN | 3.0 | 2.0 | 1212 | $1,901 | $1.57 | 2d | 1 | 0.35mi |
| 556 Dylan Dr Avon, IN | 2.0 | 2.0 | 1238 | $1,875 | $1.51 | 23d | 1 | 0.43mi |
| 567 Dylan Dr Unit 556 Avon, IN | 2.0 | 2.0 | 1238 | $1,875 | $1.51 | 23d | 1 | 0.49mi |
| 10272 Steeplechase Dr Avon, IN | 1.0–3.0 | 1.0–2.0 | 940 | $1,578 | $1.68 | 1d | 42 | 0.61mi |
| 781 Hollowood Ln Avon, IN | 3.0 | 2.0 | 1370 | $1,800 | $1.31 | 43d | 1 | 0.63mi |
| 129 Satori Pkwy Avon, IN | 1.0–2.0 | 1.0–2.0 | 993 | $1,840 | $1.85 | 2d | 30 | 0.87mi |
| 129 Satori Pkwy Avon, IN | 1.0–2.0 | 1.0–2.0 | 992 | $1,840 | $1.85 | 43d | 18 | 0.87mi |
| 539 Sun Ridge Blvd Avon, IN | 3.0 | 2.0 | 1222 | $1,800 | $1.47 | 21d | 1 | 1.06mi |
| 10435 Cox Pl Indianapolis, IN | 1.0–2.0 | 1.0–2.0 | 999 | $1,625 | $1.63 | 43d | 1 | 1.06mi |
| 8335 Eagles Nest Dr Avon, IN | 3.0 | 2.0 | 1410 | $1,830 | $1.30 | 23d | 1 | 1.10mi |
| 10531 Kings Row Dr Avon, IN | 1.0–3.0 | 1.0–2.0 | 1080 | $1,661 | $1.54 | 1d | 11 | 1.34mi |
| 10341 Buckshire Ln Indianapolis, IN | 3.0 | 2.0 | 1257 | $1,779 | $1.42 | 43d | 1 | 1.41mi |
HOA detail condo
- Monthly dues
- $200 · $2,400/yr
- Likely covers
- water
- Assessments
- None detected in remarks — confirm with the listing agent.
Listing history 10 events
-
2026-05-02status Pending 1533-char remark
-
2026-04-24$195,000 Active 1533-char remark
-
2007-09-28soldstatus $76,500 336-char remark
Show marketing remark (336 chars)
BEAUTIFUL TOWNHOUSE CONDO W/9' CEILINGS AND LARGE WINDOWS CREATE AN OPEN & BRIGHT FLOOR PLAN.KITCHEN HAS BREAKFAST BAR AND BUILT-IN MICROWAVE.LARGE MASTER HAS 2 CLOSETS.CONVENIENT UPSTAIRS LAUNDRY.GOOD STORAGE SPACE.1 C AR ATTACHED GARAGE.CUTE PATIO IN FRONT.QUIET NEIGHBORHOOD,CLOSE TO EVERYTHING.WATER INCLUDED IN MAINTENANCE FEE.
-
2007-07-03$79,900 336-char remark
Show marketing remark (336 chars)
BEAUTIFUL TOWNHOUSE CONDO W/9' CEILINGS AND LARGE WINDOWS CREATE AN OPEN & BRIGHT FLOOR PLAN.KITCHEN HAS BREAKFAST BAR AND BUILT-IN MICROWAVE.LARGE MASTER HAS 2 CLOSETS.CONVENIENT UPSTAIRS LAUNDRY.GOOD STORAGE SPACE.1 C AR ATTACHED GARAGE.CUTE PATIO IN FRONT.QUIET NEIGHBORHOOD,CLOSE TO EVERYTHING.WATER INCLUDED IN MAINTENANCE FEE.
-
2005-09-03historical
-
2005-03-03$79,900
-
2002-07-30historical
-
2002-01-30$84,900
-
2000-08-14historical
-
2000-02-14$96,500
ⓘ Source: listings_history table (triggers on properties + properties_extension) + one-shot
backfill from property_details.listing_events for pre-trigger history.
Tax reassessment forecast IN · Partial reset (capped growth)
- Current annual tax
- $2,934 · $245/mo
- Projected year-2 tax
- $2,934 · $245/mo
- Expected delta
- $0/yr ($0/mo · 0.0%)
ⓘ Screening estimate from a state-policy table — verify with the county assessor before closing.
Climate risk First Street
- Flood 1/10 Low FEMA zone X (unshaded) · 0% chance over 30 yrs
- Wildfire 1/10 Low
- Heat 3/10 Moderate 7 d/yr ≥102°F today · 19 d/yr by 30 yrs out
- Wind 2/10 Low 0% chance of damaging wind over 30 yrs
- Air quality 2/10 Low 1 unhealthy d/yr today · 2 by 30 yrs out
Nearby sold comps map
Loading sold comps map…
Walkable amenities ~0.75 mi
Loading nearby amenities…
Taxation est. · year 1
- Rental income
- $22,048
- − Mortgage interest
- −$10,923
- − Property taxes
- −$2,934
- − Insurance
- −$975
- − Repairs & maintenance
- −$1,764
- − Management
- −$1,764
- − HOA
- −$2,400
- − Depreciation
- −$5,673
- Taxable loss
- −$4,385
- Est. tax savings @ 24.0%
- +$1,052
- After-tax cash flow
- $-110/yr
For passive investors: Depreciation is non-cash, so a rental often shows a tax loss while cash-flowing — sheltering income. Rental losses are passive: they offset passive income freely, and up to $25,000/yr can offset ordinary (W-2) income if you actively participate and your MAGI is under $100k (phasing out to $0 by $150k); unused losses carry forward. On sale, claimed depreciation is recaptured at up to 25%, and gains may owe capital-gains tax (a 1031 exchange can defer both). Figures are a year-1 estimate at your 24.0% rate — not tax advice; consult a CPA.
Schools (NCES district)
- District
- Avon Community School Corporation
- NCES district ID
- 1800270
- Math proficiency
- 51% ▼ -8.00%
- Reading proficiency
- 53% ▼ -8.00%
- Median HH income
- $75,987
- Composite
- 46.93/100
- National rank
- #2362
- State rank
- #32 of 301 in IN
Livability — Avon
- Score
- 74/100
- State rank
- #75
- US rank
- #4686
Category grades
Schools grade is shown separately in the Schools card above.
Census & demographics
- County
- Hendricks County · 143,373 people
- City population
- 43,353
- Metro
- Indianapolis-Carmel-Anderson, IN
- Population (ZIP)
- 43,353
- Household income
- $103,485
- Rent vs Own
- Severe rent burden
- 529.0
Population outlook (Hendricks County) Hauer SSP2
- Today (2025)
- 187,418 people
- By 2030
- 201,494 · +7.5%
- By 2040
- 228,487 · +21.9%
- By 2050
- 253,068 · +35.0%
- By 2075
- 308,920 · +64.8%
- By 2100
- 336,510 · +79.6%
Race, ethnicity, and origin ACS 2023
- Neighborhood character
- Predominantly White (74%)
- Race & ethnicity
- White 74% Black 12% Hispanic / Latino 7% Two or more races 6% Asian 4%
- Hispanic origin (detail)
- Mexican 2%
- Common ancestry
- Slovak 3% Romanian 2% Italian 1%
- Foreign-born
- 6% · Canada, South Korea
- Languages at home
- 92% English-only · Spanish 4% Other Indo-European 2%
Political lean MEDSL · Hendricks
- 2024 margin
- Strong R (+21.5) · D 38.4% · R 59.9% · Other 1.7%
- 2008→2024 swing
- +1.9pp toward D · 2008: -23.4pp · 2024: -21.5pp
- All cycles
- 2024: R+21.5 2020: R+23.9 2016: R+34.2 2012: R+34.9 2008: R+23.4
Not yet ingested
- Civics
- —
Market trends
- HPI YoY
- ▼ -55.05%
- Current HPI
- 203.9226
- Rent YoY
- ▲ 2.98%
- Metro
- Indianapolis-Carmel-Anderson, IN
- State GDP YoY
- ▲ 2.90%
- F500 in state
- 18
Industry mix (Fortune 500 HQ in IN)
| Industry | F500 HQs | Revenue |
|---|---|---|
| Industrial Machinery | 2 | $37B |
|
||
| Healthcare | 1 | $177B |
|
||
| Pharmaceuticals | 1 | $45B |
|
||
| Metals / Steel | 1 | $18B |
|
||
| Agriculture | 1 | $17B |
|
||
| Packaging | 1 | $12B |
|
||
Price history
+102.1% since first listed11 events — show timeline
- 2026-06-12 Sold (MLS) $195,000 MIBOR as Distributed by MLS Grid
- 2026-05-02 Pending — MIBOR as Distributed by MLS Grid
- 2026-04-24 Listed $195,000 MIBOR as Distributed by MLS Grid
- 2007-09-28 Sold (MLS) $76,500 MIBOR as Distributed by MLS Grid
- 2007-07-03 Listed $79,900 MIBOR as Distributed by MLS Grid
- 2005-09-03 Listing Removed — MIBOR as Distributed by MLS Grid
- 2005-03-03 Listed $79,900 MIBOR as Distributed by MLS Grid
- 2002-07-30 Listing Removed — MIBOR as Distributed by MLS Grid
- 2002-01-30 Listed $84,900 MIBOR as Distributed by MLS Grid
- 2000-08-14 Listing Removed — MIBOR as Distributed by MLS Grid
- 2000-02-14 Listed $96,500 MIBOR as Distributed by MLS Grid
Property tax history
+5.0%/yrLatest (2025): $2,934 · +10.0% YoY. Source: county tax records.
Cash-flow waterfall
monthlySold comps — $/sqft
last 12 mo · ≤1 miLoading sold comps…