 🏗️ New Construction
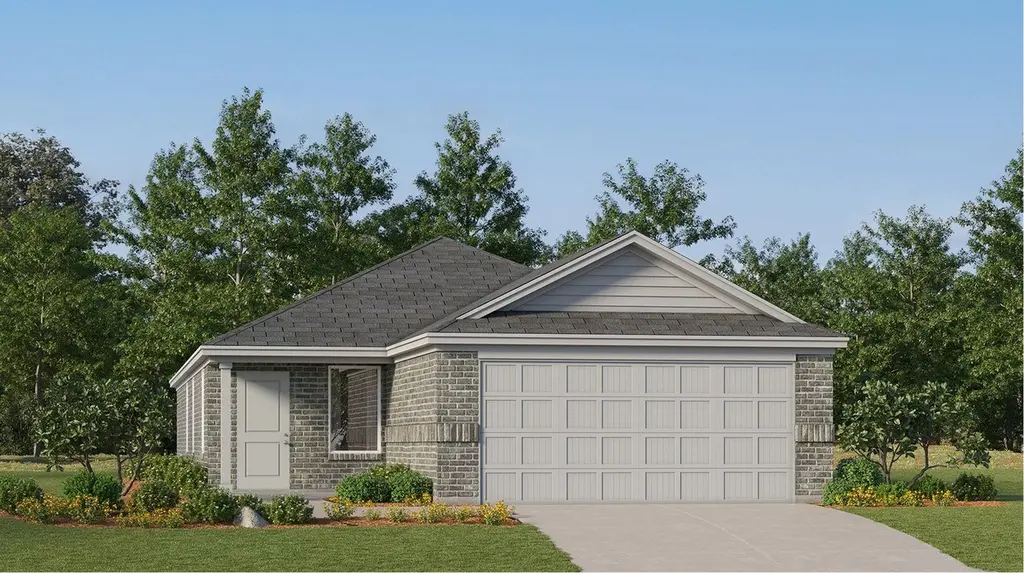
Sentosa Plan · Iowa Colony, TX
Flood risk No data
- FEMA flood zone
- —
- Chance of flooding over 30 yrs
- —
- Est. flood insurance / yr
- —
Fire risk No data
- Est. fire insurance / yr
- —
Heat risk No data
- Hot days now (above threshold)
- —
- Hot days in 30 yrs
- —
Wind risk No data
- Chance of severe wind over 30 yrs
- —
Air-quality risk No data
- Unhealthy air days now
- —
- Unhealthy air days in 30 yrs
- —
Risk factors via First Street. Map © Google.
Why this score? — see what drove the D+ grade
The composite is a weighted blend of 9 inputs, each scored 0–100. Each bar is that input's sub-score; the figure is the points it added to the 100-point composite (weight × sub-score).
- Cash flow +16.8/30.0
- ARV discount +7.5/15.0
- DSCR +5.2/10.0
- Condition / age +4.8/5.0
- 1% rule +4.6/10.0
- Schools +3.9/10.0
- Livability +3.2/5.0
- Rent growth +2.6/5.0
- Appreciation +0.0/10.0
$281,990
🖨 Deal sheet (PDF) 📄 Offer letter ✓ Due diligence
Listing remarks MLS
This new home offers simple living with a convenient single-level layout. An open-concept floorplan combines the kitchen, living and dining areas for simple entertaining and multitasking. Three secondary bedrooms are tucked away to the side of the home, and the owner's suite is nestled into a private rear corner, offering access to a spa-inspired bathroom and walk-in closet.
Key facts
- 2 garage spots
- Listed 368 days
Neighborhood map
What this means for you Summary
Snapshot
- This is a 4-bed/2.0-bath single-family listed at $282k. Condition is rated excellent.
Deal economics
- At list price, monthly cash flow is $189 ($2k/yr) — positive.
- The deal already cash-flows at list — no discount required.
- To meet the 1% rule (rent ≥ 1% of price), the offer needs to be $282k (0.2% below list).
- Recommended offer: $248k (12.0% below list) — sets the bar for market timing.
- Cap rate 7.1% vs local median 4.2% in Iowa Colony — top-decile yield for the area; either an underpriced asset or a hidden risk that comps aren't pricing in. Stress-test before assuming the spread holds.
Location & tenants
- Location reads 64/100 on livability (#757 in TX) — a middle-class / working-renter tenant base. Strengths: crime A+, employment A+, cost of living A+; Watch: schools F, amenities F, commute F.
- Alvin ISD (suburban): math 39% / reading 48% proficiency, ranked #255 of 826 in TX (top 31%) — families likely to look elsewhere, expect single-tenant / working-renter base with shorter leases.
- Market conditions: Rents flat; 1148 active listings in the ZIP; 10 comparable units currently listed for rent nearby; rentals lingering (median 45d on market — plan ~5-8 weeks vacancy on turnover, expect pricing pressure); 50% of comp listings sitting > 30 days — soft ceiling on asking rent; high-income renter base; 3,960 units permitted in Brazoria County in 2024 (593 in 5+ unit buildings).
Forward outlook
- Local home prices are declining (-3.0%/yr); year-one equity from $2k of loan paydown is wiped out by about $9k of value loss. Plan a longer hold.
- Brazoria County population projected at +44% by 2050 — long-run rental-demand tailwind backs the buy-and-hold thesis.
Negotiation context
- It's been on market 369 days — a 12% lower offer ($248k) is reasonable based on typical stale-listing flexibility.
Questions for the listing agent
- It's been on market 369 days. Have you received any prior offers? Is the seller open to a 12% concession, seller financing, or rate buy-down credit?
- Why hasn't it sold? Are there any deal-killer items the seller is aware of (foundation, flood, title, zoning, code violations)?
- Is there a deadline driving the sale (1031 exchange, divorce, estate, relocation)? That informs how much negotiation room exists.
- Schools are F-rated, which usually means shorter tenancies and higher turnover. Who's the typical renter profile here, and what's been the actual vacancy rate?
- The area grade is low — what's the realistic commute time and amenity access for the typical tenant pool here? Any planned neighborhood developments (good or bad) we should know about?
- What's the average days-on-market for RENTAL listings here right now (not sales)? A rising rental-DOM trend means longer vacancies and softer asking-rent achievability than the comps imply.
- What's the recent tenant-quality profile in this submarket — average credit score on applications, eviction rate, late-payment / NSF rate, and stable-employment percentage? A property-management company in the area should have these aggregated.
- How much new for-sale + rental construction is in the pipeline within 1–3 miles? Heavy new supply typically softens prices + rents 12–24 months out; constrained supply supports both.
Investment metrics
- 1% rule
- 0.96% ✗
- Cap rate
- 7.06%
- Cash-on-cash
- 2.75%
- DSCR
- 1.12
- GRM
- 8.7
CMA / ARV
- ARV (median comp)
- $294,529
- List price
- $281,990
- Delta
- -4.26%
- Verdict
- FAIR
- Comps
- 20 within 1.0 mi
Show comp detail 12 sales within ~0.75 mi
| Address | Dist | Beds/Ba | Sqft | Sold | Price | $/sf | Match |
|---|---|---|---|---|---|---|---|
| 8738 Jade Hill Dr | 0.03mi | 4/2.0 | 1,770 (+8%) | 1mo | $349,990 | $198 | 85 |
| 2415 Imperial Jade Dr | 0.04mi | 4/2.0 | 1,573 (-4%) | 9mo | $249,990 | $159 | 84 |
| 8918 Ice Quartz Dr | 0.16mi | 3/2.0 (-1) | 1,620 (-2%) | 6mo | $303,900 | $188 | 80 |
| 8930 Ice Quartz Dr | 0.18mi | 4/2.0 | 1,778 (+8%) | 4mo | $313,900 | $177 | 75 |
| 7723 Montana Ruby Dr | 0.17mi | 3/2.0 (-1) | 1,822 (+11%) | 8mo | $326,990 | $179 | 62 |
| 8902 Ice Quartz Dr | 0.15mi | 3/2.0 (-1) | 1,420 (-14%) | 4mo | $290,900 | $205 | 62 |
| 2419 Jasper Breeze Dr | 0.19mi | 3/2.0 (-1) | 1,409 (-14%) | 7mo | $277,990 | $197 | 56 |
| 2511 Night Emerald Dr | 0.72mi | 4/2.0 | 1,736 (+6%) | 7mo | $292,990 | $169 | 51 |
| 2527 Night Emerald Dr | 0.71mi | 4/2.0 | 1,776 (+8%) | 8mo | $298,990 | $168 | 47 |
| 2507 Night Emerald Dr | 0.72mi | 3/2.0 (-1) | 1,876 (+14%) | 7mo | $312,990 | $167 | 32 |
| 2522 American Ruby Dr | 0.75mi | 3/2.0 (-1) | 1,876 (+14%) | 8mo | $308,990 | $165 | 30 |
| 2610 American Ruby Dr | 0.74mi | 3/2.0 (-1) | 1,876 (+14%) | 8mo | $307,990 | $164 | 30 |
Match score weights: distance 35% · size 25% · config 20% · recency 20%. Top-matched comps best support the ARV.
Projected returns pro-forma
-3.0% appreciation · 0.44% rent growth · sell at horizon
- IRR
- -14.9%
- Equity multiple
- 0.48×
- Total profit
- $-42,726
- Equity at exit
- $43,915
- IRR
- -11.2%
- Equity multiple
- 0.40×
- Total profit
- $-49,110
- Equity at exit
- $25,465
Cash invested: $82,468 (down + closing). Projections, not guarantees.
Landlord ↔ Tenant lean methodology
- Overall (STATE)
- 87 Strongly Landlord-Friendly
- State Texas
- 87 Strongly Landlord-Friendly · R+5
- County
- — inherits STATE
- City
- — inherits STATE
ZIP-level market 77583
- Rents YoY
- 0.4%
- Active inventory
- 1148
- Price-to-rent
- 8.3×
Monthly cashflow live
- Estimated rent
- $2,816 high interval (Pro) →
- Mortgage (P&I)
- −$1,545
- Tax est. 1.5%
- −$368 /mo · $4,418/yr
- Insurance
- −$123
- HOA
- −$0
- Vacancy / Maint / Mgmt
- −$591
- Net cashflow
- $189
Break-even live
Sensitivity live
| Price | -10% $392 | -5% $291 | +0% $189 | +5% $87 | +10% $-15 |
|---|---|---|---|---|---|
| Rent | -10% $-34 | -5% $78 | +0% $189 | +5% $300 | +10% $411 |
| Rate | -1.0pp $337 | -0.5pp $264 | base $189 | +0.5pp $113 | +1.0pp $35 |
UW: 25.0% down · 7.5% · 30yr · 1.5% tax · 5.0% vac · 8.0% maint · 8.0% mgmt
Financing live
Cash to close
- Down payment
- $73,632
- Closing costs
- $8,836
- Reserves months
- —
- Total cash needed
- —
Loan-product check · same deal, 3 products live
Conventional
25% down · 7.5% · 30yr
- Down + closing
- —
- Monthly P&I
- —
- Monthly cashflow
- —
- DSCR
- —
- Eligible?
- —
Personal DTI + credit; lowest rate.
DSCR
20% down · 8.5% · 30yr
- Down + closing
- —
- Monthly P&I
- —
- Monthly cashflow
- —
- DSCR
- —
- Eligible?
- —
No personal income docs; deal must DSCR.
Hard money
10% down · 12.0% · 12mo
- Down + closing
- —
- Monthly P&I
- —
- Monthly cashflow
- —
- DSCR
- —
- Eligible?
- —
Short-term bridge; refi at stabilization.
Rent comps 10 comps
| Address | Beds | Baths | Sqft | Rent | $/sqft | DOM | Units | Dist |
|---|---|---|---|---|---|---|---|---|
| 2523 Topaz Hill Ln Rosharon, TX | 3.0–4.0 | 2.0–2.5 | 1857 | $2,950 | $1.59 | 18d | 1 | 0.12mi |
| 2510 Green Jasper Dr Rosharon, TX | 3.0 | 2.0 | 1561 | $2,375 | $1.52 | 45d | 1 | 0.18mi |
| 9518 Peridot Green Dr Rosharon, TX | 4.0 | 2.0 | 1593 | $1,886 | $1.18 | 23d | 1 | 0.90mi |
| 9901 Kilkenny St Iowa Colony, TX | 3.0–4.0 | 2.5 | 1735 | $2,726 | $1.57 | 0d | 1 | 1.25mi |
| 9423 Grand Spark Dr Rosharon, TX | 3.0 | 3.0 | 1999 | $2,600 | $1.30 | 45d | 1 | 1.33mi |
| 8219 House Dr Rosharon, TX | 3.0 | 2.0 | 1263 | $1,970 | $1.56 | 23d | 1 | 1.44mi |
| 1119 Toledo Bend Pass Rosharon, TX | 5.0 | 3.0 | 2200 | $2,500 | $1.14 | 45d | 1 | 1.45mi |
| 8102 Buck Ln Rosharon, TX | 3.0 | 2.0 | 1409 | $2,100 | $1.49 | 45d | 1 | 1.46mi |
| 10211 Alpine Lake Ln Rosharon, TX | 3.0–4.0 | 2.0–2.5 | 1731 | $2,875 | $1.66 | 45d | 7 | 1.49mi |
| 10211 Alpine Lake Ln Rosharon, TX | 3.0–4.0 | 2.0–2.5 | 1731 | $3,025 | $1.75 | 0d | 6 | 1.49mi |
Listing history 16 events
-
2026-06-21days on market $281,990 Active 369 DOM
-
2026-06-18days on market $281,990 Active 366 DOM
-
2026-06-17days on market $281,990 Active 365 DOM
-
2026-06-16days on market $281,990 Active 364 DOM
-
2026-06-15days on market $281,990 Active 363 DOM
-
2026-06-13days on market $281,990 Active 361 DOM
-
2026-06-13days on market $281,990 Active 360 DOM
-
2026-06-09days on market $281,990 Active 357 DOM
-
2026-06-08days on market $281,990 Active 356 DOM
-
2026-06-07days on market $281,990 Active 355 DOM
-
2026-06-04days on market $281,990 Active 352 DOM
-
2026-06-03days on market $281,990 Active 351 DOM
-
2026-06-02days on market $281,990 Active 350 DOM
-
2026-06-01days on market $281,990 Active 349 DOM
-
2026-05-31days on market $281,990 Active 348 DOM
-
2025-06-18$281,990 Active 377-char remark
Show marketing remark (377 chars)
This new home offers simple living with a convenient single-level layout. An open-concept floorplan combines the kitchen, living and dining areas for simple entertaining and multitasking. Three secondary bedrooms are tucked away to the side of the home, and the owner's suite is nestled into a private rear corner, offering access to a spa-inspired bathroom and walk-in closet.
ⓘ Source: listings_history table (triggers on properties + properties_extension) + one-shot
backfill from property_details.listing_events for pre-trigger history.
Nearby sold comps map
Loading sold comps map…
Walkable amenities ~0.75 mi
Loading nearby amenities…
Taxation est. · year 1
- Rental income
- $33,787
- − Mortgage interest
- −$16,498
- − Property taxes
- −$4,418
- − Insurance
- −$1,473
- − Repairs & maintenance
- −$2,703
- − Management
- −$2,703
- − Depreciation
- −$8,568
- Taxable loss
- −$2,576
- Est. tax savings @ 24.0%
- +$618
- After-tax cash flow
- $2,885/yr
For passive investors: Depreciation is non-cash, so a rental often shows a tax loss while cash-flowing — sheltering income. Rental losses are passive: they offset passive income freely, and up to $25,000/yr can offset ordinary (W-2) income if you actively participate and your MAGI is under $100k (phasing out to $0 by $150k); unused losses carry forward. On sale, claimed depreciation is recaptured at up to 25%, and gains may owe capital-gains tax (a 1031 exchange can defer both). Figures are a year-1 estimate at your 24.0% rate — not tax advice; consult a CPA.
Condition & rehab AI · 12 photos
This single-family home is in excellent condition with a modern design and well-maintained exterior. It offers a good investment opportunity with minimal maintenance required.
Value-add opportunities
- Resale Painting interior walls — Fresh paint can enhance the home's curb appeal and make it more appealing to potential buyers.
- Rental Landscaping improvements — Well-maintained landscaping can attract more renters and increase rental value.
- Both Add smart home features — Smart home features can increase both resale and rental value by making the home more convenient and energy-efficient.
Renovation cost estimate screening
Value-add ROI direction
- Resale Painting interior walls — Fresh paint can enhance the home's curb appeal and make it more appealing to potential buyers. ↑
- Rental Landscaping improvements — Well-maintained landscaping can attract more renters and increase rental value. ↑
- Both Add smart home features — Smart home features can increase both resale and rental value by making the home more convenient and energy-efficient. ↑
ⓘ Cost ranges are severity-bucket heuristics (US national rule-of-thumb). Get contractor quotes + a written scope before underwriting a rehab budget.
Schools (NCES district)
- District
- Alvin ISD
- NCES district ID
- 4808090
- Math proficiency
- 39% ▼ -11.00%
- Reading proficiency
- 48% ▬ 0.00%
- Median HH income
- $66,740
- Composite
- 38.96/100
- National rank
- #4080
- State rank
- #255 of 826 in TX
Livability — Iowa Colony
- Score
- 64/100
- State rank
- #757
- US rank
- #13904
Category grades
Schools grade is shown separately in the Schools card above.
Census & demographics
- Census place
- Iowa Colony, TX
- County
- Brazoria County · 374,982 people
- City population
- 52,747
- Metro
- Houston-The Woodlands-Sugar Land, TX
- Population (ZIP)
- 52,747
- Household income
- $119,287
- Rent vs Own
- Severe rent burden
- 251.0
Population outlook (Brazoria County) Hauer SSP2
- Today (2025)
- 420,414 people
- By 2030
- 457,585 · +8.8%
- By 2040
- 532,232 · +26.6%
- By 2050
- 605,399 · +44.0%
- By 2075
- 779,358 · +85.4%
- By 2100
- 883,759 · +110.2%
Race, ethnicity, and origin ACS 2023
- Neighborhood character
- Highly diverse neighborhood (Simpson 0.70)
- Race & ethnicity
- Hispanic / Latino 38% Black 34% White 20% Two or more races 18% Asian 5%
- Hispanic origin (detail)
- Mexican 31% Puerto Rican 2%
- Common ancestry
- Lithuanian 1% Slovak 1% Romanian 1%
- Foreign-born
- 16% · Canada, Vietnam, China
- Languages at home
- 64% English-only · Spanish 28% Other Asian/Pacific 2% Vietnamese 1%
Political lean MEDSL · Brazoria
- 2024 margin
- R (+19.7) · D 39.5% · R 59.2% · Other 1.3%
- 2008→2024 swing
- +9.9pp toward D · 2008: -29.6pp · 2024: -19.7pp
- All cycles
- 2024: R+19.7 2020: R+18.2 2016: R+24.6 2012: R+34.2 2008: R+29.6
Not yet ingested
- Civics
- —
Market trends
- HPI YoY
- ▼ -120.19%
- Current HPI
- 198.6559
- Rent YoY
- ▲ 0.44%
- Metro
- Houston-The Woodlands-Sugar Land, TX
- State GDP YoY
- ▲ 3.95%
- F500 in state
- 110
Industry mix (Fortune 500 HQ in TX)
| Industry | F500 HQs | Revenue |
|---|---|---|
| Energy | 16 | $1,198B |
|
||
| Technology | 5 | $198B |
|
||
| Engineering / Construction | 4 | $72B |
|
||
| Energy Services | 3 | $60B |
|
||
| Utilities | 3 | $41B |
|
||
| Healthcare | 2 | $330B |
|
||
Price history
1 event — show timeline
- 2025-06-18 Listed $281,990 Zillow
Cash-flow waterfall
monthlySold comps — $/sqft
last 12 mo · ≤1 miLoading sold comps…