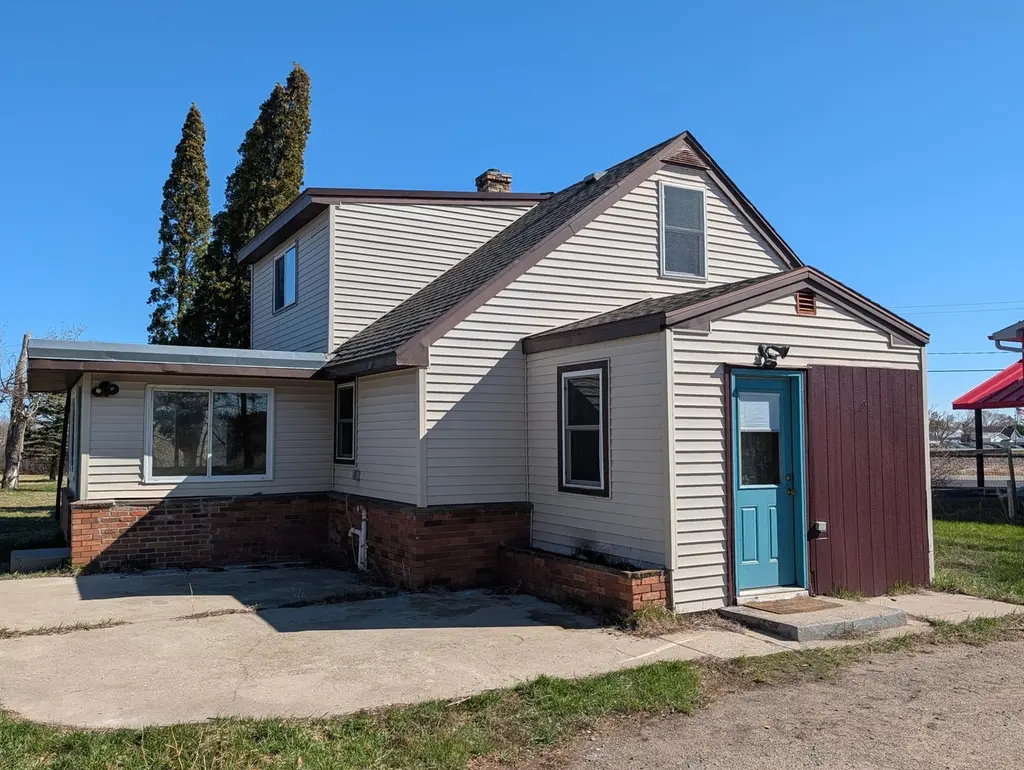
612 Railroad St SE · Bemidji, MN
Flood risk 1/10 · Minimal
- FEMA flood zone
- —
- Chance of flooding over 30 yrs
- 0.0%
- Est. flood insurance / yr
- —
Fire risk 6/10 · Moderate
- Est. fire insurance / yr
- $888 – $1,650
Heat risk 1/10 · Minimal
- Hot days now (above 93°F)
- 7 days/yr
- Hot days in 30 yrs
- 12 days/yr
Wind risk 1/10 · Minimal
- Chance of severe wind over 30 yrs
- —
Air-quality risk 3/10 · Minor
- Unhealthy air days now
- 3 days/yr
- Unhealthy air days in 30 yrs
- 3 days/yr
Risk factors via First Street. Map © Google.
Why this score? — see what drove the C grade
The composite is a weighted blend of 9 inputs, each scored 0–100. Each bar is that input's sub-score; the figure is the points it added to the 100-point composite (weight × sub-score).
- Cash flow +21.6/30.0
- ARV discount +10.3/15.0
- DSCR +6.9/10.0
- 1% rule +5.3/10.0
- Schools +3.9/10.0
- Livability +3.7/5.0
- Rent growth +3.5/5.0
- Condition / age +2.5/5.0
- Appreciation +0.0/10.0
$174,000
🖨 Deal sheet (PDF) 📄 Offer letter ✓ Due diligence
Listing remarks
A little piece of country, in town. This 3 bed 1 bath home has a lot of privacy!! Large square footage, with a couple of extra rooms, and could be considered a 4 bedroom. Short jaunt to all the amenities Bemidji has to offer! Customize the yard to fit your needs!! Owner is agent.
Key facts
- Lot of privacy
- Extra rooms
- 0.71 acre lot
Tags
Property features AI
Finance
- Other: Lot size approximately 0.71 acres (dimensions 348x96x230x96)
- Financial info: Free and clear mortgage status; Standard rental license (rental license active)
Exterior
- Parking: Gravel parking; Detached 1-car garage (17x20) with 7' high by 8' wide door; One carport space
- Utilities: Private water; City sewer (connected / in street); Natural gas; 100 amp electric service (Ottertail Power)
- Home design: Residential property; Two levels; Accessibility features present
- Construction: Frame construction; Asphalt roof (over 8 years old); Block foundation; Built area above grade 1,576; Total building area 1,676
- Exterior features: Vinyl exterior; Lean-to; Irregular lot; City street frontage; Publicly maintained road
Interior
- Kitchen: Range; Refrigerator
- Bedrooms: Three bedrooms (two upper, one main)
- Bathrooms: One full bathroom (main level)
- Heating & cooling: Forced air heating; Window air conditioning units
- Interior features: Eat-in kitchen; Sun room; Bonus room (upper level); Main floor full bathroom; Block basement
- Laundry & utility: Main level laundry; Gas water heater
Neighborhood map
What this means for you Summary
Snapshot
- This is a 4-bed/1.0-bath other listed at $174k.
Deal economics
- At list price, monthly cash flow is $263 ($3k/yr) — positive.
- The deal already cash-flows at list — no discount required.
- Meets the 1% rule at list price ($2k rent vs $174k).
- Recommended offer: $171k (1.5% below list) — sets the bar for market timing.
- Cap rate 8.1% vs local median 3.6% in Bemidji — top-decile yield for the area; either an underpriced asset or a hidden risk that comps aren't pricing in. Stress-test before assuming the spread holds.
Location & tenants
- Location reads 73/100 on livability (#252 in MN) — a middle-class / working-renter tenant base. Strengths: amenities A+, cost of living A+, health & safety A+; Watch: crime F, commute F, employment F.
- Bemidji Public School District (rural): math 42% / reading 50% proficiency, ranked #173 of 301 in MN (top 58%) — families likely to look elsewhere, expect single-tenant / working-renter base with shorter leases.
- Market conditions: Rents rising fast (+4.0%/yr); 345 active listings in the ZIP; 1 comparable units currently listed for rent nearby; 165 units permitted in Beltrami County in 2024 (81 in 5+ unit buildings).
Forward outlook
- Local home prices are declining (-3.0%/yr); year-one equity from $1k of loan paydown is wiped out by about $5k of value loss. Plan a longer hold.
Negotiation context
- It's been on market 29 days — a 2% lower offer ($171k) is reasonable based on typical stale-listing flexibility.
- 5 sale attempts since 15y ago with the ask held roughly flat each time — persistent listings suggest the price (not the market) is what's stuck; bring a comps-based counter.
- Current owner paid $46k; list at $174k implies a 278% gain — meaningful room to come down on a strong offer.
Risks & watch-outs
- Watch-outs: built in 1945 — expect roof / HVAC / electrical / plumbing capex.
- Climate carrying-cost: major wildfire risk — expect insurance premiums to compound above CPI over the hold.
Questions for the listing agent
- Built in 1945 — when were the roof, HVAC, electrical panel, plumbing, and water heater last replaced?
- Is there a deadline driving the sale (1031 exchange, divorce, estate, relocation)? That informs how much negotiation room exists.
- Schools are B-rated — typically a magnet for longer-tenancy family renters. What's the average tenant stay here, and is there a school-zone premium baked into asking?
- Crime grade is F in this area — have there been break-ins, vandalism, or insurance claims at this property in the last 3 years? What carrier currently insures it and at what premium?
- What's the average days-on-market for RENTAL listings here right now (not sales)? A rising rental-DOM trend means longer vacancies and softer asking-rent achievability than the comps imply.
- What's the recent tenant-quality profile in this submarket — average credit score on applications, eviction rate, late-payment / NSF rate, and stable-employment percentage? A property-management company in the area should have these aggregated.
- How much new for-sale + rental construction is in the pipeline within 1–3 miles? Heavy new supply typically softens prices + rents 12–24 months out; constrained supply supports both.
Investment metrics
- 1% rule
- 1.03% ✓
- Cap rate
- 8.11%
- Cash-on-cash
- 6.48%
- DSCR
- 1.29
- GRM
- 8.1
CMA / ARV
- ARV (median comp)
- $185,683
- List price
- $174,000
- Delta
- -6.29%
- Verdict
- FAIR
- Comps
- 3 within 2.0 mi
Projected returns pro-forma
-3.0% appreciation · 4.02% rent growth · sell at horizon
- IRR
- -5.2%
- Equity multiple
- 0.80×
- Total profit
- $-9,596
- Equity at exit
- $25,944
- IRR
- 5.6%
- Equity multiple
- 1.43×
- Total profit
- $20,972
- Equity at exit
- $15,044
Cash invested: $48,720 (down + closing). Projections, not guarantees.
Landlord ↔ Tenant lean methodology
- Overall (STATE)
- 46 Balanced
- State Minnesota
- 46 Balanced · D+2
- County
- — inherits STATE
- City
- — inherits STATE
ZIP-level market 56601
- Home prices YoY
- -26.4%
- Rents YoY
- 4.0%
- Active inventory
- 345
- Price-to-rent
- 8.1×
Monthly cashflow live
- Estimated rent
- $1,791 medium interval (Pro) →
- Mortgage (P&I)
- −$912
- Tax from tax record
- −$167 /mo · $2,006/yr
- Insurance
- −$72
- HOA
- −$0
- Vacancy / Maint / Mgmt
- −$376
- Net cashflow
- $263
Break-even live
Sensitivity live
| Price | -10% $361 | -5% $312 | +0% $263 | +5% $214 | +10% $164 |
|---|---|---|---|---|---|
| Rent | -10% $121 | -5% $192 | +0% $263 | +5% $334 | +10% $404 |
| Rate | -1.0pp $351 | -0.5pp $307 | base $263 | +0.5pp $218 | +1.0pp $172 |
UW: 25.0% down · 7.5% · 30yr · 1.5% tax · 5.0% vac · 8.0% maint · 8.0% mgmt
Financing live
Cash to close
- Down payment
- $43,500
- Closing costs
- $5,220
- Reserves months
- —
- Total cash needed
- —
Loan-product check · same deal, 3 products live
Conventional
25% down · 7.5% · 30yr
- Down + closing
- —
- Monthly P&I
- —
- Monthly cashflow
- —
- DSCR
- —
- Eligible?
- —
Personal DTI + credit; lowest rate.
DSCR
20% down · 8.5% · 30yr
- Down + closing
- —
- Monthly P&I
- —
- Monthly cashflow
- —
- DSCR
- —
- Eligible?
- —
No personal income docs; deal must DSCR.
Hard money
10% down · 12.0% · 12mo
- Down + closing
- —
- Monthly P&I
- —
- Monthly cashflow
- —
- DSCR
- —
- Eligible?
- —
Short-term bridge; refi at stabilization.
Rent comps 1 comps
| Address | Beds | Baths | Sqft | Rent | $/sqft | DOM | Units | Dist |
|---|---|---|---|---|---|---|---|---|
| 1011 Washington Ave S Unit C-02 Bemidji, MN | 3.0 | 1.0 | 900 | $1,200 | $1.33 | 44d | 1 | 0.25mi |
Listing history 11 events
-
2026-05-06historical Contingent - Inspection 280-char remark
-
2026-05-02price $174,000 280-char remark
-
2026-05-02price $168,000 280-char remark
-
2026-04-28$174,000 Active 280-char remark
-
2014-05-01soldstatus $46,000
-
2013-12-14historical
-
2013-06-13$90,000
-
2013-06-11$90,000
-
2011-09-20soldstatus $47,000
-
2011-06-29$54,900
-
2011-06-29$54,900
ⓘ Source: listings_history table (triggers on properties + properties_extension) + one-shot
backfill from property_details.listing_events for pre-trigger history.
Tax reassessment forecast MN · Partial reset (capped growth)
- Current annual tax
- $2,006 · $167/mo
- Projected year-2 tax
- $2,006 · $167/mo
- Expected delta
- $0/yr ($0/mo · 0.0%)
ⓘ Screening estimate from a state-policy table — verify with the county assessor before closing.
Climate risk First Street
- Flood 1/10 Low 0% chance over 30 yrs
- Wildfire 6/10 Major
- Heat 1/10 Low 7 d/yr ≥93°F today · 12 d/yr by 30 yrs out
- Wind 1/10 Low
- Air quality 3/10 Moderate 3 unhealthy d/yr today · 3 by 30 yrs out
Nearby sold comps map
Loading sold comps map…
Walkable amenities ~0.75 mi
Loading nearby amenities…
Taxation est. · year 1
- Rental income
- $21,495
- − Mortgage interest
- −$9,747
- − Property taxes
- −$2,006
- − Insurance
- −$870
- − Repairs & maintenance
- −$1,720
- − Management
- −$1,720
- − Depreciation
- −$5,062
- Taxable income
- $371
- Est. tax owed @ 24.0%
- −$89
- After-tax cash flow
- $3,066/yr
For passive investors: Depreciation is non-cash, so a rental often shows a tax loss while cash-flowing — sheltering income. Rental losses are passive: they offset passive income freely, and up to $25,000/yr can offset ordinary (W-2) income if you actively participate and your MAGI is under $100k (phasing out to $0 by $150k); unused losses carry forward. On sale, claimed depreciation is recaptured at up to 25%, and gains may owe capital-gains tax (a 1031 exchange can defer both). Figures are a year-1 estimate at your 24.0% rate — not tax advice; consult a CPA.
Schools (NCES district)
- District
- Bemidji Public School District
- NCES district ID
- 2704440
- Math proficiency
- 42% ▼ -9.00%
- Reading proficiency
- 50% ▼ -5.00%
- Median HH income
- $47,735
- Composite
- 39.22/100
- National rank
- #4013
- State rank
- #173 of 301 in MN
Livability — Bemidji
- Score
- 73/100
- State rank
- #252
- US rank
- #5416
Category grades
Schools grade is shown separately in the Schools card above.
Census & demographics
- Census place
- Bemidji, MN
- County
- Beltrami County · 34,784 people
- City population
- 34,784
- Metro
- Bemidji, MN
- Population (ZIP)
- 34,784
- Household income
- $72,262
- Rent vs Own
- Severe rent burden
- 940.0
Population outlook (Beltrami County) Hauer SSP2
- Today (2025)
- 46,437 people
- By 2030
- 46,736 · +0.6%
- By 2040
- 46,804 · +0.8%
- By 2050
- 46,299 · -0.3%
- By 2075
- 44,037 · -5.2%
- By 2100
- 38,567 · -16.9%
Race, ethnicity, and origin ACS 2023
- Neighborhood character
- Predominantly White (80%)
- Race & ethnicity
- White 80% Native American 8% Two or more races 7% Hispanic / Latino 3% Black 1%
- Common ancestry
- Portuguese 19% Lithuanian 3% Romanian 2%
- Foreign-born
- 2% · Canada
- Languages at home
- 97% English-only · Spanish 1%
Political lean MEDSL · Beltrami
- 2024 margin
- Lean R (+5.7) · D 46.3% · R 52.0% · Other 1.7%
- 2008→2024 swing
- -15.8pp toward R · 2008: 10.2pp · 2024: -5.7pp
- All cycles
- 2024: R+5.7 2020: R+3.1 2016: R+9.8 2012: D+9.9 2008: D+10.2
Not yet ingested
- Civics
- —
Market trends
- HPI YoY
- ▼ -93.95%
- Current HPI
- 261.5734
- Rent YoY
- ▲ 4.02%
- Metro
- Bemidji, MN
- State GDP YoY
- ▲ 2.41%
- F500 in state
- 34
Industry mix (Fortune 500 HQ in MN)
| Industry | F500 HQs | Revenue |
|---|---|---|
| Healthcare | 2 | $407B |
|
||
| Retail | 2 | $150B |
|
||
| Consumer Goods | 2 | $32B |
|
||
| Industrial Machinery | 2 | $6B |
|
||
| Agriculture | 1 | $40B |
|
||
| Healthcare / Medical Devices | 1 | $32B |
|
||
Price history
+216.9% since first listed12 events — show timeline
- 2026-05-27 Pending — NORTHSTARMLS as Distributed by MLS Grid
- 2026-05-06 Contingent — NORTHSTARMLS as Distributed by MLS Grid
- 2026-05-02 Price Changed $174,000 NORTHSTARMLS as Distributed by MLS Grid
- 2026-05-02 Price Changed $168,000 NORTHSTARMLS as Distributed by MLS Grid
- 2026-04-28 Listed $174,000 NORTHSTARMLS as Distributed by MLS Grid
- 2014-05-01 Sold (Public Records) $46,000 Public Records
- 2013-12-14 Listing Removed — NORTHSTARMLS as Distributed by MLS Grid
- 2013-06-13 Listed $90,000 NORTHSTARMLS as Distributed by MLS Grid
- 2013-06-11 Listed $90,000 NORTHSTARMLS as Distributed by MLS Grid
- 2011-09-20 Sold (MLS) $47,000 NORTHSTARMLS as Distributed by MLS Grid
- 2011-06-29 Listed $54,900 NORTHSTARMLS as Distributed by MLS Grid
- 2011-06-29 Listed $54,900 NORTHSTARMLS as Distributed by MLS Grid
Property tax history
+7.3%/yrLatest (2025): $2,006 · +11.1% YoY. Source: county tax records.
Cash-flow waterfall
monthlySold comps — $/sqft
last 12 mo · ≤1 miLoading sold comps…