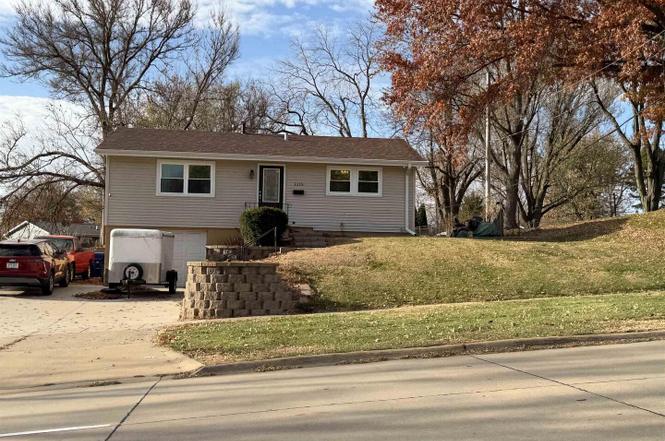
1115 Spruce Hills Dr · Bettendorf, IA
Flood risk 1/10 · Minimal
- FEMA flood zone
- X (unshaded)
- Chance of flooding over 30 yrs
- 0.0%
- Est. flood insurance / yr
- $473 – $860
Fire risk 1/10 · Minimal
- Est. fire insurance / yr
- $902 – $1,676
Heat risk 3/10 · Minor
- Hot days now (above 103°F)
- 7 days/yr
- Hot days in 30 yrs
- 16 days/yr
Wind risk 2/10 · Minimal
- Chance of severe wind over 30 yrs
- —
Air-quality risk 3/10 · Minor
- Unhealthy air days now
- 2 days/yr
- Unhealthy air days in 30 yrs
- 3 days/yr
Risk factors via First Street. Map © Google.
Why this score? — see what drove the C+ grade
The composite is a weighted blend of 9 inputs, each scored 0–100. Each bar is that input's sub-score; the figure is the points it added to the 100-point composite (weight × sub-score).
- Cash flow +17.2/30.0
- ARV discount +15.0/15.0
- Schools +6.5/10.0
- DSCR +5.4/10.0
- Appreciation +5.0/10.0
- 1% rule +4.5/10.0
- Livability +4.0/5.0
- Rent growth +2.5/5.0
- Condition / age +2.5/5.0
$169,900
🖨 Deal sheet 📄 Offer letter ✓ Due diligence
Listing remarks
This well maintained 3-bedroom, 2-bath raised ranch located in Bettendorf. Inside, you'll find a simple yet functional floor plan with an updated kitchen featuring stunning Amish-made custom cabinetry, showcasing exceptional craftsmanship and ample storage. New windows throughout providing peace of mind and improved energy efficiency. A standout feature of this property is the deep attached garage, offering convenient parking plus additional space for storage, tools, or hobby equipment. Outside, another standout feature is the large fenced-in backyard, providing a perfect space for pets, play, gardening, or outdoor entertaining. Whether enjoying quiet evenings or hosting friends, this priva
Key facts
- 0.25 acre lot
- Garage
- Built 1965
Neighborhood map
What this means for you Summary
Snapshot
- This is a 3-bed/2.0-bath single-family listed at $170k.
Deal economics
- At list price, monthly cash flow is $121 ($1k/yr) — positive.
- The deal already cash-flows at list — no discount required.
- To meet the 1% rule (rent ≥ 1% of price), the offer needs to be $162k (4.9% below list).
- Recommended offer: $162k (4.9% below list) — sets the bar for 1% rule.
- Cap rate 7.1% vs local median 3.0% in Bettendorf — top-decile yield for the area; either an underpriced asset or a hidden risk that comps aren't pricing in. Stress-test before assuming the spread holds.
Location & tenants
- Location reads 81/100 on livability (#73 in IA, #1,579 nationally) — a professional / high-income tenant draw. Strengths: crime A+, employment A+, housing A+; Watch: amenities F, commute F.
- Bettendorf Community School District (suburban): math 74% / reading 75% proficiency, ranked #57 of 289 in IA (top 20%) — strong family-tenant draw, lease renewals of 3-5y typical.
- Zoned schools: Bettendorf High School (math 71% / reading 77%, grade B+, #103 of 336 statewide, top 32%, 1,482 students, 31% FRL).
- Market conditions: 1 active listings in the ZIP; 18 comparable units currently listed for rent nearby; rentals at typical pace (median 21d on market — plan ~3-4 weeks tenant-placement turnaround); 805 units permitted in Scott County in 2024 (479 in 5+ unit buildings).
Forward outlook
- In year one you build about $6k of equity ($1k loan paydown + $5k appreciation (3.0% local appreciation)).
- Scott County population projected at +19% by 2050 — long-run rental-demand tailwind backs the buy-and-hold thesis.
- At projected returns (3.0% appreciation + 3.0% rent growth), your $48k cash investment doubles in ~6 years — after that, you're playing with house money.
- By year 6, paydown + projected appreciation supports a ~$33k cash-out refi (75% LTV) — recoverable capital for the next deal without selling this one.
Negotiation context
- Only 0 days on market — expect competitive offers; lowballing is unlikely to land.
- 2 sale attempts with the ask held roughly flat each time — persistent listings suggest the price (not the market) is what's stuck; bring a comps-based counter.
Questions for the listing agent
- Built in 1965 — when were the roof, HVAC, electrical panel, plumbing, and water heater last replaced?
- Is there a deadline driving the sale (1031 exchange, divorce, estate, relocation)? That informs how much negotiation room exists.
- Schools are A-rated — typically a magnet for longer-tenancy family renters. What's the average tenant stay here, and is there a school-zone premium baked into asking?
- What's the average days-on-market for RENTAL listings here right now (not sales)? A rising rental-DOM trend means longer vacancies and softer asking-rent achievability than the comps imply.
- What's the recent tenant-quality profile in this submarket — average credit score on applications, eviction rate, late-payment / NSF rate, and stable-employment percentage? A property-management company in the area should have these aggregated.
- How much new for-sale + rental construction is in the pipeline within 1–3 miles? Heavy new supply typically softens prices + rents 12–24 months out; constrained supply supports both.
Investment metrics
- 1% rule
- 0.95% ✗
- Cap rate
- 7.14%
- Cash-on-cash
- 3.04%
- DSCR
- 1.14
- GRM
- 8.8
CMA / ARV
- ARV (on-the-fly)
- $219,208
- Comps found
- 12
Show comp detail 12 sales within ~0.75 mi
| Address | Dist | Beds/Ba | Sqft | Sold | Price | $/sf | Match |
|---|---|---|---|---|---|---|---|
| 1115 Spruce Hills Dr | 0.00mi | 3/2.0 | 1,262 (+8%) | 5mo | $175,000 | $139 | 82 |
| 2846 Magnolia Dr | 0.19mi | 2/2.0 (-1) | 1,229 (+5%) | 3mo | $162,500 | $132 | 75 |
| 3127 Oxford Dr | 0.61mi | 3/2.5 | 1,160 (-0%) | 8mo | $225,000 | $194 | 62 |
| 2624 Crestview Dr | 0.28mi | 3/1.0 | 1,008 (-14%) | 1mo | $100,000 | $99 | 59 |
| 1509 Golden Valley Dr | 0.30mi | 3/1.0 | 1,040 (-11%) | 6mo | $196,000 | $188 | 59 |
| 3431 Wakonda Dr | 0.43mi | 3/1.5 | 1,092 (-6%) | 11mo | $224,000 | $205 | 58 |
| 2625 Holly Dr | 0.28mi | 4/2.5 (+1) | 1,295 (+11%) | 6mo | $247,000 | $191 | 56 |
| 1101 Hawthorne Dr | 0.48mi | 4/2.0 (+1) | 1,261 (+8%) | 6mo | $223,000 | $177 | 54 |
| 2865 S Hampton Dr | 0.66mi | 4/2.5 (+1) | 1,152 (-1%) | 11mo | $312,000 | $271 | 51 |
| 2506 Holly Dr | 0.37mi | 3/1.0 | 1,034 (-11%) | 10mo | $178,000 | $172 | 51 |
| 3208 Westmar Dr | 0.50mi | 3/2.0 | 1,306 (+12%) | 12mo | $256,000 | $196 | 46 |
| 3110 Somerset Dr | 0.71mi | 3/1.0 | 1,125 (-4%) | 13mo | $212,000 | $188 | 46 |
Match score weights: distance 35% · size 25% · config 20% · recency 20%. Top-matched comps best support the ARV.
Projected returns pro-forma
3.0% appreciation · 3.0% rent growth · sell at horizon
- IRR
- 10.3%
- Equity multiple
- 1.59×
- Total profit
- $28,159
- Equity at exit
- $76,394
- IRR
- 12.6%
- Equity multiple
- 2.88×
- Total profit
- $89,525
- Equity at exit
- $117,733
Cash invested: $47,572 (down + closing). Projections, not guarantees.
Landlord ↔ Tenant lean methodology
- Overall (STATE)
- 83 Strongly Landlord-Friendly
- State Iowa
- 83 Strongly Landlord-Friendly · R+6
- County
- — inherits STATE
- City
- — inherits STATE
ZIP-level market 52722-2334
- Active inventory
- 1
- Price-to-rent
- 8.8×
Monthly cashflow live
- Estimated rent
- $1,615 high interval (Pro) →
- Mortgage (P&I)
- −$891
- Tax from tax record
- −$194 /mo · $2,324/yr
- Insurance
- −$71
- HOA
- −$0
- Vacancy / Maint / Mgmt
- −$339
- Net cashflow
- $121
Break-even live
UW: 25.0% down · 7.5% · 30yr · 1.5% tax · 5.0% vac · 8.0% maint · 8.0% mgmt
Financing live
Cash to close
- Down payment
- $42,475
- Closing costs
- $5,097
- Reserves months
- —
- Total cash needed
- —
Loan-product check · same deal, 3 products live
Conventional
25% down · 7.5% · 30yr
- Down + closing
- —
- Monthly P&I
- —
- Monthly cashflow
- —
- DSCR
- —
- Eligible?
- —
Personal DTI + credit; lowest rate.
DSCR
20% down · 8.5% · 30yr
- Down + closing
- —
- Monthly P&I
- —
- Monthly cashflow
- —
- DSCR
- —
- Eligible?
- —
No personal income docs; deal must DSCR.
Hard money
10% down · 12.0% · 12mo
- Down + closing
- —
- Monthly P&I
- —
- Monthly cashflow
- —
- DSCR
- —
- Eligible?
- —
Short-term bridge; refi at stabilization.
Rent comps 18 comps
| Address | Beds | Baths | Sqft | Rent | $/sqft | DOM | Units | Dist |
|---|---|---|---|---|---|---|---|---|
| 1410 Golden Valley Dr Bettendorf, IA | 3.0 | 1.0 | 1100 | $1,800 | $1.64 | 21d | 1 | 0.22mi |
| 1514 Spruce Hills Dr Bettendorf, IA | 3.0 | 1.0 | 936 | $1,700 | $1.82 | 43d | 1 | 0.25mi |
| 908 Hillside Dr Bettendorf, IA | 3.0 | 1.0 | 924 | $1,650 | $1.79 | 43d | 1 | 0.26mi |
| 913 Hillside Dr Unit 919 Bettendorf, IA | 2.0 | 1.0 | 750 | $995 | $1.33 | 21d | 1 | 0.28mi |
| 2339 Hawthorne Ct Bettendorf, IA | 3.0 | 1.0 | 1375 | $1,695 | $1.23 | 43d | 1 | 0.55mi |
| 3300 E Kimberly Rd Davenport, IA | 1.0–3.0 | 1.0–2.0 | 924 | $1,295 | $1.40 | 13d | 22 | 0.56mi |
| 3129 Windsor Dr Bettendorf, IA | 4.0 | 1.5 | 1440 | $2,500 | $1.74 | 21d | 1 | 0.56mi |
| 2319 Pinehurst St Bettendorf, IA | 3.0 | 1.0 | 825 | $1,800 | $2.18 | 13d | 1 | 0.86mi |
| 1016 Lincoln Rd Bettendorf, IA | 1.0–2.0 | 1.0 | 786 | $925 | $1.18 | 13d | 2 | 1.15mi |
| 2796 Willow Dr Apt 5 Bettendorf, IA | 2.0 | 1.0 | 875 | $995 | $1.14 | 43d | 1 | 1.16mi |
| 730 Lincoln Rd Bettendorf, IA | 2.0 | 1.0 | 984 | $1,300 | $1.32 | 21d | 1 | 1.22mi |
| 3403 Jersey Ridge Rd Davenport, IA | 3.0 | 1.0–1.5 | 750 | $1,050 | $1.40 | 13d | 14 | 1.26mi |
| 2835 Tanglefoot Ln Apt 9 Bettendorf, IA | 2.0 | 1.0 | 880 | $875 | $0.99 | 43d | 1 | 1.26mi |
| 2900 Middle Rd Bettendorf, IA | 1.0–3.0 | 1.0–2.0 | 996 | $1,741 | $1.75 | 13d | 27 | 1.36mi |
| 5101 Lakeview Pkwy Davenport, IA | 3.0–4.0 | 2.5–3.5 | 1800 | $2,370 | $1.32 | 13d | 6 | 1.39mi |
| 1212 16th 1/2 St Bettendorf, IA | 3.0 | 1.0 | 894 | $1,795 | $2.01 | 44d | 1 | 1.45mi |
| 3060 Parkwild Dr Unit 1 Bettendorf, IA | 3.0 | 2.5 | 1500 | $2,100 | $1.40 | 13d | 1 | 1.48mi |
| 1815 Cody St Bettendorf, IA | 3.0 | 2.0 | 1008 | $1,800 | $1.79 | 21d | 1 | 1.48mi |
Listing history 16 events
-
2026-05-24status Pending
-
2026-05-24status Pending
-
2026-05-22status Pending
-
2026-01-26soldstatus $175,000
-
2026-01-09soldstatus $175,000 Closed
-
2026-01-09soldstatus $175,000 Closed
-
2026-01-09soldstatus $175,000 Closed
-
2026-01-09soldstatus $175,000 Closed
-
2025-12-11status Pending
-
2025-12-10historical
-
2025-12-10historical
-
2025-12-08Active
-
2025-12-08$169,900
-
2025-11-17historical
-
2022-01-13historical
-
2021-02-09soldstatus $118,000
ⓘ Source: listings_history table (triggers on properties + properties_extension) + one-shot
backfill from property_details.listing_events for pre-trigger history.
Tax reassessment forecast IA · Partial reset (capped growth)
- Current annual tax
- $2,324 · $194/mo
- Projected year-2 tax
- $2,496 · $208/mo
- Expected delta
- +$172/yr (+$14/mo · 7.4%)
ⓘ Screening estimate from a state-policy table — verify with the county assessor before closing.
Climate risk First Street
- Flood 1/10 Low FEMA zone X (unshaded) · 0% chance over 30 yrs
- Wildfire 1/10 Low
- Heat 3/10 Moderate 7 d/yr ≥103°F today · 16 d/yr by 30 yrs out
- Wind 2/10 Low
- Air quality 3/10 Moderate 2 unhealthy d/yr today · 3 by 30 yrs out
Nearby sold comps map
Loading sold comps map…
Walkable amenities ~0.75 mi
Loading nearby amenities…
Taxation est. · year 1
- Rental income
- $19,382
- − Mortgage interest
- −$9,517
- − Property taxes
- −$2,324
- − Insurance
- −$850
- − Repairs & maintenance
- −$1,551
- − Management
- −$1,551
- − Depreciation
- −$4,943
- Taxable loss
- −$1,352
- Est. tax savings @ 24.0%
- +$324
- After-tax cash flow
- $1,771/yr
For passive investors: Depreciation is non-cash, so a rental often shows a tax loss while cash-flowing — sheltering income. Rental losses are passive: they offset passive income freely, and up to $25,000/yr can offset ordinary (W-2) income if you actively participate and your MAGI is under $100k (phasing out to $0 by $150k); unused losses carry forward. On sale, claimed depreciation is recaptured at up to 25%, and gains may owe capital-gains tax (a 1031 exchange can defer both). Figures are a year-1 estimate at your 24.0% rate — not tax advice; consult a CPA.
Schools (NCES district)
- District
- Bettendorf Community School District
- NCES district ID
- 1904860
- Math proficiency
- 74% ▼ -6.00%
- Reading proficiency
- 75% ▼ -2.00%
- Median HH income
- $66,823
- Composite
- 64.71/100
- National rank
- #522
- State rank
- #57 of 289 in IA
Livability — Bettendorf
- Score
- 81/100
- State rank
- #73
- US rank
- #1579
Category grades
Schools grade is shown separately in the Schools card above.
Census & demographics
- Census place
- Bettendorf, IA
Population outlook (Scott County) Hauer SSP2
- Today (2025)
- 188,878 people
- By 2030
- 196,648 · +4.1%
- By 2040
- 210,860 · +11.6%
- By 2050
- 224,359 · +18.8%
- By 2075
- 258,884 · +37.1%
- By 2100
- 286,447 · +51.7%
Not yet ingested
- Political lean
- —
- Race & ethnicity
- —
- Common origin
- —
- Civics
- —
Market trends
- HPI YoY
- —
- Current HPI
- —
- Rent YoY
- —
- Metro
- —
- State GDP YoY
- ▲ 2.48%
- F500 in state
- 4
Industry mix (Fortune 500 HQ in IA)
| Industry | F500 HQs | Revenue |
|---|---|---|
| Financial Services | 1 | $16B |
|
||
| Retail / Convenience | 1 | $15B |
|
||
Price history
+48.3% since first listed16 events — show timeline
- 2026-05-24 Pending — MRED as Distributed by MLS Grid
- 2026-05-24 Pending — MRED as Distributed by MLS Grid
- 2026-05-22 Pending — MRED as Distributed by MLS Grid
- 2026-01-26 Sold (Public Records) $175,000 Public Records
- 2026-01-09 Sold (MLS) $175,000 MRED as Distributed by MLS Grid
- 2026-01-09 Sold (MLS) $175,000 MRED as Distributed by MLS Grid
- 2026-01-09 Sold (MLS) $175,000 MRED as Distributed by MLS Grid
- 2026-01-09 Sold (MLS) $175,000 MRED as Distributed by MLS Grid
- 2025-12-11 Pending — RMLSA as Distributed by MLS Grid
- 2025-12-10 Listing Removed — RMLSA as Distributed by MLS Grid
- 2025-12-10 Listing Removed — MRED as Distributed by MLS Grid
- 2025-12-08 Listed — RMLSA as Distributed by MLS Grid
- 2025-12-08 Listed $169,900 MRED as Distributed by MLS Grid
- 2025-11-17 Coming Soon — RMLSA as Distributed by MLS Grid
- 2022-01-13 Listing Removed — RMLSA as Distributed by MLS Grid
- 2021-02-09 Sold (Public Records) $118,000 Public Records
Property tax history
+2.8%/yrLatest (2025): $2,324 · +0.8% YoY. Source: county tax records.
Cash-flow waterfall
monthlySold comps — $/sqft
last 12 mo · ≤1 miLoading sold comps…