969 Silent Barge Cv #267 · Aiken, SC
Flood risk No data
- FEMA flood zone
- —
- Chance of flooding over 30 yrs
- —
- Est. flood insurance / yr
- —
Fire risk No data
- Est. fire insurance / yr
- —
Heat risk No data
- Hot days now (above threshold)
- —
- Hot days in 30 yrs
- —
Wind risk No data
- Chance of severe wind over 30 yrs
- —
Air-quality risk No data
- Unhealthy air days now
- —
- Unhealthy air days in 30 yrs
- —
Risk factors via First Street. Map © Google.
Why this score? — see what drove the D- grade
The composite is a weighted blend of 9 inputs, each scored 0–100. Each bar is that input's sub-score; the figure is the points it added to the 100-point composite (weight × sub-score).
- Cash flow +11.0/30.0
- ARV discount +8.0/15.0
- Condition / age +4.0/5.0
- Rent growth +3.8/5.0
- Livability +3.4/5.0
- 1% rule +3.2/10.0
- DSCR +3.2/10.0
- Schools +3.2/10.0
- Appreciation +0.0/10.0
$260,790
🖨 Deal sheet 📄 Offer letter ✓ Due diligence
Listing remarks
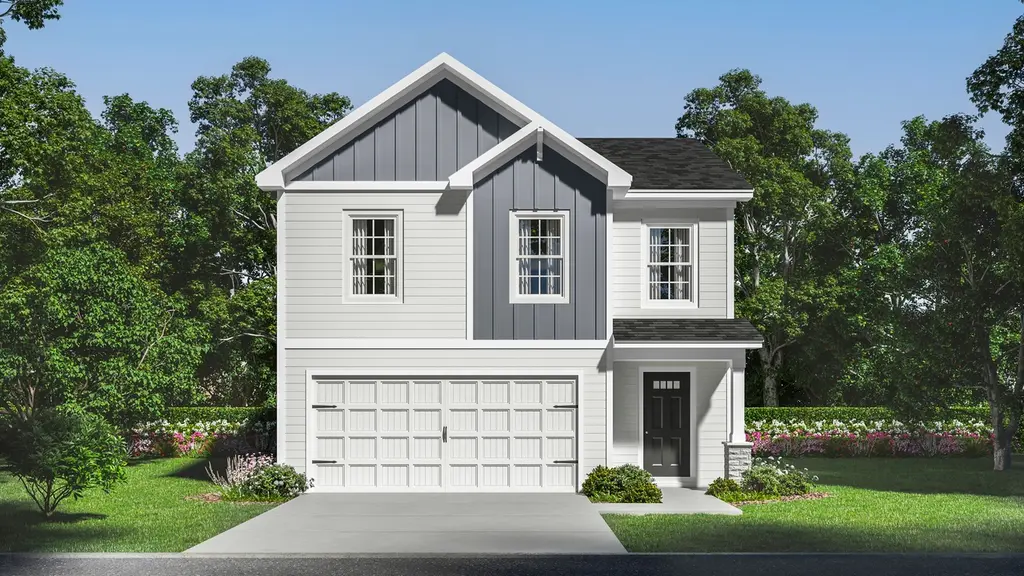
Move-In Ready! Step inside the Cedar and you'll find 4 bedrooms, 2.5 bathrooms, and 1,783 square feet of beautifully designed space that makes everyday living feel easy. From the foyer, the home opens up into the main living area where the great room flows directly into the kitchen and dining space. The kitchen features a large island that's perfect for quick meals, meal prep, or gathering with others throughout the day, along with a corner pantry that keeps everything organized and within reach. Just off the dining area, step outside to the patio-perfect for grilling, enjoying fresh air, or relaxing after a long day. Upstairs, the primary bedroom is tucked away for privacy and includes a s
Key facts
- Walk-in closet
- Corner pantry
- Large island
Tags
Property features AI
Finance
- Other: Located at 969 Silent Barge Cv #267, Aiken, SC 29801; Plan name: Cedar B; Inventory type: Spec
- Financial info: List price $260,790
Exterior
- Parking: 2 total parking spaces; 2-car garage
- Home design: Single-family residence (Cedar B plan); Active listing
Interior
- Bedrooms: 4 bedrooms
- Bathrooms: 2 full bathrooms and 1 half bathroom (2.5 total)
- Interior features: Spec home (Cedar B plan); Living area approx. 1,783
Neighborhood map
What this means for you Summary
Snapshot
- This is a 4-bed/2.5-bath single-family listed at $261k. Condition is rated good.
Deal economics
- At list price, monthly cash flow is $-111 ($-1k/yr) — negative.
- To cash-flow at today's rent, offer at most $245k (6.2% below list).
- To meet the 1% rule (rent ≥ 1% of price), the offer needs to be $214k (17.9% below list).
- Recommended offer: $214k (17.9% below list) — sets the bar for 1% rule.
- Cap rate 5.8% vs local median 4.1% in Aiken — top-decile yield for the area; either an underpriced asset or a hidden risk that comps aren't pricing in. Stress-test before assuming the spread holds.
Location & tenants
- Location reads 67/100 on livability (#93 in SC) — a middle-class / working-renter tenant base. Strengths: housing A+, health & safety A+, cost of living A; Watch: crime F, commute F.
- Aiken 01 (suburban): math 31% / reading 44% proficiency, ranked #36 of 80 in SC (top 45%) — families likely to look elsewhere, expect single-tenant / working-renter base with shorter leases.
- Market conditions: Rents rising fast (+5.1%/yr); 521 active listings in the ZIP; 7 comparable units currently listed for rent nearby; rentals leasing fast (median 14d on market — plan ~1-2 weeks tenant-placement turnaround); 2,500 units permitted in Aiken County in 2024 (1,023 in 5+ unit buildings).
- This rent runs 43% of the median local income ($60k/yr) — at the standard rent-burdened threshold; future hikes will face affordability resistance.
Forward outlook
- Local home prices are declining (-3.0%/yr); year-one equity from $2k of loan paydown is wiped out by about $8k of value loss. Plan a longer hold.
- Aiken County population projected at +9% by 2050 — modest demand growth; plan on rents tracking national, not racing it.
Negotiation context
- It's been on market 84 days — a 6% lower offer ($245k) is reasonable based on typical stale-listing flexibility.
Questions for the listing agent
- What do current leases actually rent for vs. the listed asking? Can we see a recent rent roll and the last 12 months of T-12 income?
- It's been on market 84 days. Have you received any prior offers? Is the seller open to a 18% concession, seller financing, or rate buy-down credit?
- Why hasn't it sold? Are there any deal-killer items the seller is aware of (foundation, flood, title, zoning, code violations)?
- Is there a deadline driving the sale (1031 exchange, divorce, estate, relocation)? That informs how much negotiation room exists.
- Schools are B-rated — typically a magnet for longer-tenancy family renters. What's the average tenant stay here, and is there a school-zone premium baked into asking?
- Crime grade is F in this area — have there been break-ins, vandalism, or insurance claims at this property in the last 3 years? What carrier currently insures it and at what premium?
- The area grade is low — what's the realistic commute time and amenity access for the typical tenant pool here? Any planned neighborhood developments (good or bad) we should know about?
- What's the average days-on-market for RENTAL listings here right now (not sales)? A rising rental-DOM trend means longer vacancies and softer asking-rent achievability than the comps imply.
- What's the recent tenant-quality profile in this submarket — average credit score on applications, eviction rate, late-payment / NSF rate, and stable-employment percentage? A property-management company in the area should have these aggregated.
- How much new for-sale + rental construction is in the pipeline within 1–3 miles? Heavy new supply typically softens prices + rents 12–24 months out; constrained supply supports both.
Investment metrics
- 1% rule
- 0.82% ✗
- Cap rate
- 5.78%
- Cash-on-cash
- -1.82%
- DSCR
- 0.92
- GRM
- 10.2
CMA / ARV
- ARV (on-the-fly)
- $263,884
- Comps found
- 12
Show comp detail 12 sales within ~0.75 mi
| Address | Dist | Beds/Ba | Sqft | Sold | Price | $/sf | Match |
|---|---|---|---|---|---|---|---|
| 962 Silent Barge Cove Cv | 0.03mi | 3/2.5 (-1) | 1,649 (-8%) | 4mo | $252,000 | $153 | 78 |
| 471 Narrow Bridge Ct | 0.07mi | 4/2.5 | 1,894 (+6%) | 14mo | $283,100 | $149 | 75 |
| 7136 Foggy River Dr | 0.13mi | 4/2.5 | 1,967 (+10%) | 6mo | $274,400 | $140 | 72 |
| 7092 Foggy River Dr | 0.12mi | 4/2.5 | 1,923 (+8%) | 18mo | $284,990 | $148 | 67 |
| 7033 Mongolian Oak Dr NW | 0.44mi | 3/2.5 (-1) | 1,823 (+2%) | 11mo | $280,000 | $154 | 62 |
| 5125 Needle Palm Rd NW | 0.48mi | 3/2.5 (-1) | 1,795 (+1%) | 15mo | $264,900 | $148 | 59 |
| 246 NW Shingle Oak Garden Gdn | 0.60mi | 4/2.0 | 1,852 (+4%) | 7mo | $274,990 | $148 | 58 |
| 9222 Wafer Ash Bnd NW | 0.54mi | 4/2.5 | 1,889 (+6%) | 11mo | $284,900 | $151 | 56 |
| 9039 NW Wafer Ash Bnd | 0.52mi | 4/2.0 | 1,852 (+4%) | 16mo | $269,990 | $146 | 54 |
| 234 NW Shingle Oak Garden Gdn | 0.58mi | 4/3.0 | 1,998 (+12%) | 9mo | $289,990 | $145 | 43 |
| 5113 Needle Palm Rd NW | 0.47mi | 3/2.0 (-1) | 1,622 (-9%) | 16mo | $262,900 | $162 | 43 |
| 9111 NW Wafer Ash Bnd | 0.56mi | 4/3.0 | 1,998 (+12%) | 11mo | $289,990 | $145 | 42 |
Match score weights: distance 35% · size 25% · config 20% · recency 20%. Top-matched comps best support the ARV.
Projected returns pro-forma
-3.0% appreciation · 5.06% rent growth · sell at horizon
- IRR
- -17.0%
- Equity multiple
- 0.39×
- Total profit
- $-44,761
- Equity at exit
- $38,885
- IRR
- -5.5%
- Equity multiple
- 0.61×
- Total profit
- $-28,558
- Equity at exit
- $22,548
Cash invested: $73,021 (down + closing). Projections, not guarantees.
Landlord ↔ Tenant lean methodology
- Overall (STATE)
- 90 Strongly Landlord-Friendly
- State South Carolina
- 90 Strongly Landlord-Friendly · R+6
- County
- — inherits STATE
- City
- — inherits STATE
ZIP-level market 29801
- Rents YoY
- 5.1%
- Active inventory
- 521
- Price-to-rent
- 10.2×
Monthly cashflow live
- Estimated rent
- $2,141 high interval (Pro) →
- Mortgage (P&I)
- −$1,368
- Tax est. 1.5%
- −$326 /mo · $3,912/yr
- Insurance
- −$109
- HOA
- −$0
- Vacancy / Maint / Mgmt
- −$450
- Net cashflow
- $-111
Break-even live
UW: 25.0% down · 7.5% · 30yr · 1.5% tax · 5.0% vac · 8.0% maint · 8.0% mgmt
Financing live
Cash to close
- Down payment
- $65,198
- Closing costs
- $7,824
- Reserves months
- —
- Total cash needed
- —
Loan-product check · same deal, 3 products live
Conventional
25% down · 7.5% · 30yr
- Down + closing
- —
- Monthly P&I
- —
- Monthly cashflow
- —
- DSCR
- —
- Eligible?
- —
Personal DTI + credit; lowest rate.
DSCR
20% down · 8.5% · 30yr
- Down + closing
- —
- Monthly P&I
- —
- Monthly cashflow
- —
- DSCR
- —
- Eligible?
- —
No personal income docs; deal must DSCR.
Hard money
10% down · 12.0% · 12mo
- Down + closing
- —
- Monthly P&I
- —
- Monthly cashflow
- —
- DSCR
- —
- Eligible?
- —
Short-term bridge; refi at stabilization.
Rent comps 7 comps
| Address | Beds | Baths | Sqft | Rent | $/sqft | DOM | Units | Dist |
|---|---|---|---|---|---|---|---|---|
| 7113 Foggy River Dr Aiken, SC | 4.0 | 2.5 | 2172 | $2,035 | $0.94 | 23d | 1 | 0.09mi |
| 7034 Foggy River Dr Aiken, SC | 5.0 | 2.0 | 2459 | $2,375 | $0.97 | 23d | 1 | 0.09mi |
| 844 Silent Barge Cv Aiken, SC | 4.0 | 2.5 | 1763 | $1,899 | $1.08 | 23d | 1 | 0.09mi |
| 7273 Foggy River Dr Aiken, SC | 3.0 | 2.0 | 1923 | $2,035 | $1.06 | 13d | 1 | 0.12mi |
| 7259 Foggy River Dr Aiken, SC | 4.0 | 2.0 | 2157 | $2,045 | $0.95 | 13d | 1 | 0.13mi |
| 221 Grand Oaks Way Aiken, SC | 3.0 | 2.0 | 1822 | $1,980 | $1.09 | 13d | 1 | 0.63mi |
| 755 Teague St NW Aiken, SC | 4.0 | 2.0 | 2000 | $2,200 | $1.10 | 13d | 1 | 1.37mi |
Listing history 13 events
-
2026-06-18days on market $260,790 Active 84 DOM
-
2026-06-17days on market $260,790 Active 83 DOM
-
2026-06-16days on market $260,790 Active 82 DOM
-
2026-06-15days on market $260,790 Active 81 DOM
-
2026-06-14days on market $260,790 Active 79 DOM
-
2026-06-09days on market $260,790 Active 78 DOM
-
2026-06-08days on market $260,790 Active 77 DOM
-
2026-06-07days on market $260,790 Active 76 DOM
-
2026-06-03days on market $260,790 Active 72 DOM
-
2026-06-02days on market $260,790 Active 71 DOM
-
2026-06-01days on market $260,790 Active 70 DOM
-
2026-05-31days on market $260,790 Active 69 DOM
-
2026-05-30days on market $260,790 Active 68 DOM
ⓘ Source: listings_history table (triggers on properties + properties_extension) + one-shot
backfill from property_details.listing_events for pre-trigger history.
Nearby sold comps map
Loading sold comps map…
Walkable amenities ~0.75 mi
Loading nearby amenities…
Taxation est. · year 1
- Rental income
- $25,692
- − Mortgage interest
- −$14,608
- − Property taxes
- −$3,912
- − Insurance
- −$1,304
- − Repairs & maintenance
- −$2,055
- − Management
- −$2,055
- − Depreciation
- −$7,587
- Taxable loss
- −$5,830
- Est. tax savings @ 24.0%
- +$1,399
- After-tax cash flow
- $68/yr
For passive investors: Depreciation is non-cash, so a rental often shows a tax loss while cash-flowing — sheltering income. Rental losses are passive: they offset passive income freely, and up to $25,000/yr can offset ordinary (W-2) income if you actively participate and your MAGI is under $100k (phasing out to $0 by $150k); unused losses carry forward. On sale, claimed depreciation is recaptured at up to 25%, and gains may owe capital-gains tax (a 1031 exchange can defer both). Figures are a year-1 estimate at your 24.0% rate — not tax advice; consult a CPA.
Condition & rehab AI · 6 photos
This move-in ready home features a modern kitchen, well-maintained exterior, and fresh interior paint, making it an attractive option for both resale and rental.
Value-add opportunities
- Both Painting exterior and interior walls — Fresh paint enhances curb appeal and interior aesthetics
- Both Landscaping improvements — Enhances curb appeal and adds value
- Resale Kitchen appliances — Modern appliances improve functionality and appeal to potential buyers
Renovation cost estimate screening
Value-add ROI direction
- Both Painting exterior and interior walls — Fresh paint enhances curb appeal and interior aesthetics ↑
- Both Landscaping improvements — Enhances curb appeal and adds value ↑
- Resale Kitchen appliances — Modern appliances improve functionality and appeal to potential buyers ↑
ⓘ Cost ranges are severity-bucket heuristics (US national rule-of-thumb). Get contractor quotes + a written scope before underwriting a rehab budget.
Schools (NCES district)
- District
- Aiken 01
- NCES district ID
- 4500720
- Math proficiency
- 31% ▼ -11.00%
- Reading proficiency
- 44% ▼ -1.00%
- Median HH income
- $45,081
- Composite
- 31.91/100
- National rank
- #5857
- State rank
- #36 of 80 in SC
Livability — Aiken
- Score
- 67/100
- State rank
- #93
- US rank
- #10443
Category grades
Schools grade is shown separately in the Schools card above.
Census & demographics
- County
- Aiken County · 116,534 people
- City population
- 71,807
- Metro
- Augusta-Richmond County, GA-SC
- Population (ZIP)
- 31,108
- Household income
- $59,573
- Rent vs Own
- Severe rent burden
- 1260.0
Population outlook (Aiken County) Hauer SSP2
- Today (2025)
- 178,003 people
- By 2030
- 182,876 · +2.7%
- By 2040
- 189,970 · +6.7%
- By 2050
- 193,840 · +8.9%
- By 2075
- 199,453 · +12.1%
- By 2100
- 192,403 · +8.1%
Race, ethnicity, and origin ACS 2023
- Neighborhood character
- Diverse neighborhood (Simpson 0.57)
- Race & ethnicity
- White 50% Black 42% Hispanic / Latino 5% Two or more races 4% Asian 1%
- Hispanic origin (detail)
- Mexican 1% Puerto Rican 2%
- Common ancestry
- Slovak 2% Italian 1% Serbian 1%
- Foreign-born
- 3% · Canada, Jamaica
- Languages at home
- 95% English-only · Spanish 3% Other Indo-European 1%
Political lean MEDSL · Aiken
- 2024 margin
- Strong R (+25.9) · D 36.4% · R 62.2% · Other 1.4%
- 2008→2024 swing
- -1.9pp toward R · 2008: -24.0pp · 2024: -25.9pp
- All cycles
- 2024: R+25.9 2020: R+22.7 2016: R+27.5 2012: R+26.0 2008: R+24.0
Not yet ingested
- Civics
- —
Market trends
- HPI YoY
- ▼ -278.52%
- Current HPI
- 173.7944
- Rent YoY
- ▲ 5.06%
- Metro
- Augusta-Richmond County, GA-SC
- State GDP YoY
- ▲ 4.51%
- F500 in state
- 2
Industry mix (Fortune 500 HQ in SC)
| Industry | F500 HQs | Revenue |
|---|---|---|
| Packaging | 1 | $7B |
|
||
Cash-flow waterfall
monthlySold comps — $/sqft
last 12 mo · ≤1 miLoading sold comps…