274 Higuera St #17 · San Luis Obispo, CA
Flood risk 6/10 · Moderate
- FEMA flood zone
- AE
- Chance of flooding over 30 yrs
- 0.66%
- Est. flood insurance / yr
- $1,737 – $8,500
Fire risk 6/10 · Moderate
- Est. fire insurance / yr
- $659 – $1,223
Heat risk 4/10 · Minor
- Hot days now (above 82°F)
- 7 days/yr
- Hot days in 30 yrs
- 18 days/yr
Wind risk 1/10 · Minimal
- Chance of severe wind over 30 yrs
- —
Air-quality risk 6/10 · Moderate
- Unhealthy air days now
- 11 days/yr
- Unhealthy air days in 30 yrs
- 11 days/yr
Risk factors via First Street. Map © Google.
Why this score? — see what drove the B- grade
The composite is a weighted blend of 9 inputs, each scored 0–100. Each bar is that input's sub-score; the figure is the points it added to the 100-point composite (weight × sub-score).
- Cash flow +30.0/30.0
- 1% rule +10.0/10.0
- DSCR +10.0/10.0
- Schools +4.6/10.0
- Condition / age +4.0/5.0
- Livability +3.7/5.0
- Rent growth +3.6/5.0
- ARV discount +0.0/15.0
- Appreciation +0.0/10.0
$164,000
🖨 Deal sheet (PDF) 📄 Offer letter ✓ Due diligence
Listing remarks MLS
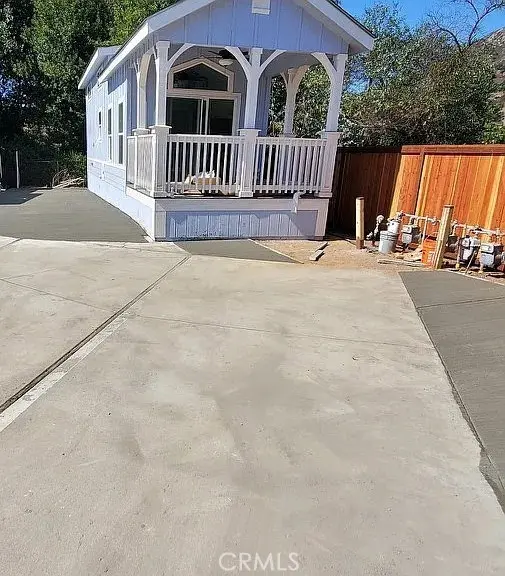
400 + 200 square feet, 1 bedroom + loft, 1 bath, lots of closets, vaulted ceilings, large covered porch, side porch to large fenced-in backyard, shed, driveway, gates, 3 parking spots, washer/dryer, dishwasher, AC, forced-air heater, farmhouse sink. Rent Space $1096.99. Square footage includes 200 sqft loft.
Key facts
- Large covered porch
- Farmhouse sink
- Side porch
Tags
Neighborhood map
What this means for you Summary
Snapshot
- This is a 1-bed/1.0-bath manufactured listed at $164k. Condition is rated good.
Deal economics
- At list price, monthly cash flow is $377 ($5k/yr) — positive.
- The deal already cash-flows at list — no discount required.
- Meets the 1% rule at list price ($2k rent vs $164k).
- Recommended offer: $144k (12.0% below list) — sets the bar for market timing.
- Cap rate 12.2% vs local median 2.1% in San Luis Obispo — top-decile yield for the area; either an underpriced asset or a hidden risk that comps aren't pricing in. Stress-test before assuming the spread holds.
Location & tenants
- Location reads 74/100 on livability (#132 in CA, #4,576 nationally) — a middle-class / working-renter tenant base. Strengths: amenities A+, commute A+, health & safety A+; Watch: crime F, cost of living F.
- San Luis Coastal Unified (urban): math 50% / reading 58% proficiency, ranked #118 of 517 in CA (top 23%) — acceptable for families but not a draw, mixed tenant base, ~2y average lease.
- Zoned schools: Pacheco Elementary (math 34% / reading 41%, grade F, #667 of 1,571 statewide, top 43%, 482 students, 36% FRL); Laguna Middle (math 57% / reading 65%, grade B+, #57 of 498 statewide, top 12%, 789 students, 30% FRL); San Luis Obispo High (math 47% / reading 67%, grade C, #234 of 1,170 statewide, top 21%, 1,644 students, 27% FRL) — zoned schools at 31% FRL track the district average.
- Market conditions: Rents rising fast (+4.4%/yr); 140 active listings in the ZIP; 17 comparable units currently listed for rent nearby; rentals at typical pace (median 23d on market — plan ~3-4 weeks tenant-placement turnaround); 47% of comp listings sitting > 30 days — soft ceiling on asking rent; solid renter incomes; 1,104 units permitted in San Luis Obispo County in 2024 (273 in 5+ unit buildings).
- This rent runs 30% of the median local income ($97k/yr) — at the standard rent-burdened threshold; future hikes will face affordability resistance.
Forward outlook
- Local home prices are declining (-3.0%/yr); year-one equity from $1k of loan paydown is wiped out by about $5k of value loss. Plan a longer hold.
- San Luis Obispo County population projected at +20% by 2050 — long-run rental-demand tailwind backs the buy-and-hold thesis.
- At projected returns (-3.0% appreciation + 4.4% rent growth), your $46k cash investment doubles in ~9 years — after that, you're playing with house money.
Negotiation context
- It's been on market 121 days — a 12% lower offer ($144k) is reasonable based on typical stale-listing flexibility.
- 3 sale attempts with the ask held roughly flat each time — persistent listings suggest the price (not the market) is what's stuck; bring a comps-based counter.
Risks & watch-outs
- Watch-outs: flood insurance adds $427/mo.
- Climate carrying-cost: in FEMA flood zone AE (mandatory federal flood insurance); major wildfire risk — expect insurance premiums to compound above CPI over the hold.
Questions for the listing agent
- It's been on market 121 days. Have you received any prior offers? Is the seller open to a 12% concession, seller financing, or rate buy-down credit?
- What's the actual annual flood-insurance premium (NFIP or private), and is the property in a SFHA with mandatory coverage?
- Why hasn't it sold? Are there any deal-killer items the seller is aware of (foundation, flood, title, zoning, code violations)?
- Is there a deadline driving the sale (1031 exchange, divorce, estate, relocation)? That informs how much negotiation room exists.
- Schools are B-rated — typically a magnet for longer-tenancy family renters. What's the average tenant stay here, and is there a school-zone premium baked into asking?
- Crime grade is F in this area — have there been break-ins, vandalism, or insurance claims at this property in the last 3 years? What carrier currently insures it and at what premium?
- What's the average days-on-market for RENTAL listings here right now (not sales)? A rising rental-DOM trend means longer vacancies and softer asking-rent achievability than the comps imply.
- What's the recent tenant-quality profile in this submarket — average credit score on applications, eviction rate, late-payment / NSF rate, and stable-employment percentage? A property-management company in the area should have these aggregated.
- How much new for-sale + rental construction is in the pipeline within 1–3 miles? Heavy new supply typically softens prices + rents 12–24 months out; constrained supply supports both.
Investment metrics
- 1% rule
- 1.50% ✓
- Cap rate
- 12.17%
- Cash-on-cash
- 21.00%
- DSCR
- 1.93
- GRM
- 5.6
CMA / ARV
- ARV (median comp)
- $127,913
- List price
- $164,000
- Delta
- 28.21%
- Verdict
- OVERPRICED
- Comps
- 3 within 1.0 mi
Show comp detail 4 sales within ~0.75 mi
| Address | Dist | Beds/Ba | Sqft | Sold | Price | $/sf | Match |
|---|---|---|---|---|---|---|---|
| 145 South St Unit A08 | 0.26mi | 2/1.0 (+1) | 616 (+3%) | 12mo | $180,000 | $292 | 68 |
| 145 South Unit A55 | 0.26mi | 2/1.0 (+1) | 540 (-10%) | 0mo | $125,000 | $231 | 66 |
| 145 south St Unit A10 | 0.26mi | 2/1.0 (+1) | 520 (-13%) | 11mo | $129,900 | $250 | 52 |
| 145 South Street, spc A50 E Unit A 50 | 0.26mi | 2/1.0 (+1) | 540 (-10%) | 22mo | $171,000 | $317 | 48 |
Match score weights: distance 35% · size 25% · config 20% · recency 20%. Top-matched comps best support the ARV.
Projected returns pro-forma
-3.0% appreciation · 4.41% rent growth · sell at horizon
- IRR
- 0.7%
- Equity multiple
- 1.03×
- Total profit
- $1,264
- Equity at exit
- $24,453
- IRR
- 12.2%
- Equity multiple
- 2.05×
- Total profit
- $48,131
- Equity at exit
- $14,180
Cash invested: $45,920 (down + closing). Projections, not guarantees.
Landlord ↔ Tenant lean methodology
- Overall (STATE)
- 18 Strongly Tenant-Friendly
- State California
- 18 Strongly Tenant-Friendly · D+13
- County
- — inherits STATE
- City
- — inherits STATE
ZIP-level market 93401
- Rents YoY
- 4.4%
- Active inventory
- 140
- Price-to-rent
- 5.6×
Monthly cashflow live
- Estimated rent
- $2,452 high interval (Pro) →
- Mortgage (P&I)
- −$860
- Tax est. 1.5%
- −$205 /mo · $2,460/yr
- Insurance
- −$68
- Flood insurance flood zone
- −$427 /mo · $5,118/yr
- HOA
- −$0
- Vacancy / Maint / Mgmt
- −$515
- Net cashflow
- $377
Break-even live
Sensitivity live
| Price | -10% $490 | -5% $434 | +0% $377 | +5% $320 | +10% $264 |
|---|---|---|---|---|---|
| Rent | -10% $183 | -5% $280 | +0% $377 | +5% $474 | +10% $571 |
| Rate | -1.0pp $460 | -0.5pp $419 | base $377 | +0.5pp $335 | +1.0pp $291 |
UW: 25.0% down · 7.5% · 30yr · 1.5% tax · 5.0% vac · 8.0% maint · 8.0% mgmt
Financing live
Cash to close
- Down payment
- $41,000
- Closing costs
- $4,920
- Reserves months
- —
- Total cash needed
- —
Loan-product check · same deal, 3 products live
Conventional
25% down · 7.5% · 30yr
- Down + closing
- —
- Monthly P&I
- —
- Monthly cashflow
- —
- DSCR
- —
- Eligible?
- —
Personal DTI + credit; lowest rate.
DSCR
20% down · 8.5% · 30yr
- Down + closing
- —
- Monthly P&I
- —
- Monthly cashflow
- —
- DSCR
- —
- Eligible?
- —
No personal income docs; deal must DSCR.
Hard money
10% down · 12.0% · 12mo
- Down + closing
- —
- Monthly P&I
- —
- Monthly cashflow
- —
- DSCR
- —
- Eligible?
- —
Short-term bridge; refi at stabilization.
Rent comps 17 comps
| Address | Beds | Baths | Sqft | Rent | $/sqft | DOM | Units | Dist |
|---|---|---|---|---|---|---|---|---|
| 331 Pismo St Unit C San Luis Obispo, CA | — | 1.0 | 650 | $2,200 | $3.38 | 22d | 1 | 0.17mi |
| 544 Pacific St Apt 108 San Luis Obispo, CA | 1.0 | 1.0 | 585 | $1,975 | $3.38 | 45d | 1 | 0.38mi |
| 564 Higuera St San Luis Obispo, CA | 1.0 | 1.0 | 615 | $2,775 | $4.51 | 15d | 4 | 0.43mi |
| 522 Dana St San Luis Obispo, CA | 2.0–3.0 | 1.0–2.0 | 875 | $2,850 | $3.26 | 15d | 3 | 0.46mi |
| 1427 Morro St Unit B San Luis Obispo, CA | 1.0 | 1.0 | 400 | $2,600 | $6.50 | 45d | 1 | 0.71mi |
| 2200 Emily St San Luis Obispo, CA | — | 1.0 | 528 | $2,062 | $3.90 | 15d | 2 | 0.86mi |
| 1707 Santa Rosa St San Luis Obispo, CA | — | 1.0 | 350 | $1,850 | $5.29 | 45d | 1 | 0.89mi |
| 835 Madonna Rd San Luis Obispo, CA | — | 1.0 | 407 | $2,050 | $5.04 | 15d | 1 | 1.08mi |
| 1245 Peach St Unit B San Luis Obispo, CA | 2.0 | 1.0 | 700 | $2,800 | $4.00 | 45d | 1 | 1.14mi |
| 1314 Palm St San Luis Obispo, CA | 1.0 | 1.0 | 695 | $2,600 | $3.74 | 22d | 1 | 1.16mi |
| 2800 Broad St San Luis Obispo, CA | 1.0 | 1.0 | 464 | $2,500 | $5.39 | 45d | 1 | 1.17mi |
| 685 Stoneridge Dr Unit A San Luis Obispo, CA | — | 1.0 | 580 | $2,300 | $3.97 | 15d | 1 | 1.17mi |
| 3150 Rockview Pl #8 San Luis Obispo, CA | 1.0 | 1.0 | 600 | $2,475 | $4.12 | 45d | 1 | 1.31mi |
| 1247 Murray Ave Unit 1 San Luis Obispo, CA | 1.0 | 1.0 | 585 | $2,500 | $4.27 | 45d | 1 | 1.34mi |
| 1247 Murray Ave Unit 4 San Luis Obispo, CA | 1.0 | 1.0 | 585 | $2,650 | $4.53 | 45d | 1 | 1.34mi |
| 1290 Murray Ave San Luis Obispo, CA | 1.0 | 1.0 | 750 | $2,100 | $2.80 | 22d | 1 | 1.41mi |
| 791 Orcutt Rd San Luis Obispo, CA | 1.0 | 1.0 | 651 | $2,750 | $4.22 | 22d | 3 | 1.45mi |
Listing history 22 events
-
2026-06-21days on market $164,000 Active 121 DOM
-
2026-06-18days on market $164,000 Active 118 DOM
-
2026-06-17days on market $164,000 Active 117 DOM
-
2026-06-16days on market $164,000 Active 116 DOM
-
2026-06-15days on market $164,000 Active 115 DOM
-
2026-06-14days on market $164,000 Active 113 DOM
-
2026-06-13days on market $164,000 Active 112 DOM
-
2026-06-10days on market $164,000 Active 110 DOM
-
2026-06-09days on market $164,000 Active 109 DOM
-
2026-06-08days on market $164,000 Active 108 DOM
-
2026-06-07days on market $164,000 Active 107 DOM
-
2026-06-03days on market $164,000 Active 103 DOM
-
2026-06-02days on market $164,000 Active 102 DOM
-
2026-06-01days on market $164,000 Active 101 DOM
-
2026-05-31days on market $164,000 Active 100 DOM
-
2026-05-30days on market $164,000 Active 99 DOM
-
2026-02-20$164,000 Active 309-char remark
Show marketing remark (309 chars)
400 + 200 square feet, 1 bedroom + loft, 1 bath, lots of closets, vaulted ceilings, large covered porch, side porch to large fenced-in backyard, shed, driveway, gates, 3 parking spots, washer/dryer, dishwasher, AC, forced-air heater, farmhouse sink. Rent Space $1096.99. Square footage includes 200 sqft loft.
-
2026-01-31historical
-
2025-10-25price $164,000
-
2025-07-30$145,000 Active
-
2025-04-19historical
-
2025-02-16$145,000 Active
ⓘ Source: listings_history table (triggers on properties + properties_extension) + one-shot
backfill from property_details.listing_events for pre-trigger history.
Climate risk First Street
- Flood 6/10 Major FEMA zone AE · 66% chance over 30 yrs
- Wildfire 6/10 Major
- Heat 4/10 Moderate 7 d/yr ≥82°F today · 18 d/yr by 30 yrs out
- Wind 1/10 Low
- Air quality 6/10 Major 11 unhealthy d/yr today · 11 by 30 yrs out
Nearby sold comps map
Loading sold comps map…
Walkable amenities ~0.75 mi
Loading nearby amenities…
Taxation est. · year 1
- Rental income
- $29,422
- − Mortgage interest
- −$9,187
- − Property taxes
- −$2,460
- − Insurance
- −$5,938
- − Repairs & maintenance
- −$2,354
- − Management
- −$2,354
- − Depreciation
- −$4,771
- Taxable income
- $2,358
- Est. tax owed @ 24.0%
- −$566
- After-tax cash flow
- $3,958/yr
For passive investors: Depreciation is non-cash, so a rental often shows a tax loss while cash-flowing — sheltering income. Rental losses are passive: they offset passive income freely, and up to $25,000/yr can offset ordinary (W-2) income if you actively participate and your MAGI is under $100k (phasing out to $0 by $150k); unused losses carry forward. On sale, claimed depreciation is recaptured at up to 25%, and gains may owe capital-gains tax (a 1031 exchange can defer both). Figures are a year-1 estimate at your 24.0% rate — not tax advice; consult a CPA.
Condition & rehab AI · 13 photos
This manufactured home is in good condition with a good condition score of 80. It has a good kitchen, bathroom, and exterior. The home is move-in ready and has a good ROI potential for both resale and rental.
Value-add opportunities
- Resale Paint the exterior siding — Painting the exterior siding can improve the home's curb appeal and make it more attractive to potential buyers.
- Rental Replace any damaged windows — Replacing damaged windows can improve the home's energy efficiency and reduce heating and cooling costs.
Renovation cost estimate screening
Value-add ROI direction
- Resale Paint the exterior siding — Painting the exterior siding can improve the home's curb appeal and make it more attractive to potential buyers. ↑
- Rental Replace any damaged windows — Replacing damaged windows can improve the home's energy efficiency and reduce heating and cooling costs. ↑
ⓘ Cost ranges are severity-bucket heuristics (US national rule-of-thumb). Get contractor quotes + a written scope before underwriting a rehab budget.
Schools (NCES district)
- District
- San Luis Coastal Unified
- NCES district ID
- 0634800
- Math proficiency
- 50% ▼ -14.00%
- Reading proficiency
- 58% ▼ -12.00%
- Median HH income
- $53,428
- Composite
- 46.4/100
- National rank
- #2455
- State rank
- #118 of 517 in CA
Livability — San Luis Obispo
- Score
- 74/100
- State rank
- #132
- US rank
- #4576
Category grades
Schools grade is shown separately in the Schools card above.
Census & demographics
- Census place
- San Luis Obispo, CA
- County
- San Luis Obispo County · 224,651 people
- City population
- 54,204
- Metro
- San Luis Obispo-Paso Robles, CA
- Population (ZIP)
- 29,202
- Household income
- $96,824
- Rent vs Own
- Severe rent burden
- 2050.0
Population outlook (San Luis Obispo County) Hauer SSP2
- Today (2025)
- 306,977 people
- By 2030
- 320,378 · +4.4%
- By 2040
- 343,933 · +12.0%
- By 2050
- 366,853 · +19.5%
- By 2075
- 428,329 · +39.5%
- By 2100
- 460,687 · +50.1%
Race, ethnicity, and origin ACS 2023
- Neighborhood character
- Predominantly White (71%)
- Race & ethnicity
- White 71% Hispanic / Latino 18% Two or more races 12% Asian 4% Black 2%
- Hispanic origin (detail)
- Mexican 14%
- Common ancestry
- Lithuanian 4% Italian 3% Portuguese 3%
- Foreign-born
- 9% · Canada, China, South Korea
- Languages at home
- 84% English-only · Spanish 10% Chinese 1% Other Asian/Pacific 1%
Political lean MEDSL · San Luis Obispo
- 2024 margin
- D (+10.9) · D 53.9% · R 43.1% · Other 3.0%
- 2008→2024 swing
- +5.5pp toward D · 2008: 5.4pp · 2024: 10.9pp
- All cycles
- 2024: D+10.9 2020: D+13.1 2016: D+8.3 2012: D+1.0 2008: D+5.4
Not yet ingested
- Civics
- —
Market trends
- HPI YoY
- ▼ -796.84%
- Current HPI
- 359.9248
- Rent YoY
- ▲ 4.41%
- Metro
- San Luis Obispo-Paso Robles, CA
- State GDP YoY
- ▲ 3.21%
- F500 in state
- 116
Industry mix (Fortune 500 HQ in CA)
| Industry | F500 HQs | Revenue |
|---|---|---|
| Technology | 27 | $1,492B |
|
||
| Financial Services | 3 | $174B |
|
||
| Retail | 3 | $44B |
|
||
| Insurance | 3 | $26B |
|
||
| Media / Entertainment | 2 | $115B |
|
||
| Pharmaceuticals / Biotech | 2 | $62B |
|
||
Price history
+13.1% since first listed6 events — show timeline
- 2026-02-20 Listed $164,000 CRMLS
- 2026-01-31 Listing Removed — CRMLS
- 2025-10-25 Price Changed $164,000 CRMLS
- 2025-07-30 Listed $145,000 CRMLS
- 2025-04-19 Listing Removed — CRMLS
- 2025-02-16 Listed $145,000 CRMLS
Cash-flow waterfall
monthlySold comps — $/sqft
last 12 mo · ≤1 miLoading sold comps…