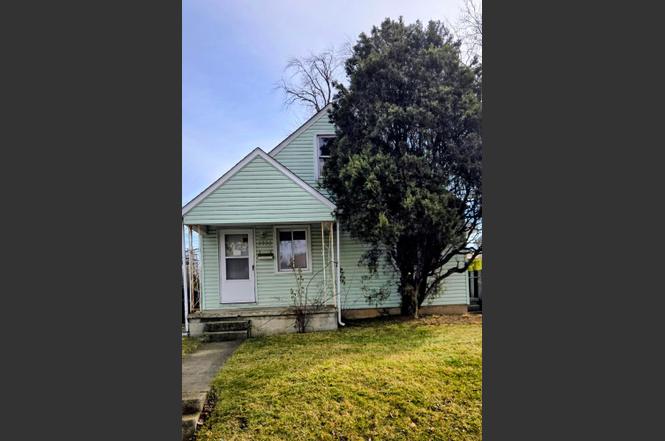
2332 Hamilton Ave · Columbus, OH
Flood risk 1/10 · Minimal
- FEMA flood zone
- X (unshaded)
- Chance of flooding over 30 yrs
- 0.0%
- Est. flood insurance / yr
- $473 – $860
Fire risk 1/10 · Minimal
- Est. fire insurance / yr
- $713 – $1,323
Heat risk 3/10 · Minor
- Hot days now (above 100°F)
- 7 days/yr
- Hot days in 30 yrs
- 18 days/yr
Wind risk 2/10 · Minimal
- Chance of severe wind over 30 yrs
- 1.0%
Air-quality risk 3/10 · Minor
- Unhealthy air days now
- 2 days/yr
- Unhealthy air days in 30 yrs
- 4 days/yr
Risk factors via First Street. Map © Google.
Why this score? — see what drove the B- grade
The composite is a weighted blend of 9 inputs, each scored 0–100. Each bar is that input's sub-score; the figure is the points it added to the 100-point composite (weight × sub-score).
- Cash flow +24.9/30.0
- ARV discount +15.0/15.0
- 1% rule +8.6/10.0
- DSCR +8.1/10.0
- Livability +4.0/5.0
- Rent growth +3.4/5.0
- Condition / age +2.5/5.0
- Schools +1.7/10.0
- Appreciation +0.0/10.0
$100,000
🖨 Deal sheet 📄 Offer letter ✓ Due diligence
Listing remarks
Value add opportunity! This home is ideal for investors, rehabs or buyers looking to bring their vision to life. Property requires updates and repairs as is priced to reflect its current condition. Strong upside potential for renovation and resale or long-term hold. Sold As Is with no repairs to be completed by Seller.
Key facts
- 4,356 sq ft lot
- Built 1951
- Listed 6 days
Neighborhood map
What this means for you Summary
Snapshot
- This is a 3-bed/1.0-bath single-family listed at $100k.
Deal economics
- At list price, monthly cash flow is $215 ($3k/yr) — positive.
- The deal already cash-flows at list — no discount required.
- Meets the 1% rule at list price ($1k rent vs $100k).
- Cap rate 8.9% vs local median 3.8% in Columbus — top-decile yield for the area; either an underpriced asset or a hidden risk that comps aren't pricing in. Stress-test before assuming the spread holds.
Location & tenants
- Location reads 81/100 on livability (#97 in OH, #1,491 nationally) — a professional / high-income tenant draw. Strengths: commute A+, cost of living A+, housing A+; Watch: employment C-, crime F.
- Columbus City School District (urban): math 15% / reading 26% proficiency, ranked #626 of 656 in OH (top 95%) — low school quality limits family demand, transient renter base, plan for 1-2y turnover; 72% free/reduced lunch — lower-income household profile, screen leases tightly.
- Market conditions: Rents rising (+3.4%/yr); 166 active listings in the ZIP; 40 comparable units currently listed for rent nearby; rentals at typical pace (median 24d on market — plan ~3-4 weeks tenant-placement turnaround); lower-income renter base — watch delinquency; 8,139 units permitted in Franklin County in 2024 (5,940 in 5+ unit buildings).
- This rent runs 38% of the median local income ($43k/yr) — at the standard rent-burdened threshold; future hikes will face affordability resistance.
Forward outlook
- Local home prices are declining (-3.0%/yr); year-one equity from $691 of loan paydown is wiped out by about $3k of value loss. Plan a longer hold.
- Franklin County population projected at +34% by 2050 — long-run rental-demand tailwind backs the buy-and-hold thesis.
Negotiation context
- Only 6 days on market — expect competitive offers; lowballing is unlikely to land.
Risks & watch-outs
- Watch-outs: property tax is 3.5% of price; built in 1951 — expect roof / HVAC / electrical / plumbing capex.
Questions for the listing agent
- Built in 1951 — when were the roof, HVAC, electrical panel, plumbing, and water heater last replaced?
- Property tax is high relative to price — has the assessment been appealed recently, and will the sale trigger a re-assessment?
- Is there a deadline driving the sale (1031 exchange, divorce, estate, relocation)? That informs how much negotiation room exists.
- Crime grade is F in this area — have there been break-ins, vandalism, or insurance claims at this property in the last 3 years? What carrier currently insures it and at what premium?
- What's the average days-on-market for RENTAL listings here right now (not sales)? A rising rental-DOM trend means longer vacancies and softer asking-rent achievability than the comps imply.
- What's the recent tenant-quality profile in this submarket — average credit score on applications, eviction rate, late-payment / NSF rate, and stable-employment percentage? A property-management company in the area should have these aggregated.
- How much new for-sale + rental construction is in the pipeline within 1–3 miles? Heavy new supply typically softens prices + rents 12–24 months out; constrained supply supports both.
Investment metrics
- 1% rule
- 1.36% ✓
- Cap rate
- 8.87%
- Cash-on-cash
- 9.22%
- DSCR
- 1.41
- GRM
- 6.1
CMA / ARV
- ARV (on-the-fly)
- $181,656
- Comps found
- 12
Show comp detail 12 sales within ~0.75 mi
| Address | Dist | Beds/Ba | Sqft | Sold | Price | $/sf | Match |
|---|---|---|---|---|---|---|---|
| 2498 Renwood Pl | 0.23mi | 3/1.0 | 1,043 (-0%) | 1mo | $210,000 | $201 | 88 |
| 1257 Loretta Ave | 0.15mi | 3/1.0 | 1,119 (+7%) | 1mo | $210,000 | $188 | 80 |
| 1175 E 23rd Ave | 0.55mi | 3/1.0 | 1,008 (-3%) | 1mo | $142,000 | $141 | 68 |
| 2205 Atwood Ter | 0.47mi | 3/1.0 | 979 (-6%) | 1mo | $189,900 | $194 | 67 |
| 2610 Atwood Ter | 0.48mi | 3/1.0 | 979 (-6%) | 1mo | $176,500 | $180 | 66 |
| 1408 Briarwood Ave | 0.40mi | 3/1.0 | 1,144 (+10%) | 0mo | $137,500 | $120 | 65 |
| 1448 Manchester Ave | 0.69mi | 3/1.0 | 1,014 (-3%) | 0mo | $180,000 | $178 | 63 |
| 2378 Velma Ave | 0.49mi | 2/1.0 (-1) | 1,100 (+5%) | 1mo | $165,000 | $150 | 62 |
| 2559 Hamilton Ave | 0.33mi | 3/1.5 | 919 (-12%) | 1mo | $140,000 | $152 | 62 |
| 2728 Atwood Ter | 0.62mi | 3/1.0 | 979 (-6%) | 1mo | $170,000 | $174 | 60 |
| 1562 Myrtle Ave | 0.60mi | 2/1.0 (-1) | 984 (-6%) | 0mo | $145,000 | $147 | 57 |
| 1258 E 21st Ave | 0.67mi | 2/1.5 (-1) | 1,008 (-3%) | 1mo | $112,000 | $111 | 55 |
Match score weights: distance 35% · size 25% · config 20% · recency 20%. Top-matched comps best support the ARV.
Projected returns pro-forma
-3.0% appreciation · 3.41% rent growth · sell at horizon
- IRR
- -1.7%
- Equity multiple
- 0.93×
- Total profit
- $-1,826
- Equity at exit
- $14,910
- IRR
- 8.6%
- Equity multiple
- 1.67×
- Total profit
- $18,866
- Equity at exit
- $8,646
Cash invested: $28,000 (down + closing). Projections, not guarantees.
Landlord ↔ Tenant lean methodology
- Overall (STATE)
- 73 Landlord-Friendly
- State Ohio
- 73 Landlord-Friendly · R+6
- County
- — inherits STATE
- City
- — inherits STATE
ZIP-level market 43211
- Home prices YoY
- -27.3%
- Rents YoY
- 3.4%
- Active inventory
- 166
- Price-to-rent
- 6.1×
Monthly cashflow live
- Estimated rent
- $1,357 high interval (Pro) →
- Mortgage (P&I)
- −$524
- Tax from tax record
- −$291 /mo · $3,487/yr
- Insurance
- −$42
- HOA
- −$0
- Vacancy / Maint / Mgmt
- −$285
- Net cashflow
- $215
Break-even live
UW: 25.0% down · 7.5% · 30yr · 1.5% tax · 5.0% vac · 8.0% maint · 8.0% mgmt
Financing live
Cash to close
- Down payment
- $25,000
- Closing costs
- $3,000
- Reserves months
- —
- Total cash needed
- —
Loan-product check · same deal, 3 products live
Conventional
25% down · 7.5% · 30yr
- Down + closing
- —
- Monthly P&I
- —
- Monthly cashflow
- —
- DSCR
- —
- Eligible?
- —
Personal DTI + credit; lowest rate.
DSCR
20% down · 8.5% · 30yr
- Down + closing
- —
- Monthly P&I
- —
- Monthly cashflow
- —
- DSCR
- —
- Eligible?
- —
No personal income docs; deal must DSCR.
Hard money
10% down · 12.0% · 12mo
- Down + closing
- —
- Monthly P&I
- —
- Monthly cashflow
- —
- DSCR
- —
- Eligible?
- —
Short-term bridge; refi at stabilization.
Rent comps 40 comps
| Address | Beds | Baths | Sqft | Rent | $/sqft | DOM | Units | Dist |
|---|---|---|---|---|---|---|---|---|
| 2299 Hamilton Ave Columbus, OH | 2.0 | 1.0 | 1000 | $1,200 | $1.20 | 44d | 1 | 0.02mi |
| 2176 Ontario St Columbus, OH | 4.0 | 2.0 | 1066 | $1,650 | $1.55 | 24d | 1 | 0.22mi |
| 2203-2205 Mcguffey Rd Columbus, OH | 2.0 | 1.0 | 836 | $1,050 | $1.26 | 24d | 1 | 0.24mi |
| 1352 E Hudson St Columbus, OH | 2.0 | 1.0 | 800 | $1,150 | $1.44 | 44d | 1 | 0.28mi |
| 2217 Grasmere Ave Columbus, OH | 2.0 | 1.5 | 720 | $1,650 | $2.29 | 15d | 1 | 0.32mi |
| 967 Duxberry Ave Columbus, OH | 3.0 | 1.0 | 864 | $1,100 | $1.27 | 44d | 1 | 0.35mi |
| 2236 Atwood Ter Columbus, OH | 2.0 | 1.0 | 720 | $900 | $1.25 | 8d | 1 | 0.39mi |
| 2459 Atwood Ter Columbus, OH | 2.0 | 2.0 | 936 | $1,650 | $1.76 | 44d | 1 | 0.40mi |
| 1435 Republic Ave Columbus, OH | 3.0 | 1.0 | 908 | $1,395 | $1.54 | 8d | 1 | 0.41mi |
| 1435 Republic Ave Columbus, OH | 3.0 | 1.0 | 908 | $1,425 | $1.57 | 20d | 1 | 0.41mi |
| 1410 E Blake Ave Columbus, OH | 3.0 | 1.0 | 1300 | $1,700 | $1.31 | 24d | 1 | 0.42mi |
| 2459 Hiawatha St Columbus, OH | 2.0 | 1.0 | 810 | $1,025 | $1.27 | 44d | 1 | 0.45mi |
| 2566 Atwood Ter Columbus, OH | 3.0 | 1.0 | 979 | $1,500 | $1.53 | 24d | 1 | 0.46mi |
| 1269 Minnesota Ave Columbus, OH | 3.0 | 1.0 | 1075 | $1,550 | $1.44 | 8d | 1 | 0.50mi |
| 1514 Republic Ave Unit 1514 Columbus, OH | 3.0 | 1.5 | 1288 | $1,450 | $1.13 | 24d | 1 | 0.53mi |
| 2472 Pontiac St Columbus, OH | 2.0 | 1.0 | 754 | $995 | $1.32 | 15d | 1 | 0.53mi |
| 2472 Pontiac St Columbus, OH | 2.0 | 1.0 | 754 | $995 | $1.32 | 3d | 1 | 0.53mi |
| 1527 Republic Ave Columbus, OH | 3.0 | 1.0 | 1176 | $1,345 | $1.14 | 44d | 1 | 0.54mi |
| 1527 Republic Ave Columbus, OH | 3.0 | 1.0 | 1176 | $1,299 | $1.10 | 24d | 1 | 0.54mi |
| 1354 Minnesota Ave Columbus, OH | 3.0 | 2.0 | 1350 | $1,800 | $1.33 | 12d | 1 | 0.55mi |
| 1269 E 23rd Ave Columbus, OH | 3.0 | 1.0 | 1175 | $1,350 | $1.15 | 8d | 1 | 0.57mi |
| 1171 E 22nd Ave Unit 1171 Columbus, OH | 2.0 | 1.0 | 750 | $1,100 | $1.47 | 17d | 1 | 0.58mi |
| 1185 E 22nd Ave Columbus, OH | 3.0 | 1.0 | 1304 | $1,400 | $1.07 | 44d | 1 | 0.58mi |
| 1320 E 23rd Ave Unit 1320 Columbus, OH | 3.0 | 1.0 | 1134 | $1,050 | $0.93 | 44d | 1 | 0.58mi |
| 1555 Myrtle Ave Columbus, OH | 2.0 | 2.5 | 1200 | $1,500 | $1.25 | 44d | 1 | 0.60mi |
| 1003 E 21st Ave Columbus, OH | 2.0 | 1.5 | 835 | $1,150 | $1.38 | 8d | 1 | 0.63mi |
| 1524 Genessee Ave Unit A Columbus, OH | 2.0 | 1.0 | 800 | $1,150 | $1.44 | 3d | 1 | 0.63mi |
| 1577 Cordell Ave Columbus, OH | 2.0 | 1.0 | 882 | $1,000 | $1.13 | 3d | 1 | 0.64mi |
| 1530 Genessee Ave Unit B Columbus, OH | 2.0 | 1.0 | 800 | $1,150 | $1.44 | 3d | 1 | 0.65mi |
| 1906-1908 Cleveland Ave Columbus, OH | 3.0 | 1.0 | 1384 | $1,295 | $0.94 | 44d | 1 | 0.65mi |
| 1272 E 21st Ave Unit 1272 Columbus, OH | 3.0 | 1.5 | 1176 | $1,400 | $1.19 | 11d | 1 | 0.66mi |
| 1576-1578 Arlington Ave Unit 1576 Columbus, OH | 2.0 | 1.0 | 902 | $1,000 | $1.11 | 44d | 1 | 0.66mi |
| 1624 Kohr Pl Columbus, OH | 3.0 | 1.0 | 1176 | $1,400 | $1.19 | 15d | 1 | 0.67mi |
| 1500 E 25th Ave Columbus, OH | 2.0 | 1.0 | 720 | $850 | $1.18 | 44d | 1 | 0.68mi |
| 1153 E 20th Ave Columbus, OH | 2.0 | 1.0 | 950 | $1,250 | $1.32 | 44d | 1 | 0.68mi |
| 1500 E 25th Ave Unit 2 Columbus, OH | 2.0 | 1.0 | 720 | $850 | $1.18 | 24d | 1 | 0.68mi |
| 2767 Hiawatha St Columbus, OH | 3.0 | 1.0 | 896 | $1,475 | $1.65 | 8d | 1 | 0.72mi |
| 1318-1320 E 20th Ave Unit 1318 Columbus, OH | 3.0 | 1.0 | 1120 | $1,275 | $1.14 | 8d | 1 | 0.75mi |
| 924 E 18th Ave Columbus, OH | 2.0 | 1.0 | 950 | $1,200 | $1.26 | 44d | 1 | 0.80mi |
| 2630 Homecroft Dr Columbus, OH | 2.0 | 1.0 | 1200 | $1,350 | $1.12 | 44d | 1 | 0.80mi |
Listing history 2 events
-
2026-02-25status Pending
-
2026-02-19$100,000 Active
ⓘ Source: listings_history table (triggers on properties + properties_extension) + one-shot
backfill from property_details.listing_events for pre-trigger history.
Tax reassessment forecast OH · Partial reset (capped growth)
- Current annual tax
- $3,487 · $291/mo
- Projected year-2 tax
- $3,487 · $291/mo
- Expected delta
- $0/yr ($0/mo · 0.0%)
ⓘ Screening estimate from a state-policy table — verify with the county assessor before closing.
Climate risk First Street
- Flood 1/10 Low FEMA zone X (unshaded) · 0% chance over 30 yrs
- Wildfire 1/10 Low
- Heat 3/10 Moderate 7 d/yr ≥100°F today · 18 d/yr by 30 yrs out
- Wind 2/10 Low 100% chance of damaging wind over 30 yrs
- Air quality 3/10 Moderate 2 unhealthy d/yr today · 4 by 30 yrs out
Nearby sold comps map
Loading sold comps map…
Walkable amenities ~0.75 mi
Loading nearby amenities…
Taxation est. · year 1
- Rental income
- $16,279
- − Mortgage interest
- −$5,602
- − Property taxes
- −$3,487
- − Insurance
- −$500
- − Repairs & maintenance
- −$1,302
- − Management
- −$1,302
- − Depreciation
- −$2,909
- Taxable income
- $1,176
- Est. tax owed @ 24.0%
- −$282
- After-tax cash flow
- $2,298/yr
For passive investors: Depreciation is non-cash, so a rental often shows a tax loss while cash-flowing — sheltering income. Rental losses are passive: they offset passive income freely, and up to $25,000/yr can offset ordinary (W-2) income if you actively participate and your MAGI is under $100k (phasing out to $0 by $150k); unused losses carry forward. On sale, claimed depreciation is recaptured at up to 25%, and gains may owe capital-gains tax (a 1031 exchange can defer both). Figures are a year-1 estimate at your 24.0% rate — not tax advice; consult a CPA.
Schools (NCES district)
- District
- Columbus City School District
- NCES district ID
- 3904380
- Math proficiency
- 15% ▼ -17.00%
- Reading proficiency
- 26% ▼ -12.00%
- Median HH income
- $38,483
- Composite
- 17.19/100
- National rank
- #9105
- State rank
- #626 of 656 in OH
Livability — Columbus
- Score
- 81/100
- State rank
- #97
- US rank
- #1491
Category grades
Schools grade is shown separately in the Schools card above.
Census & demographics
- Census place
- Columbus, OH
- County
- Franklin County · 1,351,780 people
- City population
- 612,189
- Metro
- Columbus, OH
- Population (ZIP)
- 22,313
- Household income
- $42,579
- Rent vs Own
- Severe rent burden
- 1282.0
Population outlook (Franklin County) Hauer SSP2
- Today (2025)
- 1,456,139 people
- By 2030
- 1,556,890 · +6.9%
- By 2040
- 1,757,349 · +20.7%
- By 2050
- 1,950,539 · +34.0%
- By 2075
- 2,376,171 · +63.2%
- By 2100
- 2,636,796 · +81.1%
Race, ethnicity, and origin ACS 2023
- Neighborhood character
- Diverse neighborhood (Simpson 0.60)
- Race & ethnicity
- Black 58% White 21% Hispanic / Latino 13% Two or more races 12% Asian 2%
- Hispanic origin (detail)
- Mexican 8% Dominican 1%
- Common ancestry
- Italian 1%
- Foreign-born
- 10% · Canada, India
- Languages at home
- 84% English-only · Spanish 11% Other Indo-European 2% Arabic 1%
Political lean MEDSL · Franklin
- 2024 margin
- Strong D (+28.4) · D 63.7% · R 35.3% · Other 1.0%
- 2008→2024 swing
- +7.7pp toward D · 2008: 20.7pp · 2024: 28.4pp
- All cycles
- 2024: D+28.4 2020: D+31.4 2016: D+25.9 2012: D+21.7 2008: D+20.7
Not yet ingested
- Civics
- —
Market trends
- HPI YoY
- ▼ -94.10%
- Current HPI
- 250.3885
- Rent YoY
- ▲ 3.41%
- Metro
- Columbus, OH
- State GDP YoY
- ▲ 1.98%
- F500 in state
- 48
Industry mix (Fortune 500 HQ in OH)
| Industry | F500 HQs | Revenue |
|---|---|---|
| Insurance | 3 | $145B |
|
||
| Industrial Machinery | 3 | $49B |
|
||
| Financial Services | 3 | $24B |
|
||
| Consumer Goods | 2 | $93B |
|
||
| Aerospace / Defense | 2 | $47B |
|
||
| Utilities | 2 | $33B |
|
||
Price history
2 events — show timeline
- 2026-02-25 Pending — CBRMLS
- 2026-02-19 Listed $100,000 CBRMLS
Property tax history
+25.8%/yrLatest (2024): $3,487 · +294.5% YoY. Source: county tax records.
Cash-flow waterfall
monthlySold comps — $/sqft
last 12 mo · ≤1 miLoading sold comps…