 Duplex
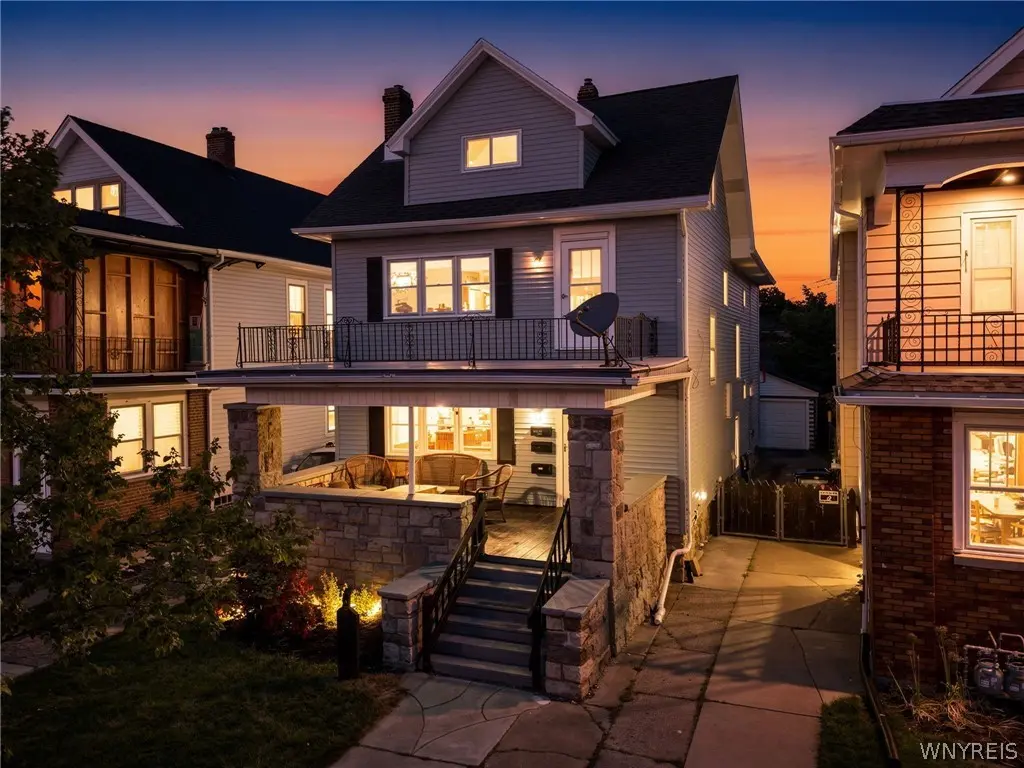
35 Elmview Pl · Buffalo, NY
Flood risk 1/10 · Minimal
- FEMA flood zone
- X (unshaded)
- Chance of flooding over 30 yrs
- 0.0%
- Est. flood insurance / yr
- $473 – $860
Fire risk 1/10 · Minimal
- Est. fire insurance / yr
- $691 – $1,283
Heat risk 3/10 · Minor
- Hot days now (above 91°F)
- 7 days/yr
- Hot days in 30 yrs
- 15 days/yr
Wind risk 1/10 · Minimal
- Chance of severe wind over 30 yrs
- —
Air-quality risk 4/10 · Minor
- Unhealthy air days now
- 4 days/yr
- Unhealthy air days in 30 yrs
- 9 days/yr
Risk factors via First Street. Map © Google.
Why this score? — see what drove the D grade
The composite is a weighted blend of 9 inputs, each scored 0–100. Each bar is that input's sub-score; the figure is the points it added to the 100-point composite (weight × sub-score).
- Cash flow +19.7/30.0
- DSCR +6.2/10.0
- Rent growth +4.5/5.0
- 1% rule +3.9/10.0
- Livability +3.9/5.0
- Schools +3.3/10.0
- Condition / age +2.5/5.0
- ARV discount +0.0/15.0
- Appreciation +0.0/10.0
$349,900
🖨 Deal sheet 📄 Offer letter ✓ Due diligence
Multi-family units
County records classify this as Multi-Family (2-4 Unit). Listing-text estimate: 2 units. confirmed
Listing remarks MLS
* * LOOKING FOR THAT MAINTENANCE FREE 2 UNIT IN N BUFFALO? * * HIGHLY DESIREABLE HOME OFFERING 3 BEDROOMS IN EACH FLAT. TAKE THIS OPPORTUNITY TO OWN A GREAT PROPERTY WITH ONE APARTMENT PAYING ALMOST THE ENTIRE MORTGAGE. SPACIOUS APPLIANCED KITCHENS, LARGE DINING & LIVING ROOMS, PRIVATE PORCHES FOR EACH UNIT, OFF-STEET PARKING, SEPARATE LAUNDRY HOOK-UPS, MASSIVE DRY BASEMENT, ETC. THIS PROPERTY IS MECHANICALLY SOUND WITH SIGNIFICANT UPDATES OVER THE YEARS. UPDATES INCL: TEAR-OFF ROOK 2014, REPLACEMENT WINDOWS 2015, BOTH FURNACES & HOT WATER TANKS 2015-2016, REFINISHED HARDWOOD FLOORS, CENTRAL AC IN LOWER UNIT. CONCRETE DRIVEWAY LEADS TO FULLY FENCED YARD WITH A DETACHED 1.5 CAR GARAGE. THIS HOME IS SITUATED BEAUTIFULLY ON THIS QUIET AND VERY QUAINT N BUFFALO STREET. NEARBY CONVENIENCES INCLUDE: SHOPPING, RESTAURANTS, PUBS & BISTROS, WEGMANS, ETC ETC.
Key facts
- Central ac
- Walk up attic
- Private porches
Tags
Property features AI
Finance
- Financial info: Two-unit property with separate gas and electric meters for each unit; Owner pays water; water included in rent; Operating expenses include water; One unit listed with $1,250 actual monthly rent and is month-to-month; the other unit shows no rent listed
Exterior
- Parking: Garage with 1.5 spaces; Concrete driveway; Garage door opener; Two or more off-street spaces
- Utilities: Electricity connected; High-speed Internet available; Cable available; Public water connected; Sewer connected
- Home design: Two-story multifamily property; Resale condition; Vinyl siding exterior; Rectangular lot near public transit, city street frontage
- Construction: Vinyl siding construction; Existing (established) building; Two stories
- Exterior features: Fully fenced yard; Covered and open porch
Interior
- Kitchen: Dishwasher; Oven/Range; Refrigerator; Formal dining room in each unit
- Bedrooms: Two 3-bedroom units (each unit listed as 3 bedrooms)
- Flooring: Hardwood; Tile; Varies
- Bathrooms: Each unit has 1 full bathroom (2 full bathrooms total)
- Heating & cooling: Gas forced-air heating; Central air conditioning
- Interior features: Natural woodwork; Hardwood, tile, and varied flooring; Full basement
- Laundry & utility: Washer hookup; Gas water heater
Neighborhood map
What this means for you Summary
Snapshot
- This is a 2 × 3-bed/1.0-bath units multifamily listed at $350k.
Deal economics
- At list price, monthly cash flow is $410 ($5k/yr) — positive. Per door: $205/mo.
- The deal already cash-flows at list — no discount required.
- To meet the 1% rule (rent ≥ 1% of price), the offer needs to be $312k (10.9% below list).
- Recommended offer: $312k (10.9% below list) — sets the bar for 1% rule.
Location & tenants
- Location reads 77/100 on livability (#195 in NY, #3,011 nationally) — a middle-class / working-renter tenant base. Strengths: commute A+, housing A+, health & safety A+; Watch: crime F, employment D-.
- Buffalo City School District (urban): math 41% / reading 40% proficiency, ranked #535 of 590 in NY (top 91%) — families likely to look elsewhere, expect single-tenant / working-renter base with shorter leases; 75% free/reduced lunch — lower-income household profile, screen leases tightly.
- Market conditions: Rents rising fast (+8.2%/yr); 197 active listings in the ZIP; lower-income renter base — watch delinquency; 1,244 units permitted in Erie County in 2024 (563 in 5+ unit buildings).
- At $3,117/mo this rent would consume 94% of the median local household income ($40k/yr) (locally 2177% of renters already pay >50% of income on rent) — very limited rent-growth headroom before tenants either downsize or default.
Forward outlook
- Local home prices are declining (-3.0%/yr); year-one equity from $2k of loan paydown is wiped out by about $10k of value loss. Plan a longer hold.
- At projected returns (-3.0% appreciation + 8.0% rent growth), your $98k cash investment doubles in ~10 years — after that, you're playing with house money.
Negotiation context
- Only 8 days on market — expect competitive offers; lowballing is unlikely to land.
- 2 sale attempts since 6y ago with the ask held roughly flat each time — persistent listings suggest the price (not the market) is what's stuck; bring a comps-based counter.
- Current owner paid $277k; 26% above their basis — modest negotiation headroom, anchor on the comps not their cost.
Risks & watch-outs
- Watch-outs: built in 1910 — expect roof / HVAC / electrical / plumbing capex.
Questions for the listing agent
- Can we see the unit-by-unit rent roll, current vacancy, and any below-market leases? What's the average tenancy length?
- What capital expenditures (roof, boiler, parking lot, exteriors) have been made in the last 5 years, and what's planned in the next 2?
- Built in 1910 — when were the roof, HVAC, electrical panel, plumbing, and water heater last replaced?
- Is there a deadline driving the sale (1031 exchange, divorce, estate, relocation)? That informs how much negotiation room exists.
- Crime grade is F in this area — have there been break-ins, vandalism, or insurance claims at this property in the last 3 years? What carrier currently insures it and at what premium?
- The area grade is low — what's the realistic commute time and amenity access for the typical tenant pool here? Any planned neighborhood developments (good or bad) we should know about?
- What's the average days-on-market for RENTAL listings here right now (not sales)? A rising rental-DOM trend means longer vacancies and softer asking-rent achievability than the comps imply.
- What's the recent tenant-quality profile in this submarket — average credit score on applications, eviction rate, late-payment / NSF rate, and stable-employment percentage? A property-management company in the area should have these aggregated.
- How much new apartment / multifamily construction is in the pipeline within 1–3 miles? Heavy new supply (>2% of stock underway) typically softens rents 12–24 months out; light construction supports rent growth.
Investment metrics
- 1% rule
- 0.89% ✗
- Cap rate
- 7.70%
- Cash-on-cash
- 5.02%
- DSCR
- 1.22
- GRM
- 9.4
CMA / ARV
- ARV (on-the-fly)
- $270,400
- Comps found
- 12
Show comp detail 12 sales within ~0.75 mi
| Address | Dist | Beds/Ba | Sqft | Sold | Price | $/sf | Match |
|---|---|---|---|---|---|---|---|
| 314 Bedford Ave | 0.18mi | 6/2.0 | 2,710 (+0%) | 2mo | $387,500 | $143 | 90 |
| 1540 Elmwood Ave | 0.07mi | 6/2.0 | 2,712 (+0%) | 13mo | $350,000 | $129 | 85 |
| 331 Bedford Ave | 0.14mi | 6/2.0 | 2,941 (+9%) | 10mo | $365,000 | $124 | 71 |
| 28 Marion St | 0.27mi | 6/3.0 | 2,912 (+8%) | 0mo | $275,000 | $94 | 70 |
| 903 Amherst St | 0.48mi | 5/3.0 (-1) | 2,851 (+5%) | 5mo | $300,000 | $105 | 56 |
| 818 Amherst St | 0.32mi | 6/2.0 | 2,322 (-14%) | 8mo | $300,000 | $129 | 55 |
| 75 Saint Florian St | 0.56mi | 6/2.0 | 2,338 (-14%) | 10mo | $160,000 | $68 | 43 |
| 640 Grant St | 0.71mi | 6/3.0 | 2,858 (+6%) | 12mo | $275,000 | $96 | 43 |
| 39 Letchworth St | 0.70mi | 6/2.0 | 2,552 (-6%) | 21mo | $218,500 | $86 | 41 |
| 144 Peter St | 0.48mi | 6/3.0 | 2,380 (-12%) | 19mo | $140,000 | $59 | 38 |
| 877 Hertel Ave | 0.61mi | 6/2.0 | 2,312 (-14%) | 18mo | $205,000 | $89 | 32 |
| 52 Sunset St | 0.72mi | 6/2.0 | 2,304 (-15%) | 16mo | $230,000 | $100 | 28 |
Match score weights: distance 35% · size 25% · config 20% · recency 20%. Top-matched comps best support the ARV.
Projected returns pro-forma
-3.0% appreciation · 8.0% rent growth · sell at horizon
- IRR
- -3.7%
- Equity multiple
- 0.85×
- Total profit
- $-14,297
- Equity at exit
- $52,171
- IRR
- 10.4%
- Equity multiple
- 1.97×
- Total profit
- $95,419
- Equity at exit
- $30,253
Cash invested: $97,972 (down + closing). Projections, not guarantees.
Landlord ↔ Tenant lean methodology
- Overall (STATE)
- 15 Strongly Tenant-Friendly
- State New York
- 15 Strongly Tenant-Friendly · D+10
- County
- — inherits STATE
- City
- — inherits STATE
ZIP-level market 14207
- Home prices YoY
- -18.9%
- Rents YoY
- 8.2%
- Active inventory
- 197
- Price-to-rent
- 18.7×
Monthly cashflow live
- Estimated rent
- $3,117 high interval (Pro) →
- Mortgage (P&I)
- −$1,835
- Tax from tax record
- −$72 /mo · $862/yr
- Insurance
- −$146
- HOA
- −$0
- Vacancy / Maint / Mgmt
- −$655
- Net cashflow
- $410
Break-even live
2-unit breakdown (identical units grouped — click to expand)
| Units | Beds | Baths | Est. rent |
|---|---|---|---|
| 2× units | 3 | 1 | $3,118 |
| #1 | 3 | 1 | $1,559 |
| #2 | 3 | 1 | $1,559 |
| Total (2 units) | $3,117 | ||
UW: 25.0% down · 7.5% · 30yr · 1.5% tax · 5.0% vac · 8.0% maint · 8.0% mgmt
Financing live
Cash to close
- Down payment
- $87,475
- Closing costs
- $10,497
- Reserves months
- —
- Total cash needed
- —
Loan-product check · same deal, 3 products live
Conventional
25% down · 7.5% · 30yr
- Down + closing
- —
- Monthly P&I
- —
- Monthly cashflow
- —
- DSCR
- —
- Eligible?
- —
Personal DTI + credit; lowest rate.
DSCR
20% down · 8.5% · 30yr
- Down + closing
- —
- Monthly P&I
- —
- Monthly cashflow
- —
- DSCR
- —
- Eligible?
- —
No personal income docs; deal must DSCR.
Hard money
10% down · 12.0% · 12mo
- Down + closing
- —
- Monthly P&I
- —
- Monthly cashflow
- —
- DSCR
- —
- Eligible?
- —
Short-term bridge; refi at stabilization.
Listing history 7 events
-
2026-06-18days on market $349,900 Active 8 DOM
-
2026-06-17days on market $349,900 Active 7 DOM
-
2026-06-16days on market $349,900 Active 6 DOM
-
2026-06-15days on market $349,900 Active 5 DOM
-
2026-06-13days on market $349,900 Active 3 DOM
-
2026-06-13remarks 681-char remark
-
2026-06-13$349,900 Active 2 DOM
ⓘ Source: listings_history table (triggers on properties + properties_extension) + one-shot
backfill from property_details.listing_events for pre-trigger history.
Tax reassessment forecast NY · Partial reset (capped growth)
- Current annual tax
- $862 · $72/mo
- Projected year-2 tax
- $3,388 · $282/mo
- Expected delta
- +$2,526/yr (+$210/mo · 293.0%)
ⓘ Screening estimate from a state-policy table — verify with the county assessor before closing.
Climate risk First Street
- Flood 1/10 Low FEMA zone X (unshaded) · 0% chance over 30 yrs
- Wildfire 1/10 Low
- Heat 3/10 Moderate 7 d/yr ≥91°F today · 15 d/yr by 30 yrs out
- Wind 1/10 Low
- Air quality 4/10 Moderate 4 unhealthy d/yr today · 9 by 30 yrs out
Nearby sold comps map
Loading sold comps map…
Walkable amenities ~0.75 mi
Loading nearby amenities…
Taxation est. · year 1
- Rental income
- $37,404
- − Mortgage interest
- −$19,600
- − Property taxes
- −$862
- − Insurance
- −$1,750
- − Repairs & maintenance
- −$2,992
- − Management
- −$2,992
- − Depreciation
- −$10,179
- Taxable loss
- −$971
- Est. tax savings @ 24.0%
- +$233
- After-tax cash flow
- $5,152/yr
For passive investors: Depreciation is non-cash, so a rental often shows a tax loss while cash-flowing — sheltering income. Rental losses are passive: they offset passive income freely, and up to $25,000/yr can offset ordinary (W-2) income if you actively participate and your MAGI is under $100k (phasing out to $0 by $150k); unused losses carry forward. On sale, claimed depreciation is recaptured at up to 25%, and gains may owe capital-gains tax (a 1031 exchange can defer both). Figures are a year-1 estimate at your 24.0% rate — not tax advice; consult a CPA.
Schools (NCES district)
- District
- Buffalo City School District
- NCES district ID
- 3605850
- Math proficiency
- 41% ▲ 11.00%
- Reading proficiency
- 40% ▲ 7.00%
- Median HH income
- $31,665
- Composite
- 33.17/100
- National rank
- #5544
- State rank
- #535 of 590 in NY
Livability — Buffalo
- Score
- 77/100
- State rank
- #195
- US rank
- #3011
Category grades
Schools grade is shown separately in the Schools card above.
Census & demographics
- Census place
- Buffalo, NY
- County
- Erie County · 714,559 people
- City population
- 440,021
- Metro
- Buffalo-Cheektowaga, NY
- Population (ZIP)
- 26,327
- Household income
- $39,753
- Rent vs Own
- Severe rent burden
- 2177.0
Population outlook (Erie County) Hauer SSP2
- Today (2025)
- 933,037 people
- By 2030
- 935,181 · +0.2%
- By 2040
- 928,531 · -0.5%
- By 2050
- 905,725 · -2.9%
- By 2075
- 834,037 · -10.6%
- By 2100
- 708,033 · -24.1%
Race, ethnicity, and origin ACS 2023
- Neighborhood character
- Highly diverse neighborhood (Simpson 0.74)
- Race & ethnicity
- White 40% Hispanic / Latino 23% Black 16% Asian 15% Two or more races 14%
- Hispanic origin (detail)
- Puerto Rican 18% Dominican 2%
- Common ancestry
- Romanian 8% Portuguese 1% Arab 1%
- Foreign-born
- 19% · Philippines, Canada, India
- Languages at home
- 65% English-only · Spanish 14% Other Asian/Pacific 10% Other Indo-European 5%
Political lean MEDSL · Erie
- 2024 margin
- Lean D (+9.7) · D 54.8% · R 45.2%
- 2008→2024 swing
- -7.9pp toward R · 2008: 17.5pp · 2024: 9.7pp
- All cycles
- 2024: D+9.7 2020: D+14.7 2016: D+4.8 2012: D+15.6 2008: D+17.5
Not yet ingested
- Civics
- —
Market trends
- HPI YoY
- ▼ -54.42%
- Current HPI
- 233.0902
- Rent YoY
- ▲ 8.19%
- Metro
- Buffalo-Cheektowaga, NY
- State GDP YoY
- ▲ 2.60%
- F500 in state
- 92
Industry mix (Fortune 500 HQ in NY)
| Industry | F500 HQs | Revenue |
|---|---|---|
| Financial Services | 10 | $950B |
|
||
| Consumer Goods | 9 | $162B |
|
||
| Insurance | 4 | $225B |
|
||
| Telecommunications | 2 | $144B |
|
||
| Pharmaceuticals | 2 | $112B |
|
||
| Media / Entertainment | 2 | $69B |
|
||
Price history
+363.4% since first listed8 events — show timeline
- 2026-06-10 Listed $349,900 WNYREIS
- 2021-02-12 Sold (Public Records) $277,000 Public Records
- 2021-01-22 Sold (MLS) $277,000 WNYREIS
- 2021-01-09 Pending — WNYREIS
- 2020-12-01 Pending — WNYREIS
- 2020-11-20 Listed $269,000 WNYREIS
- 2011-07-19 Sold (Public Records) $95,000 Public Records
- 1997-05-01 Sold (Public Records) $75,500 Public Records
Property tax history
+6.4%/yrLatest (2025): $862 · -17.3% YoY. Source: county tax records.
Cash-flow waterfall
monthlySold comps — $/sqft
last 12 mo · ≤1 miLoading sold comps…