 Duplex
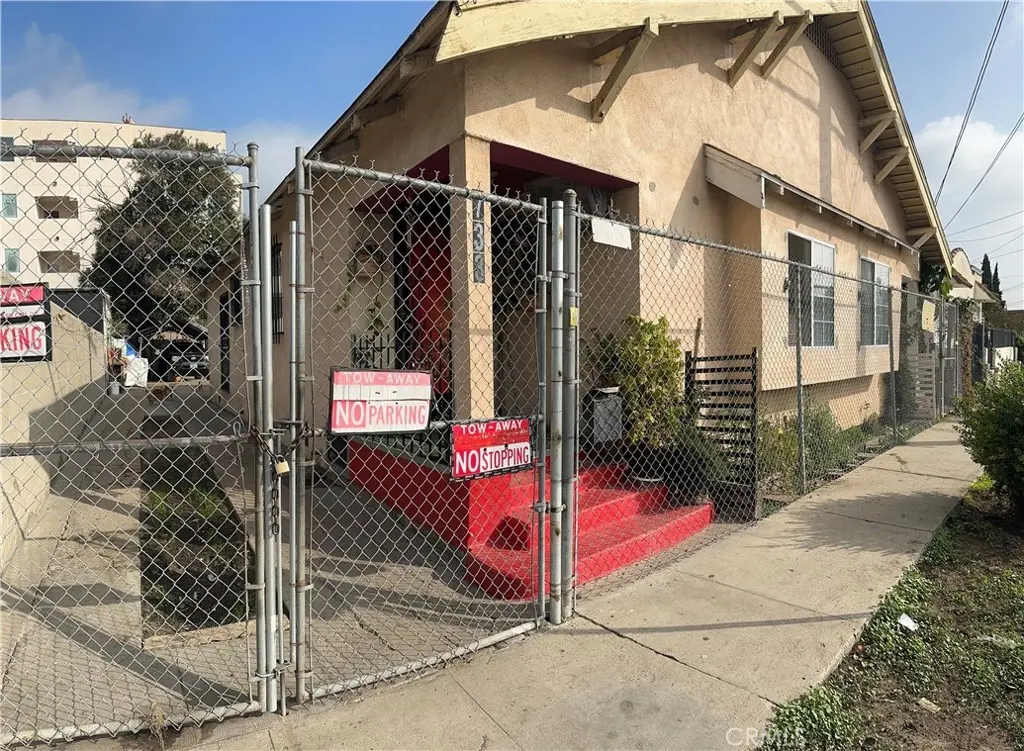
731 W 54th · Los Angeles, CA
Flood risk 1/10 · Minimal
- FEMA flood zone
- X (unshaded)
- Chance of flooding over 30 yrs
- 0.0%
- Est. flood insurance / yr
- $507 – $1,088
Fire risk 1/10 · Minimal
- Est. fire insurance / yr
- $659 – $1,223
Heat risk 5/10 · Moderate
- Hot days now (above 88°F)
- 7 days/yr
- Hot days in 30 yrs
- 22 days/yr
Wind risk 1/10 · Minimal
- Chance of severe wind over 30 yrs
- —
Air-quality risk 5/10 · Moderate
- Unhealthy air days now
- 7 days/yr
- Unhealthy air days in 30 yrs
- 7 days/yr
Risk factors via First Street. Map © Google.
Why this score? — see what drove the C- grade
The composite is a weighted blend of 9 inputs, each scored 0–100. Each bar is that input's sub-score; the figure is the points it added to the 100-point composite (weight × sub-score).
- Cash flow +16.1/30.0
- ARV discount +15.0/15.0
- DSCR +5.0/10.0
- Schools +3.6/10.0
- Livability +3.4/5.0
- 1% rule +3.2/10.0
- Rent growth +2.9/5.0
- Condition / age +2.5/5.0
- Appreciation +0.0/10.0
$499,000
🖨 Deal sheet (PDF) 📄 Offer letter ✓ Due diligence
Multi-family units
County records classify this as Multi-Family (2-4 Unit). Listing-text estimate: 2 units. confirmed
Listing remarks MLS
DUPLEX - NEEDS SOME TLC - SEE AGENT REMARKS FOR SHOWING AND OFFER INSTRUCTIONS.
Key facts
- 2,065 sq ft lot
- 2 parking spots
- Built 1915
Property features AI
Finance
- Financial info: Total building area reported as 1,156; Gross scheduled income: $12,600; Gross income: $11,970; Net operating income: $9,900; Operating expenses: $2,700 (includes $1,800 water/sewer and $900 trash); Property is rent controlled; Two rental units with reported rents: one unit at $350 and one unit at $700
Exterior
- Parking: Two parking spaces (includes 2 carport spaces)
- Utilities: Public sewer; District/Public water; Two separate water meters; Two separate gas meters; Two separate electric meters
- Home design: Single-story building; No shared/common walls; No accessory dwelling unit (ADU)
- Construction: Year built reported from assessor; One building
- Exterior features: No pool; Street lighting and sidewalks in the neighborhood; Lot characterized as 0-1 Unit/Acre
Interior
- Bedrooms: Two 1-bedroom units (each unit listed as 1 bed)
- Bathrooms: Each unit has 1 full bathroom
- Heating & cooling: No heating/cooling details provided
- Interior features: Front door entry
- Laundry & utility: No laundry on site
Neighborhood map
What this means for you Summary
Snapshot
- This is a 2 × 1-bed/1.0-bath units multifamily listed at $499k.
Deal economics
- At list price, monthly cash flow is $252 ($3k/yr) — positive. Per door: $126/mo.
- The deal already cash-flows at list — no discount required.
- To meet the 1% rule (rent ≥ 1% of price), the offer needs to be $407k (18.5% below list).
- Recommended offer: $407k (18.5% below list) — sets the bar for 1% rule.
- Cap rate 6.9% vs local median 2.1% in Los Angeles — top-decile yield for the area; either an underpriced asset or a hidden risk that comps aren't pricing in. Stress-test before assuming the spread holds.
Location & tenants
- Location reads 68/100 on livability (#273 in CA) — a middle-class / working-renter tenant base. Strengths: amenities A+, commute A+, employment B; Watch: health & safety C-, crime F, cost of living F.
- Los Angeles Unified (urban): math 29% / reading 54% proficiency, ranked #223 of 517 in CA (top 43%) — families likely to look elsewhere, expect single-tenant / working-renter base with shorter leases; 67% free/reduced lunch — lower-income household profile, screen leases tightly.
- Zoned schools: Fifty-Second Street Elementary (619 students, 98% FRL); John Muir Middle (693 students, 99% FRL); Augustus Hawkins High (math 17% / reading 27%, grade F, #950 of 1,170 statewide, top 82%, 1,179 students, 98% FRL) — zoned schools average 98% FRL vs 67% district-wide (31 pts higher); higher-poverty schools than district average — tighter screening recommended.
- Zoned-school proficiency averages 22% at this address vs 42% district-wide (-20 pts) — the specific schools serving this property underperform the Los Angeles Unified average; the district grade overstates school quality for this exact location.
- Market conditions: Rents rising (+1.7%/yr); 104 active listings in the ZIP; 40 comparable units currently listed for rent nearby; rentals at typical pace (median 27d on market — plan ~3-4 weeks tenant-placement turnaround); 19,697 units permitted in Los Angeles County in 2024 (9,426 in 5+ unit buildings).
Forward outlook
- Local home prices are declining (-3.0%/yr); year-one equity from $3k of loan paydown is wiped out by about $15k of value loss. Plan a longer hold.
- Los Angeles County population projected at +9% by 2050 — modest demand growth; plan on rents tracking national, not racing it.
Negotiation context
- It's been on market 17 days — a 2% lower offer ($492k) is reasonable based on typical stale-listing flexibility.
- 12 sale attempts since 20y ago with the ask held roughly flat each time — persistent listings suggest the price (not the market) is what's stuck; bring a comps-based counter.
- Current owner paid $129k; list at $499k implies a 287% gain — meaningful room to come down on a strong offer.
Risks & watch-outs
- Watch-outs: built in 1915 — expect roof / HVAC / electrical / plumbing capex.
- Climate carrying-cost: extreme-heat days projected 7→22/yr by 2055 (HVAC capex compounding) — expect insurance premiums to compound above CPI over the hold.
Questions for the listing agent
- Can we see the unit-by-unit rent roll, current vacancy, and any below-market leases? What's the average tenancy length?
- What capital expenditures (roof, boiler, parking lot, exteriors) have been made in the last 5 years, and what's planned in the next 2?
- Built in 1915 — when were the roof, HVAC, electrical panel, plumbing, and water heater last replaced?
- Is there a deadline driving the sale (1031 exchange, divorce, estate, relocation)? That informs how much negotiation room exists.
- Schools are D-rated, which usually means shorter tenancies and higher turnover. Who's the typical renter profile here, and what's been the actual vacancy rate?
- Crime grade is F in this area — have there been break-ins, vandalism, or insurance claims at this property in the last 3 years? What carrier currently insures it and at what premium?
- What's the average days-on-market for RENTAL listings here right now (not sales)? A rising rental-DOM trend means longer vacancies and softer asking-rent achievability than the comps imply.
- What's the recent tenant-quality profile in this submarket — average credit score on applications, eviction rate, late-payment / NSF rate, and stable-employment percentage? A property-management company in the area should have these aggregated.
- How much new apartment / multifamily construction is in the pipeline within 1–3 miles? Heavy new supply (>2% of stock underway) typically softens rents 12–24 months out; light construction supports rent growth.
Investment metrics
- 1% rule
- 0.82% ✗
- Cap rate
- 6.90%
- Cash-on-cash
- 2.17%
- DSCR
- 1.10
- GRM
- 10.2
CMA / ARV
- ARV (on-the-fly)
- $624,240
- Comps found
- 1
Show comp detail 1 sale within ~0.75 mi
| Address | Dist | Beds/Ba | Sqft | Sold | Price | $/sf | Match |
|---|---|---|---|---|---|---|---|
| 457 W 46th St | 0.66mi | 2/2.0 | 1,260 (+9%) | 11mo | $680,000 | $540 | 45 |
Match score weights: distance 35% · size 25% · config 20% · recency 20%. Top-matched comps best support the ARV.
Projected returns pro-forma
-3.0% appreciation · 1.69% rent growth · sell at horizon
- IRR
- -14.2%
- Equity multiple
- 0.50×
- Total profit
- $-70,330
- Equity at exit
- $74,403
- IRR
- -7.5%
- Equity multiple
- 0.55×
- Total profit
- $-62,680
- Equity at exit
- $43,144
Cash invested: $139,720 (down + closing). Projections, not guarantees.
Landlord ↔ Tenant lean methodology
- Overall (CITY)
- 0 Strongly Tenant-Friendly
- State California
- 18 Strongly Tenant-Friendly · D+13
- County
- — inherits STATE
- City Los Angeles
- 0 Strongly Tenant-Friendly · D+22
ZIP-level market 90037
- Rents YoY
- 1.7%
- Active inventory
- 104
- Price-to-rent
- 20.5×
Monthly cashflow live
- Estimated rent
- $4,067 high interval (Pro) →
- Mortgage (P&I)
- −$2,617
- Tax from tax record
- −$136 /mo · $1,633/yr
- Insurance
- −$208
- HOA
- −$0
- Vacancy / Maint / Mgmt
- −$854
- Net cashflow
- $252
Break-even live
Sensitivity live
| Price | -10% $535 | -5% $393 | +0% $252 | +5% $111 | +10% $-30 |
|---|---|---|---|---|---|
| Rent | -10% $-69 | -5% $92 | +0% $252 | +5% $413 | +10% $573 |
| Rate | -1.0pp $503 | -0.5pp $379 | base $252 | +0.5pp $123 | +1.0pp $-9 |
2-unit breakdown (identical units grouped — click to expand)
| Units | Beds | Baths | Est. rent |
|---|---|---|---|
| 2× units | 1 | 1 | $4,066 |
| #1 | 1 | 1 | $2,033 |
| #2 | 1 | 1 | $2,033 |
| Total (2 units) | $4,067 | ||
UW: 25.0% down · 7.5% · 30yr · 1.5% tax · 5.0% vac · 8.0% maint · 8.0% mgmt
Financing live
Cash to close
- Down payment
- $124,750
- Closing costs
- $14,970
- Reserves months
- —
- Total cash needed
- —
Loan-product check · same deal, 3 products live
Conventional
25% down · 7.5% · 30yr
- Down + closing
- —
- Monthly P&I
- —
- Monthly cashflow
- —
- DSCR
- —
- Eligible?
- —
Personal DTI + credit; lowest rate.
DSCR
20% down · 8.5% · 30yr
- Down + closing
- —
- Monthly P&I
- —
- Monthly cashflow
- —
- DSCR
- —
- Eligible?
- —
No personal income docs; deal must DSCR.
Hard money
10% down · 12.0% · 12mo
- Down + closing
- —
- Monthly P&I
- —
- Monthly cashflow
- —
- DSCR
- —
- Eligible?
- —
Short-term bridge; refi at stabilization.
Rent comps 40 comps
| Address | Beds | Baths | Sqft | Rent | $/sqft | DOM | Units | Dist |
|---|---|---|---|---|---|---|---|---|
| 844 W 54th St Los Angeles, CA | 3.0 | 2.0 | 900 | $2,895 | $3.22 | 18d | 1 | 0.16mi |
| 860 W 56th St Unit 1 Los Angeles, CA | 3.0 | 1.0 | 1344 | $2,995 | $2.23 | 18d | 1 | 0.22mi |
| 860 W 56th St Los Angeles, CA | 3.0 | 1.0 | 1344 | $2,849 | $2.12 | 1d | 1 | 0.22mi |
| 5847 Denver Ave Los Angeles, CA | 2.0 | 1.0 | 844 | $2,150 | $2.55 | 45d | 1 | 0.34mi |
| 5900 S Hoover St Apt 1 Los Angeles, CA | 2.0 | 2.0 | 1096 | $2,700 | $2.46 | 45d | 1 | 0.40mi |
| 326 1/2 W 51st St Los Angeles, CA | 3.0 | 1.0 | 1100 | $2,450 | $2.23 | 7d | 1 | 0.44mi |
| 326 W 51st St Los Angeles, CA | 3.0 | 1.5 | 1100 | $2,450 | $2.23 | 7d | 1 | 0.44mi |
| 324 1/2 W 51st St Los Angeles, CA | 3.0 | 1.0 | 1100 | $2,450 | $2.23 | 45d | 1 | 0.44mi |
| 1050 57th St Unit 105025 Los Angeles, CA | 3.0 | 1.0 | 1000 | $2,933 | $2.93 | 18d | 1 | 0.46mi |
| 1050 57th St Unit 25 Los Angeles, CA | 3.0 | 1.0 | 1000 | $2,566 | $2.57 | 1d | 1 | 0.46mi |
| 720 W 47th St Los Angeles, CA | 1.0 | 1.0 | 810 | $1,950 | $2.41 | 45d | 1 | 0.51mi |
| 1138 W 52nd St Los Angeles, CA | 2.0 | 1.5 | 750 | $2,500 | $3.33 | 26d | 1 | 0.53mi |
| 235 W 58th St Los Angeles, CA | 3.0 | 2.0 | 1225 | $4,250 | $3.47 | 45d | 1 | 0.54mi |
| 244 W 49th St Los Angeles, CA | 3.0 | 2.0 | 1212 | $3,100 | $2.56 | 45d | 1 | 0.59mi |
| 244 W 49th St Los Angeles, CA | 3.0 | 2.0 | 1212 | $3,100 | $2.56 | 9d | 1 | 0.59mi |
| 241 W 49th St Los Angeles, CA | 3.0 | 2.0 | 1200 | $2,900 | $2.42 | 14d | 1 | 0.61mi |
| 4506 1/2 S Hoover St Los Angeles, CA | 1.0 | 1.0 | 750 | $1,795 | $2.39 | 21d | 1 | 0.64mi |
| 6010 Kansas Ave Los Angeles, CA | 1.0 | 1.0 | 789 | $1,980 | $2.51 | 45d | 1 | 0.68mi |
| 1050 W 60th Pl Unit 1050 1/2 Los Angeles, CA | 2.0 | 1.0 | 800 | $1,795 | $2.24 | 26d | 1 | 0.70mi |
| 1052 W 60th Pl Los Angeles, CA | 2.0 | 1.0 | 850 | $1,995 | $2.35 | 26d | 1 | 0.71mi |
| 917 W 62nd Pl Unit 917 Los Angeles, CA | 3.0 | 1.0 | 1000 | $4,800 | $4.80 | 45d | 1 | 0.72mi |
| 708 W Vernon Ave Los Angeles, CA | 2.0 | 1.0 | 900 | $2,295 | $2.55 | 45d | 1 | 0.73mi |
| 1033 W 62nd St Los Angeles, CA | 2.0 | 1.0 | 725 | $2,500 | $3.45 | 26d | 1 | 0.76mi |
| 458 W Vernon Ave Unit 458 Los Angeles, CA | 1.0 | 1.0 | 900 | $1,825 | $2.03 | 45d | 1 | 0.76mi |
| 458 W Vernon Ave Unit 460 Los Angeles, CA | 2.0 | 1.0 | 960 | $2,250 | $2.34 | 45d | 1 | 0.76mi |
| 629 W Vernon Ave Unit 2 Los Angeles, CA | 3.0 | 1.0 | 1000 | $2,500 | $2.50 | 12d | 1 | 0.77mi |
| 847 W Gage Ave Unit 1 Los Angeles, CA | 3.0 | 2.0 | 1224 | $3,200 | $2.61 | 45d | 1 | 0.77mi |
| 847 W Gage Ave Los Angeles, CA | 3.0 | 2.0 | 1224 | $3,200 | $2.61 | 26d | 1 | 0.77mi |
| 1049 W 62nd St Unit 1049 Los Angeles, CA | 3.0 | 2.0 | 1129 | $3,695 | $3.27 | 5d | 1 | 0.78mi |
| 850 W Gage Ave Unit 850 Los Angeles, CA | 3.0 | 2.0 | 1281 | $3,199 | $2.50 | 7d | 1 | 0.80mi |
| 850 W Gage Ave Unit 852 Los Angeles, CA | 3.0 | 2.0 | 1201 | $3,071 | $2.56 | 9d | 1 | 0.80mi |
| 850 W Gage Ave Unit 850 Los Angeles, CA | 3.0 | 2.0 | 1281 | $2,999 | $2.34 | 1d | 1 | 0.80mi |
| 4502 S Broadway Unit 3 Los Angeles, CA | 2.0 | 1.0 | 718 | $1,950 | $2.72 | 45d | 1 | 0.80mi |
| 1217 W 60th Pl Los Angeles, CA | 2.0 | 1.0 | 864 | $2,800 | $3.24 | 45d | 1 | 0.81mi |
| 6336 Denver Ave Unit 3 Los Angeles, CA | 2.0 | 1.0 | 858 | $1,995 | $2.33 | 9d | 1 | 0.82mi |
| 1219 W 47th St Los Angeles, CA | 2.0 | 1.0 | 750 | $2,500 | $3.33 | 45d | 1 | 0.82mi |
| 841 W 64th St Unit 8415 Los Angeles, CA | 3.0 | 2.0 | 800 | $2,725 | $3.41 | 26d | 1 | 0.83mi |
| 855 W 43rd Pl Los Angeles, CA | 2.0 | 1.0 | 1150 | $2,349 | $2.04 | 9d | 1 | 0.83mi |
| 855 1/2 W 43rd Pl Los Angeles, CA | 2.0 | 1.0 | 1150 | $2,399 | $2.09 | 7d | 1 | 0.84mi |
| 807 W 43rd St Unit 811 Los Angeles, CA | 3.0 | 1.0 | 1200 | $2,850 | $2.38 | 26d | 1 | 0.88mi |
Listing history 8 events
-
2026-06-17days on market $499,000 Active 17 DOM
-
2026-06-16days on market $499,000 Active 16 DOM
-
2026-06-15days on market $499,000 Active 15 DOM
-
2026-06-13days on market $499,000 Active 13 DOM
-
2026-06-09days on market $499,000 Active 9 DOM
-
2026-06-08days on market $499,000 Active 8 DOM
-
2026-06-07remarks 699-char remark
-
2026-06-07$499,000 Active 7 DOM
ⓘ Source: listings_history table (triggers on properties + properties_extension) + one-shot
backfill from property_details.listing_events for pre-trigger history.
Tax reassessment forecast CA · Resets to sale price
- Current annual tax
- $1,633 · $136/mo
- Projected year-2 tax
- $3,792 · $316/mo
- Expected delta
- +$2,160/yr (+$180/mo · 132.3%)
ⓘ Screening estimate from a state-policy table — verify with the county assessor before closing.
Climate risk First Street
- Flood 1/10 Low FEMA zone X (unshaded) · 0% chance over 30 yrs
- Wildfire 1/10 Low
- Heat 5/10 Major 7 d/yr ≥88°F today · 22 d/yr by 30 yrs out
- Wind 1/10 Low
- Air quality 5/10 Major 7 unhealthy d/yr today · 7 by 30 yrs out
Nearby sold comps map
Loading sold comps map…
Walkable amenities ~0.75 mi
Loading nearby amenities…
Taxation est. · year 1
- Rental income
- $48,804
- − Mortgage interest
- −$27,952
- − Property taxes
- −$1,633
- − Insurance
- −$2,495
- − Repairs & maintenance
- −$3,904
- − Management
- −$3,904
- − Depreciation
- −$14,516
- Taxable loss
- −$5,600
- Est. tax savings @ 24.0%
- +$1,344
- After-tax cash flow
- $4,370/yr
For passive investors: Depreciation is non-cash, so a rental often shows a tax loss while cash-flowing — sheltering income. Rental losses are passive: they offset passive income freely, and up to $25,000/yr can offset ordinary (W-2) income if you actively participate and your MAGI is under $100k (phasing out to $0 by $150k); unused losses carry forward. On sale, claimed depreciation is recaptured at up to 25%, and gains may owe capital-gains tax (a 1031 exchange can defer both). Figures are a year-1 estimate at your 24.0% rate — not tax advice; consult a CPA.
Schools (NCES district)
- District
- Los Angeles Unified
- NCES district ID
- 0622710
- Math proficiency
- 29% ▼ -4.00%
- Reading proficiency
- 54% ▲ 10.00%
- Median HH income
- $50,403
- Composite
- 35.67/100
- National rank
- #4875
- State rank
- #223 of 517 in CA
Livability — Los Angeles
- Score
- 68/100
- State rank
- #273
- US rank
- #9237
Category grades
Schools grade is shown separately in the Schools card above.
Census & demographics
- Census place
- Los Angeles, CA
- County
- Los Angeles County · 9,444,647 people
- City population
- 3,838,149
- Metro
- Los Angeles-Long Beach-Anaheim, CA
- Population (ZIP)
- 65,482
- Household income
- $57,622
- Rent vs Own
- Severe rent burden
- 4200.0
Population outlook (Los Angeles County) Hauer SSP2
- Today (2025)
- 10,940,515 people
- By 2030
- 11,256,481 · +2.9%
- By 2040
- 11,729,929 · +7.2%
- By 2050
- 11,948,407 · +9.2%
- By 2075
- 11,818,114 · +8.0%
- By 2100
- 10,842,928 · -0.9%
Race, ethnicity, and origin ACS 2023
- Neighborhood character
- Predominantly Hispanic (80%)
- Race & ethnicity
- Hispanic / Latino 80% Two or more races 15% Black 15% Native American 3% White 2% Asian 1%
- Hispanic origin (detail)
- Mexican 43%
- Common ancestry
- British 1%
- Foreign-born
- 44% · Canada, South Korea
- Languages at home
- 23% English-only · Spanish 74% Korean 1% French/Haitian/Cajun 1%
Political lean MEDSL · Los Angeles
- 2024 margin
- Solid D (+32.9) · D 64.8% · R 31.9% · Other 3.3%
- 2008→2024 swing
- -7.4pp toward R · 2008: 40.4pp · 2024: 32.9pp
- All cycles
- 2024: D+32.9 2020: D+44.2 2016: D+48.0 2012: D+40.0 2008: D+40.4
Not yet ingested
- Civics
- —
Market trends
- HPI YoY
- ▼ -639.09%
- Current HPI
- 467.0371
- Rent YoY
- ▲ 1.69%
- Metro
- Los Angeles-Long Beach-Anaheim, CA
- State GDP YoY
- ▲ 3.21%
- F500 in state
- 116
Industry mix (Fortune 500 HQ in CA)
| Industry | F500 HQs | Revenue |
|---|---|---|
| Technology | 27 | $1,492B |
|
||
| Financial Services | 3 | $174B |
|
||
| Retail | 3 | $44B |
|
||
| Insurance | 3 | $26B |
|
||
| Media / Entertainment | 2 | $115B |
|
||
| Pharmaceuticals / Biotech | 2 | $62B |
|
||
Price history
+349.5% since first listed33 events — show timeline
- 2026-06-05 Relisted — CRMLS
- 2026-05-16 Listed $499,000 CRMLS
- 2026-05-14 Coming Soon $499,000 CRMLS
- 2026-04-27 Listing Removed — CRMLS
- 2025-10-28 Listed $649,000 CRMLS
- 2009-12-15 Sold (Public Records) $129,000 Public Records
- 2009-12-15 Sold (MLS) $128,900 CRMLS
- 2009-11-18 Pending — CRMLS
- 2009-11-04 Relisted — CRMLS
- 2009-11-04 Pending — CRMLS
- 2009-10-29 Price Changed $128,900 CRMLS
- 2009-10-29 Relisted — CRMLS
- 2009-10-25 Pending — CRMLS
- 2009-10-20 Pending — CRMLS
- 2009-09-30 Price Changed $136,900 CRMLS
- 2009-09-30 Relisted — CRMLS
- 2009-09-08 Pending — CRMLS
- 2009-08-06 Listed $153,900 CRMLS
- 2009-03-04 Listing Removed — CRMLS
- 2008-12-03 Listed $199,999 CRMLS
- 2008-12-01 Listing Removed — CRMLS
- 2008-03-24 Listed $242,857 CRMLS
- 2007-07-03 Sold (MLS) $455,000 TheMLS
- 2007-07-02 Sold (Public Records) $455,000 Public Records
- 2007-04-25 Delisted — TheMLS
- 2007-01-08 Listed $449,000 TheMLS
- 2007-01-08 Delisted — TheMLS
- 2006-08-24 Listing Removed — CRMLS
- 2006-06-23 Listed $489,000 CRMLS
- 2006-05-09 Listed — TheMLS
- 2006-01-09 Sold (Public Records) $350,000 Public Records
- 2004-10-12 Sold (Public Records) $338,000 Public Records
- 2004-05-11 Sold (Public Records) $111,000 Public Records
Property tax history
-6.2%/yrLatest (2025): $1,633 · +2.1% YoY. Source: county tax records.
Cash-flow waterfall
monthlySold comps — $/sqft
last 12 mo · ≤1 miLoading sold comps…