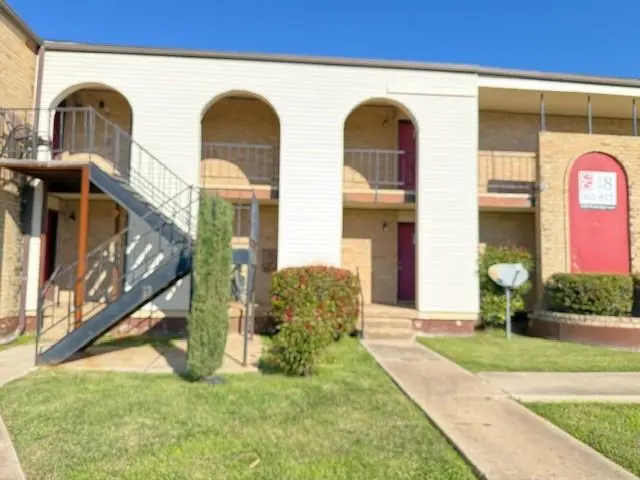
6000 Westridge Ln #802 · Fort Worth, TX
Flood risk 6/10 · Moderate
- FEMA flood zone
- X (unshaded)
- Chance of flooding over 30 yrs
- 0.74%
- Est. flood insurance / yr
- $507 – $1,088
Fire risk 1/10 · Minimal
- Est. fire insurance / yr
- $1,222 – $2,270
Heat risk 8/10 · Major
- Hot days now (above 108°F)
- 7 days/yr
- Hot days in 30 yrs
- 24 days/yr
Wind risk 4/10 · Minor
- Chance of severe wind over 30 yrs
- 21.0%
Air-quality risk 3/10 · Minor
- Unhealthy air days now
- 2 days/yr
- Unhealthy air days in 30 yrs
- 3 days/yr
Risk factors via First Street. Map © Google.
Why this score? — see what drove the C- grade
The composite is a weighted blend of 9 inputs, each scored 0–100. Each bar is that input's sub-score; the figure is the points it added to the 100-point composite (weight × sub-score).
- Cash flow +15.7/30.0
- ARV discount +10.1/15.0
- 1% rule +10.0/10.0
- DSCR +4.8/10.0
- Livability +4.0/5.0
- Rent growth +2.9/5.0
- Condition / age +2.5/5.0
- Schools +2.0/10.0
- Appreciation +0.0/10.0
$114,000
🖨 Deal sheet 📄 Offer letter ✓ Due diligence
Listing remarks MLS
MOVE IN READY!! Don't miss this opportunity to own a well priced 3 bedroom, 2 bath condo located on the second floor. Spacious and beautiful with plenty of room for entertainment. Windows recently replaced throughout. Fresh Paint throughout. Conveniently located near major freeways, Shops at Clearfork, Trinity River Trails, TCU and Downtown.
Key facts
- Fresh paint
- Move in ready
- Conveniently located
Tags
Neighborhood map
What this means for you Summary
Snapshot
- This is a 2-bed/1.0-bath condo listed at $114k.
Deal economics
- At list price, monthly cash flow is $50 ($595/yr) — positive.
- The deal already cash-flows at list — no discount required.
- Meets the 1% rule at list price ($2k rent vs $114k).
- Recommended offer: $100k (12.0% below list) — sets the bar for market timing.
- Cap rate 6.8% vs local median 3.9% in Fort Worth — top-decile yield for the area; either an underpriced asset or a hidden risk that comps aren't pricing in. Stress-test before assuming the spread holds.
Location & tenants
- Location reads 80/100 on livability (#49 in TX, #1,954 nationally) — a professional / high-income tenant draw. Strengths: amenities A+, cost of living A+, housing A+; Watch: schools D+, crime F.
- Fort Worth ISD (urban): math 18% / reading 28% proficiency, ranked #742 of 826 in TX (top 90%) — low school quality limits family demand, transient renter base, plan for 1-2y turnover; 73% free/reduced lunch — lower-income household profile, screen leases tightly.
- Market conditions: Rents rising (+1.8%/yr); 209 active listings in the ZIP; 36 comparable units currently listed for rent nearby; rentals leasing fast (median 12d on market — plan ~1-2 weeks tenant-placement turnaround); 18,938 units permitted in Tarrant County in 2024 (8,336 in 5+ unit buildings).
- This rent runs 39% of the median local income ($56k/yr) — at the standard rent-burdened threshold; future hikes will face affordability resistance.
Forward outlook
- Local home prices are declining (-3.0%/yr); year-one equity from $788 of loan paydown is wiped out by about $3k of value loss. Plan a longer hold.
- Tarrant County population projected at +41% by 2050 — long-run rental-demand tailwind backs the buy-and-hold thesis.
Negotiation context
- It's been on market 191 days — a 12% lower offer ($100k) is reasonable based on typical stale-listing flexibility.
- 2 sale attempts since 2y ago; this cycle's ask has dropped $13k (10%) from the opening price — seller is motivated, your offer sets the floor, not the list.
Risks & watch-outs
- Watch-outs: HOA is 29% of rent.
- Climate carrying-cost: major flood risk; extreme-heat days projected 7→24/yr by 2055 (HVAC capex compounding) — expect insurance premiums to compound above CPI over the hold.
Questions for the listing agent
- It's been on market 191 days. Have you received any prior offers? Is the seller open to a 12% concession, seller financing, or rate buy-down credit?
- Built in 1969 — when were the roof, HVAC, electrical panel, plumbing, and water heater last replaced?
- What does the HOA fee cover, when was the last increase, and are there any pending special assessments or reserve-fund shortfalls?
- Any open or pending special assessments — roof, HVAC, plumbing, elevator, façade? What's the per-unit balance and payoff schedule, and is the seller paying it off at close or rolling it to the buyer?
- Why hasn't it sold? Are there any deal-killer items the seller is aware of (foundation, flood, title, zoning, code violations)?
- Is there a deadline driving the sale (1031 exchange, divorce, estate, relocation)? That informs how much negotiation room exists.
- Schools are D-rated, which usually means shorter tenancies and higher turnover. Who's the typical renter profile here, and what's been the actual vacancy rate?
- Crime grade is F in this area — have there been break-ins, vandalism, or insurance claims at this property in the last 3 years? What carrier currently insures it and at what premium?
- What's the average days-on-market for RENTAL listings here right now (not sales)? A rising rental-DOM trend means longer vacancies and softer asking-rent achievability than the comps imply.
- What's the recent tenant-quality profile in this submarket — average credit score on applications, eviction rate, late-payment / NSF rate, and stable-employment percentage? A property-management company in the area should have these aggregated.
- How much new apartment / multifamily construction is in the pipeline within 1–3 miles? Heavy new supply (>2% of stock underway) typically softens rents 12–24 months out; light construction supports rent growth.
Investment metrics
- 1% rule
- 1.61% ✓
- Cap rate
- 6.81%
- Cash-on-cash
- 1.86%
- DSCR
- 1.08
- GRM
- 5.2
CMA / ARV
- ARV (median comp)
- $121,107
- List price
- $114,000
- Delta
- -5.87%
- Verdict
- FAIR
- Comps
- 20 within 1.0 mi
Projected returns pro-forma
-3.0% appreciation · 1.77% rent growth · sell at horizon
- IRR
- -15.3%
- Equity multiple
- 0.46×
- Total profit
- $-17,155
- Equity at exit
- $16,998
- IRR
- -10.2%
- Equity multiple
- 0.43×
- Total profit
- $-18,209
- Equity at exit
- $9,857
Cash invested: $31,920 (down + closing). Projections, not guarantees.
Landlord ↔ Tenant lean methodology
- Overall (STATE)
- 87 Strongly Landlord-Friendly
- State Texas
- 87 Strongly Landlord-Friendly · R+5
- County
- — inherits STATE
- City
- — inherits STATE
ZIP-level market 76116
- Rents YoY
- 1.8%
- Active inventory
- 209
- Price-to-rent
- 5.2×
Monthly cashflow live
- Estimated rent
- $1,833 high interval (Pro) →
- Mortgage (P&I)
- −$598
- Tax from tax record
- −$219 /mo · $2,627/yr
- Insurance
- −$48
- HOA
- −$534
- Vacancy / Maint / Mgmt
- −$385
- Net cashflow
- $50
Break-even live
UW: 25.0% down · 7.5% · 30yr · 1.5% tax · 5.0% vac · 8.0% maint · 8.0% mgmt
Financing live
Cash to close
- Down payment
- $28,500
- Closing costs
- $3,420
- Reserves months
- —
- Total cash needed
- —
Loan-product check · same deal, 3 products live
Conventional
25% down · 7.5% · 30yr
- Down + closing
- —
- Monthly P&I
- —
- Monthly cashflow
- —
- DSCR
- —
- Eligible?
- —
Personal DTI + credit; lowest rate.
DSCR
20% down · 8.5% · 30yr
- Down + closing
- —
- Monthly P&I
- —
- Monthly cashflow
- —
- DSCR
- —
- Eligible?
- —
No personal income docs; deal must DSCR.
Hard money
10% down · 12.0% · 12mo
- Down + closing
- —
- Monthly P&I
- —
- Monthly cashflow
- —
- DSCR
- —
- Eligible?
- —
Short-term bridge; refi at stabilization.
Rent comps 36 comps
| Address | Beds | Baths | Sqft | Rent | $/sqft | DOM | Units | Dist |
|---|---|---|---|---|---|---|---|---|
| 6037 Westridge Ln Unit 6070 Fort Worth, TX | 3.0 | 2.0 | 1600 | $1,492 | $0.93 | 43d | 1 | 0.13mi |
| 6037 Westridge Ln Unit 3121 Fort Worth, TX | 3.0 | 2.0 | 1600 | $1,449 | $0.91 | 3d | 1 | 0.13mi |
| 4900 Bryant Irvin Rd N Unit 612 Fort Worth, TX | 3.0 | 2.0 | 1235 | $1,529 | $1.24 | 22d | 1 | 0.17mi |
| 4900 Bryant Irvin Rd N Unit 4933 Fort Worth, TX | 3.0 | 2.0 | 1235 | $1,580 | $1.28 | 11d | 1 | 0.17mi |
| 2500 River Park Dr Fort Worth, TX | 1.0–2.0 | 1.0–2.0 | 1006 | $2,686 | $2.67 | 2d | 19 | 0.18mi |
| 4900 Bryant Irvin Rd N Unit 3121 Fort Worth, TX | 3.0 | 2.0 | 1235 | $1,537 | $1.24 | 3d | 1 | 0.20mi |
| 2751 River Park Dr Fort Worth, TX | 1.0–3.0 | 1.0–2.0 | 1024 | $1,900 | $1.85 | 1d | 43 | 0.42mi |
| 5729 Blackmore Ave Fort Worth, TX | 3.0 | 2.0 | 1232 | $1,645 | $1.34 | 43d | 1 | 0.63mi |
| 3100 Camellia Rose Dr #110 Fort Worth, TX | 2.0 | 2.0 | 1658 | $3,000 | $1.81 | 43d | 1 | 0.70mi |
| 3101 River Park Dr Fort Worth, TX | 1.0–3.0 | 1.0–2.0 | 1110 | $1,515 | $1.36 | 1d | 32 | 0.76mi |
| 4945 Gage Ave Fort Worth, TX | 3.0 | 1.0–3.0 | 1217 | $3,381 | $2.78 | 1d | 45 | 0.80mi |
| 3212 Riverwood Dr Fort Worth, TX | 3.0 | 3.0 | 2299 | $3,800 | $1.65 | 43d | 1 | 0.82mi |
| 5828 Arborlawn Dr Fort Worth, TX | 2.0 | 1.0–2.5 | 1006 | $2,904 | $2.89 | 1d | 41 | 0.85mi |
| 3228 Riverwood Dr Fort Worth, TX | 3.0 | 2.0 | 2112 | $3,750 | $1.78 | 15d | 1 | 0.87mi |
| 4900 Gage Ave Fort Worth, TX | 1.0–3.0 | 1.0–2.0 | 1128 | $4,238 | $3.76 | 1d | 42 | 0.89mi |
| 3964 Watercourse Dr Fort Worth, TX | 3.0 | 1.0–2.0 | 1028 | $2,323 | $2.26 | 1d | 31 | 0.95mi |
| 3451 River Park Dr Unit 3121 Fort Worth, TX | 3.0 | 2.0 | 1282 | $1,977 | $1.54 | 3d | 1 | 1.02mi |
| 3451 River Park Dr Unit 3484 Fort Worth, TX | 3.0 | 2.0 | 1282 | $2,166 | $1.69 | 43d | 1 | 1.02mi |
| 3450 River Park Dr Fort Worth, TX | 1.0–3.0 | 1.0–2.0 | 1050 | $1,573 | $1.50 | 2d | 17 | 1.03mi |
| 3601 Westridge Ave Unit 3634 Fort Worth, TX | 3.0 | 2.0 | 1299 | $2,031 | $1.56 | 43d | 1 | 1.05mi |
| 3601 Westridge Ave Unit 3121 Fort Worth, TX | 3.0 | 2.0 | 1408 | $1,953 | $1.39 | 3d | 1 | 1.05mi |
| 4620 Angus Dr Fort Worth, TX | 3.0 | 2.5 | 1668 | $2,195 | $1.32 | 43d | 1 | 1.05mi |
| 5108 Kilpatrick Ave Fort Worth, TX | 3.0 | 2.0 | 1298 | $1,975 | $1.52 | 2d | 1 | 1.21mi |
| 6400 Greenway Rd Fort Worth, TX | 3.0 | 2.0 | 1768 | $2,150 | $1.22 | 24d | 1 | 1.26mi |
| 4600 Bellaire Dr S Unit 4633 Fort Worth, TX | 3.0 | 2.0 | 1447 | $2,771 | $1.91 | 43d | 1 | 1.28mi |
| 4600 Bellaire Dr S Unit 3121 Fort Worth, TX | 3.0 | 2.0 | 1447 | $2,972 | $2.05 | 3d | 1 | 1.28mi |
| 6948 Valhalla Rd Fort Worth, TX | 3.0 | 3.0 | 1794 | $2,095 | $1.17 | 24d | 1 | 1.33mi |
| 5855 Pecan Chase Fort Worth, TX | 3.0 | 3.0 | 2231 | $2,295 | $1.03 | 6d | 1 | 1.33mi |
| 4600 Bellaire Dr S Fort Worth, TX | 3.0 | 2.0 | 1447 | $3,151 | $2.18 | 4d | 1 | 1.33mi |
| 7017 Willis Ave Fort Worth, TX | 2.0 | 2.0 | 1267 | $2,395 | $1.89 | 43d | 1 | 1.38mi |
| 6428 Lago Vista Dr Benbrook, TX | 2.0 | 2.5 | 1700 | $1,750 | $1.03 | 5d | 1 | 1.39mi |
| 4132 Rothington Rd Fort Worth, TX | 1.0 | 1.0 | 1895 | $790 | $0.42 | 24d | 1 | 1.42mi |
| 3913 Micki Lynn Ave Fort Worth, TX | 2.0 | 2.0 | 1644 | $2,300 | $1.40 | 15d | 1 | 1.44mi |
| 4713 Driskell Blvd Fort Worth, TX | 3.0 | 2.0 | 1566 | $1,850 | $1.18 | 43d | 1 | 1.47mi |
| 5036 Diaz Ave Fort Worth, TX | 3.0 | 2.5 | 1231 | $1,995 | $1.62 | 5d | 1 | 1.48mi |
| 5808 Locke Ave Fort Worth, TX | 3.0 | 2.0 | 1619 | $2,500 | $1.54 | 43d | 1 | 1.48mi |
HOA detail condo
- Monthly dues
- $534 · $6,408/yr
- Assessments
- None detected in remarks — confirm with the listing agent.
Listing history 21 events
-
2026-06-18days on market $114,000 Active 191 DOM
-
2026-06-17days on market $114,000 Active 190 DOM
-
2026-06-16days on market $114,000 Active 189 DOM
-
2026-06-15days on market $114,000 Active 188 DOM
-
2026-06-13days on market $114,000 Active 186 DOM
-
2026-06-09days on market $114,000 Active 182 DOM
-
2026-06-08days on market $114,000 Active 181 DOM
-
2026-06-07days on market $114,000 Active 180 DOM
-
2026-06-04days on market $114,000 Active 177 DOM
-
2026-06-03days on market $114,000 Active 176 DOM
-
2026-06-02days on market $114,000 Active 175 DOM
-
2026-06-02days on market $114,000 Active 174 DOM
-
2026-05-31days on market $114,000 Active 173 DOM
-
2026-03-18price $114,000 343-char remark
Show marketing remark (343 chars)
MOVE IN READY!! Don't miss this opportunity to own a well priced 3 bedroom, 2 bath condo located on the second floor. Spacious and beautiful with plenty of room for entertainment. Windows recently replaced throughout. Fresh Paint throughout. Conveniently located near major freeways, Shops at Clearfork, Trinity River Trails, TCU and Downtown.
-
2025-12-09$127,000 Active 343-char remark
Show marketing remark (343 chars)
MOVE IN READY!! Don't miss this opportunity to own a well priced 3 bedroom, 2 bath condo located on the second floor. Spacious and beautiful with plenty of room for entertainment. Windows recently replaced throughout. Fresh Paint throughout. Conveniently located near major freeways, Shops at Clearfork, Trinity River Trails, TCU and Downtown.
-
2024-10-24historical
-
2024-07-31price $140,000
-
2024-05-20$150,000 Active
-
2013-08-28soldstatus
-
1990-01-31soldstatus
-
1989-03-07soldstatus
ⓘ Source: listings_history table (triggers on properties + properties_extension) + one-shot
backfill from property_details.listing_events for pre-trigger history.
Tax reassessment forecast TX · Resets to sale price
- Current annual tax
- $2,627 · $219/mo
- Projected year-2 tax
- $2,627 · $219/mo
- Expected delta
- $0/yr ($0/mo · 0.0%)
ⓘ Screening estimate from a state-policy table — verify with the county assessor before closing.
Climate risk First Street
- Flood 6/10 Major FEMA zone X (unshaded) · 74% chance over 30 yrs
- Wildfire 1/10 Low
- Heat 8/10 Severe 7 d/yr ≥108°F today · 24 d/yr by 30 yrs out
- Wind 4/10 Moderate 21% chance of damaging wind over 30 yrs
- Air quality 3/10 Moderate 2 unhealthy d/yr today · 3 by 30 yrs out
Nearby sold comps map
Loading sold comps map…
Walkable amenities ~0.75 mi
Loading nearby amenities…
Taxation est. · year 1
- Rental income
- $21,992
- − Mortgage interest
- −$6,386
- − Property taxes
- −$2,627
- − Insurance
- −$570
- − Repairs & maintenance
- −$1,759
- − Management
- −$1,759
- − HOA
- −$6,408
- − Depreciation
- −$3,316
- Taxable loss
- −$834
- Est. tax savings @ 24.0%
- +$200
- After-tax cash flow
- $795/yr
For passive investors: Depreciation is non-cash, so a rental often shows a tax loss while cash-flowing — sheltering income. Rental losses are passive: they offset passive income freely, and up to $25,000/yr can offset ordinary (W-2) income if you actively participate and your MAGI is under $100k (phasing out to $0 by $150k); unused losses carry forward. On sale, claimed depreciation is recaptured at up to 25%, and gains may owe capital-gains tax (a 1031 exchange can defer both). Figures are a year-1 estimate at your 24.0% rate — not tax advice; consult a CPA.
Schools (NCES district)
- District
- Fort Worth ISD
- NCES district ID
- 4819700
- Math proficiency
- 18% ▼ -16.00%
- Reading proficiency
- 28% ▼ -6.00%
- Median HH income
- $42,109
- Composite
- 19.61/100
- National rank
- #8753
- State rank
- #742 of 826 in TX
Livability — Fort Worth
- Score
- 80/100
- State rank
- #49
- US rank
- #1954
Category grades
Schools grade is shown separately in the Schools card above.
Census & demographics
- Census place
- Fort Worth, TX
- County
- Tarrant County · 2,033,669 people
- City population
- 911,619
- Metro
- Dallas-Fort Worth-Arlington, TX
- Population (ZIP)
- 49,856
- Household income
- $56,187
- Rent vs Own
- Severe rent burden
- 4188.0
Population outlook (Tarrant County) Hauer SSP2
- Today (2025)
- 2,380,417 people
- By 2030
- 2,578,900 · +8.3%
- By 2040
- 2,974,995 · +25.0%
- By 2050
- 3,350,489 · +40.8%
- By 2075
- 4,216,909 · +77.2%
- By 2100
- 4,741,527 · +99.2%
Race, ethnicity, and origin ACS 2023
- Neighborhood character
- Diverse neighborhood (Simpson 0.66)
- Race & ethnicity
- White 48% Hispanic / Latino 27% Black 20% Two or more races 11% Asian 2%
- Hispanic origin (detail)
- Mexican 22% Puerto Rican 1%
- Common ancestry
- Italian 2% Slovak 1% Lithuanian 1%
- Foreign-born
- 10% · Canada, China
- Languages at home
- 79% English-only · Spanish 17% Other Indo-European 1% Chinese 1%
Political lean MEDSL · Tarrant
- 2024 margin
- Lean R (+5.1) · D 46.7% · R 51.9% · Other 1.4%
- 2008→2024 swing
- +6.6pp toward D · 2008: -11.7pp · 2024: -5.1pp
- All cycles
- 2024: R+5.1 2020: D+0.2 2016: R+8.7 2012: R+15.7 2008: R+11.7
Not yet ingested
- Civics
- —
Market trends
- HPI YoY
- ▼ -283.10%
- Current HPI
- 282.3806
- Rent YoY
- ▲ 1.77%
- Metro
- Dallas-Fort Worth-Arlington, TX
- State GDP YoY
- ▲ 3.95%
- F500 in state
- 110
Industry mix (Fortune 500 HQ in TX)
| Industry | F500 HQs | Revenue |
|---|---|---|
| Energy | 16 | $1,198B |
|
||
| Technology | 5 | $198B |
|
||
| Engineering / Construction | 4 | $72B |
|
||
| Energy Services | 3 | $60B |
|
||
| Utilities | 3 | $41B |
|
||
| Healthcare | 2 | $330B |
|
||
Price history
-24.0% since first listed8 events — show timeline
- 2026-03-18 Price Changed $114,000 NTREIS
- 2025-12-09 Listed $127,000 NTREIS
- 2024-10-24 Listing Removed — NTREIS
- 2024-07-31 Price Changed $140,000 NTREIS
- 2024-05-20 Listed $150,000 NTREIS
- 2013-08-28 Sold (Public Records) — Public Records
- 1990-01-31 Sold (Public Records) — Public Records
- 1989-03-07 Sold (Public Records) — Public Records
Property tax history
+6.7%/yrLatest (2025): $2,627 · -2.4% YoY. Source: county tax records.
Cash-flow waterfall
monthlySold comps — $/sqft
last 12 mo · ≤1 miLoading sold comps…