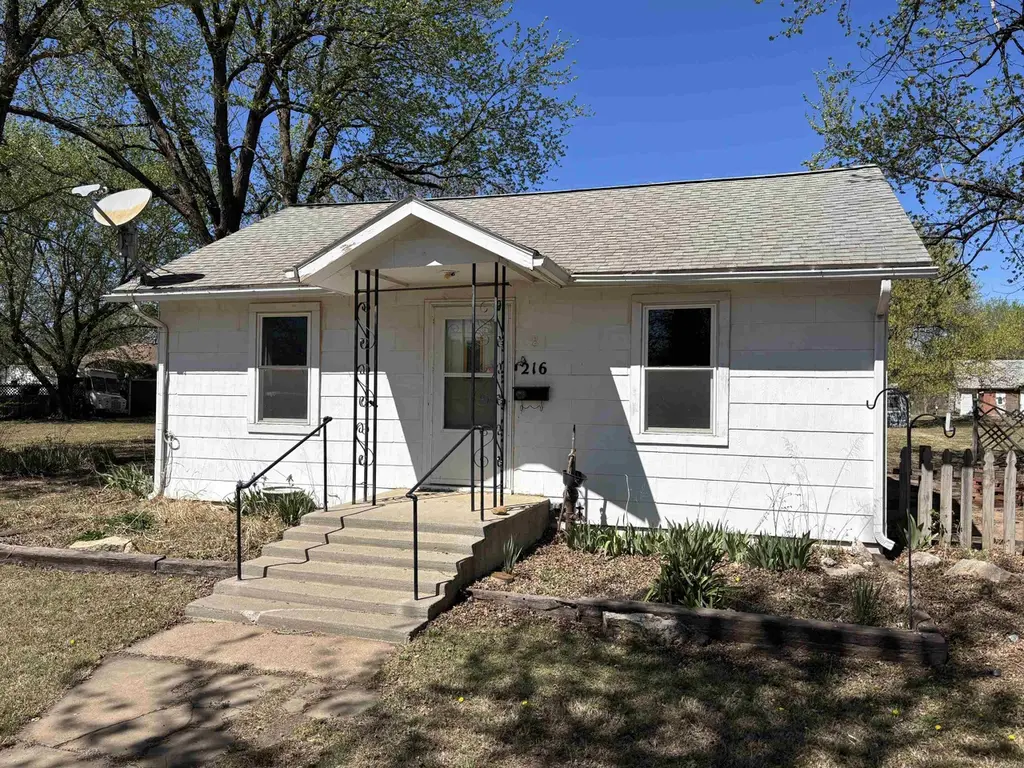
216 E 8th St · Harper, KS
Flood risk 1/10 · Minimal
- FEMA flood zone
- —
- Chance of flooding over 30 yrs
- 0.0%
- Est. flood insurance / yr
- —
Fire risk 2/10 · Minimal
- Est. fire insurance / yr
- $1,154 – $2,142
Heat risk 5/10 · Moderate
- Hot days now (above 107°F)
- 7 days/yr
- Hot days in 30 yrs
- 16 days/yr
Wind risk 2/10 · Minimal
- Chance of severe wind over 30 yrs
- —
Air-quality risk 2/10 · Minimal
- Unhealthy air days now
- 1 days/yr
- Unhealthy air days in 30 yrs
- 1 days/yr
Risk factors via First Street. Map © Google.
Why this score? — see what drove the B grade
The composite is a weighted blend of 9 inputs, each scored 0–100. Each bar is that input's sub-score; the figure is the points it added to the 100-point composite (weight × sub-score).
- Cash flow +29.1/30.0
- DSCR +10.0/10.0
- 1% rule +8.0/10.0
- Appreciation +7.7/10.0
- ARV discount +7.5/15.0
- Livability +3.6/5.0
- Rent growth +2.5/5.0
- Schools +2.5/10.0
- Condition / age +2.5/5.0
$60,000
🖨 Deal sheet 📄 Offer letter ✓ Due diligence
Key facts
- Laundry mud room
- Open concept
- Large lot
Tags
Property features AI
Exterior
- Parking: 2-car garage
- Utilities: Public water; Sewer available; Natural gas available
- Home design: On-site built single-family home; Composition roof
- Construction: Cellar foundation
- Exterior features: One level; Wood fencing; Outbuilding on the property
Interior
- Bathrooms: 1 full bathroom
- Heating & cooling: Floor furnace heating; Wall/window air conditioning units
- Interior features: Cellar basement; Separate main-floor laundry room; No built-in appliances listed
- Laundry & utility: Main-floor laundry in a separate room
Neighborhood map
What this means for you Summary
Snapshot
- This is a 1-bed/1.0-bath single-family listed at $60k.
Deal economics
- At list price, monthly cash flow is $208 ($2k/yr) — positive.
- The deal already cash-flows at list — no discount required.
- Meets the 1% rule at list price ($778 rent vs $60k).
- Recommended offer: $58k (3.0% below list) — sets the bar for market timing.
Location & tenants
- Location reads 72/100 on livability (#106 in KS) — a middle-class / working-renter tenant base. Strengths: cost of living A+, housing A+, health & safety A+; Watch: employment D+, amenities F, commute F.
- Chaparral Schools (rural): math 29% / reading 29% proficiency, ranked #110 of 169 in KS (top 65%) — low school quality limits family demand, transient renter base, plan for 1-2y turnover.
- Zoned schools: Harper Elem (math 42% / reading 37%, grade F, #321 of 684 statewide, top 52%, 251 students, 67% FRL); Chaparral Jr/Sr High (math 12% / reading 17%, grade F, #267 of 327 statewide, top 84%, 350 students, 64% FRL).
- Market conditions: 15 active listings in the ZIP; 6 units permitted in Harper County in 2024 (0 in 5+ unit buildings).
Forward outlook
- In year one you build about $4k of equity ($415 loan paydown + $3k appreciation (5.4% local appreciation)).
- Harper County population projected at -14% by 2050 — secular population decline; favor cash flow + early exit over multi-decade hold.
- At projected returns (5.4% appreciation + 3.0% rent growth), your $17k cash investment doubles in ~3 years — after that, you're playing with house money.
- By year 9, paydown + projected appreciation supports a ~$32k cash-out refi (75% LTV) — recoverable capital for the next deal without selling this one.
Negotiation context
- It's been on market 59 days — a 3% lower offer ($58k) is reasonable based on typical stale-listing flexibility.
Risks & watch-outs
- Watch-outs: built in 1940 — expect roof / HVAC / electrical / plumbing capex.
- Climate carrying-cost: extreme-heat days projected 7→16/yr by 2055 (HVAC capex compounding) — expect insurance premiums to compound above CPI over the hold.
Questions for the listing agent
- It's been on market 59 days. Have you received any prior offers? Is the seller open to a 3% concession, seller financing, or rate buy-down credit?
- Built in 1940 — when were the roof, HVAC, electrical panel, plumbing, and water heater last replaced?
- Is there a deadline driving the sale (1031 exchange, divorce, estate, relocation)? That informs how much negotiation room exists.
- Schools are D-rated, which usually means shorter tenancies and higher turnover. Who's the typical renter profile here, and what's been the actual vacancy rate?
- What's the average days-on-market for RENTAL listings here right now (not sales)? A rising rental-DOM trend means longer vacancies and softer asking-rent achievability than the comps imply.
- What's the recent tenant-quality profile in this submarket — average credit score on applications, eviction rate, late-payment / NSF rate, and stable-employment percentage? A property-management company in the area should have these aggregated.
- How much new for-sale + rental construction is in the pipeline within 1–3 miles? Heavy new supply typically softens prices + rents 12–24 months out; constrained supply supports both.
Investment metrics
- 1% rule
- 1.30% ✓
- Cap rate
- 10.44%
- Cash-on-cash
- 14.83%
- DSCR
- 1.66
- GRM
- 6.4
CMA / ARV
No comps found within radius.
Projected returns pro-forma
5.38% appreciation · 3.0% rent growth · sell at horizon
- IRR
- 26.5%
- Equity multiple
- 2.69×
- Total profit
- $28,380
- Equity at exit
- $35,409
- IRR
- 25.2%
- Equity multiple
- 5.39×
- Total profit
- $73,798
- Equity at exit
- $62,309
Cash invested: $16,800 (down + closing). Projections, not guarantees.
Landlord ↔ Tenant lean methodology
- Overall (STATE)
- 83 Strongly Landlord-Friendly
- State Kansas
- 83 Strongly Landlord-Friendly · R+10
- County
- — inherits STATE
- City
- — inherits STATE
ZIP-level market 67058
- Home prices YoY
- 3.2%
- Active inventory
- 15
- Price-to-rent
- 6.4×
Monthly cashflow live
- Estimated rent
- $778 medium interval (Pro) →
- Mortgage (P&I)
- −$315
- Tax from tax record
- −$68 /mo · $810/yr
- Insurance
- −$25
- HOA
- −$0
- Vacancy / Maint / Mgmt
- −$163
- Net cashflow
- $208
Break-even live
UW: 25.0% down · 7.5% · 30yr · 1.5% tax · 5.0% vac · 8.0% maint · 8.0% mgmt
Financing live
Cash to close
- Down payment
- $15,000
- Closing costs
- $1,800
- Reserves months
- —
- Total cash needed
- —
Loan-product check · same deal, 3 products live
Conventional
25% down · 7.5% · 30yr
- Down + closing
- —
- Monthly P&I
- —
- Monthly cashflow
- —
- DSCR
- —
- Eligible?
- —
Personal DTI + credit; lowest rate.
DSCR
20% down · 8.5% · 30yr
- Down + closing
- —
- Monthly P&I
- —
- Monthly cashflow
- —
- DSCR
- —
- Eligible?
- —
No personal income docs; deal must DSCR.
Hard money
10% down · 12.0% · 12mo
- Down + closing
- —
- Monthly P&I
- —
- Monthly cashflow
- —
- DSCR
- —
- Eligible?
- —
Short-term bridge; refi at stabilization.
Listing history 5 events
-
2026-06-02status $60,000 Pending 59 DOM
-
2026-06-01days on market $60,000 Active 59 DOM
-
2026-05-31days on market $60,000 Active 58 DOM
-
2026-05-31days on market $60,000 Active 57 DOM
-
2026-04-02$60,000 Active
ⓘ Source: listings_history table (triggers on properties + properties_extension) + one-shot
backfill from property_details.listing_events for pre-trigger history.
Tax reassessment forecast KS · Resets to sale price
- Current annual tax
- $810 · $68/mo
- Projected year-2 tax
- $846 · $70/mo
- Expected delta
- +$36/yr (+$3/mo · 4.4%)
ⓘ Screening estimate from a state-policy table — verify with the county assessor before closing.
Climate risk First Street
- Flood 1/10 Low 0% chance over 30 yrs
- Wildfire 2/10 Low
- Heat 5/10 Major 7 d/yr ≥107°F today · 16 d/yr by 30 yrs out
- Wind 2/10 Low
- Air quality 2/10 Low 1 unhealthy d/yr today · 1 by 30 yrs out
Nearby sold comps map
Loading sold comps map…
Walkable amenities ~0.75 mi
Loading nearby amenities…
Taxation est. · year 1
- Rental income
- $9,338
- − Mortgage interest
- −$3,361
- − Property taxes
- −$810
- − Insurance
- −$300
- − Repairs & maintenance
- −$747
- − Management
- −$747
- − Depreciation
- −$1,745
- Taxable income
- $1,627
- Est. tax owed @ 24.0%
- −$391
- After-tax cash flow
- $2,100/yr
For passive investors: Depreciation is non-cash, so a rental often shows a tax loss while cash-flowing — sheltering income. Rental losses are passive: they offset passive income freely, and up to $25,000/yr can offset ordinary (W-2) income if you actively participate and your MAGI is under $100k (phasing out to $0 by $150k); unused losses carry forward. On sale, claimed depreciation is recaptured at up to 25%, and gains may owe capital-gains tax (a 1031 exchange can defer both). Figures are a year-1 estimate at your 24.0% rate — not tax advice; consult a CPA.
Schools (NCES district)
- District
- Chaparral Schools
- NCES district ID
- 2003390
- Math proficiency
- 29% ▼ -2.00%
- Reading proficiency
- 29% ▼ -3.00%
- Median HH income
- $42,329
- Composite
- 24.65/100
- National rank
- #7624
- State rank
- #110 of 169 in KS
Livability — Harper
- Score
- 72/100
- State rank
- #106
- US rank
- #6084
Category grades
Schools grade is shown separately in the Schools card above.
Census & demographics
- Census place
- Harper, KS
- Population (ZIP)
- 1,893
Population outlook (Harper County) Hauer SSP2
- Today (2025)
- 5,360 people
- By 2030
- 5,133 · -4.2%
- By 2040
- 4,802 · -10.4%
- By 2050
- 4,589 · -14.4%
- By 2075
- 4,239 · -20.9%
- By 2100
- 3,881 · -27.6%
Race, ethnicity, and origin ACS 2023
- Neighborhood character
- Predominantly White (84%)
- Race & ethnicity
- White 84% Hispanic / Latino 8% Two or more races 7%
- Hispanic origin (detail)
- Mexican 2%
- Common ancestry
- Serbian 3% Lithuanian 2% Italian 1%
- Foreign-born
- 5% · Canada
- Languages at home
- 95% English-only · Spanish 4%
Political lean MEDSL · Harper
- 2024 margin
- Solid R (+64.0) · D 17.1% · R 81.1% · Other 1.8%
- 2008→2024 swing
- -18.8pp toward R · 2008: -45.2pp · 2024: -64.0pp
- All cycles
- 2024: R+64.0 2020: R+63.8 2016: R+62.2 2012: R+50.8 2008: R+45.2
Not yet ingested
- Civics
- —
Market trends
- HPI YoY
- ▲ 5.38%
- Current HPI
- 170.8977
- Rent YoY
- —
- Metro
- —
- State GDP YoY
- —
- F500 in state
- 0
Price history
1 event — show timeline
- 2026-04-02 Listed $60,000 SCKMLS as Distributed by MLS Grid
Property tax history
+4.3%/yrLatest (2025): $810 · -3.9% YoY. Source: county tax records.
Cash-flow waterfall
monthlySold comps — $/sqft
last 12 mo · ≤1 miLoading sold comps…