95 Mccoppin St Unit 103E · San Francisco, CA
Flood risk 1/10 · Minimal
- FEMA flood zone
- X (unshaded)
- Chance of flooding over 30 yrs
- 0.0%
- Est. flood insurance / yr
- $507 – $1,088
Fire risk 1/10 · Minimal
- Est. fire insurance / yr
- $659 – $1,223
Heat risk 2/10 · Minimal
- Hot days now (above 78°F)
- 8 days/yr
- Hot days in 30 yrs
- 18 days/yr
Wind risk 1/10 · Minimal
- Chance of severe wind over 30 yrs
- —
Air-quality risk 8/10 · Major
- Unhealthy air days now
- 15 days/yr
- Unhealthy air days in 30 yrs
- 15 days/yr
Risk factors via First Street. Map © Google.
Why this score? — see what drove the D grade
The composite is a weighted blend of 9 inputs, each scored 0–100. Each bar is that input's sub-score; the figure is the points it added to the 100-point composite (weight × sub-score).
- ARV discount +7.5/15.0
- Appreciation +7.5/10.0
- Cash flow +6.3/30.0
- Rent growth +5.0/5.0
- Schools +5.0/10.0
- Livability +3.8/5.0
- Condition / age +2.5/5.0
- 1% rule +1.9/10.0
- DSCR +0.6/10.0
$599,000
🖨 Deal sheet (PDF) 📄 Offer letter ✓ Due diligence
Listing remarks
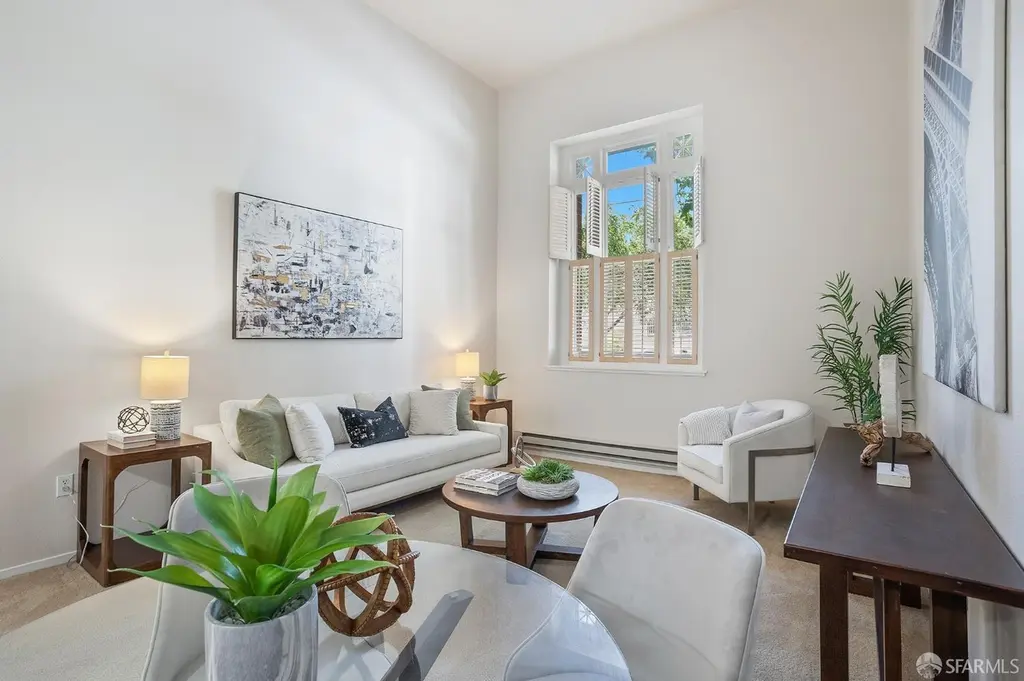
Welcome to the Valencia Corridor, where you can call this bright and airy city home your own! Featuring soaring ceilings, expansive windows, and an ideal layout that creates a wonderful sense of space and light. The well-designed floor plan offers easy everyday living with a seamless flow between the kitchen, dining, and living areas. The spacious bedroom provides a peaceful retreat, while in-unit laundry and secure building amenities add convenience. Ideally located near Hayes Valley, the Mission, Duboce Park, public transit, tech shuttles, dining, shopping, and nightlife offering the best of city living right outside your door. Property is subject to resale procedures under the City Secon
Key facts
- Public transit
- Expansive windows
- Soaring ceilings
Tags
Property features AI
Finance
- HOA & community: Homeowners association with a monthly fee of $770; HOA covers common areas, building insurance, structure maintenance, grounds maintenance, management, trash, and water; Community includes 109 units; Gated community
Exterior
- Parking: Covered, enclosed garage with garage door opener; Inside entrance to garage; Side-by-side configuration; Underground parking; On-site parking (size limited)
- Security: Gated community; Security gate; Carbon monoxide detector(s); Fire alarm; Smoke detector(s)
- Utilities: Public water; Public sewer
- Home design: Condominium (residential); One level; Entry at ground floor
- Construction: Built in 1997; Property attached
- Exterior features: Ground-floor entry; Paved sidewalk
Interior
- Kitchen: Dishwasher; Range hood
- Bedrooms: 1 bedroom
- Flooring: Carpet; Linoleum
- Bathrooms: 1 full bathroom
- Heating & cooling: Baseboard heating; Electric heating
- Interior features: Baseboard electric heating; Carbon monoxide detector(s); Fire alarm; Smoke detector(s)
- Laundry & utility: Washer; Dryer
Neighborhood map
What this means for you Summary
Snapshot
- This is a 1-bed/1.0-bath condo listed at $599k.
Deal economics
- At list price, monthly cash flow is $-1k ($-13k/yr) — negative.
- To cash-flow at today's rent, offer at most $409k (31.7% below list).
- To meet the 1% rule (rent ≥ 1% of price), the offer needs to be $414k (30.8% below list).
- Recommended offer: $409k (31.7% below list) — sets the bar for cash-flow.
- Cap rate 4.1% vs local median 2.1% in San Francisco — top-decile yield for the area; either an underpriced asset or a hidden risk that comps aren't pricing in. Stress-test before assuming the spread holds.
Location & tenants
- Location reads 76/100 on livability (#90 in CA, #3,143 nationally) — a middle-class / working-renter tenant base. Strengths: amenities A+, commute A+, employment A+; Watch: crime F, cost of living F.
- San Francisco Unified (urban): math 50% / reading 56% proficiency, ranked #322 of 1,400 in CA (top 23%) — acceptable for families but not a draw, mixed tenant base, ~2y average lease.
- Market conditions: Rents rising fast (+15.5%/yr); 113 active listings in the ZIP; 40 comparable units currently listed for rent nearby; rentals leasing fast (median 3d on market — plan ~1-2 weeks tenant-placement turnaround); high-income renter base; 750 units permitted in San Francisco County in 2024 (688 in 5+ unit buildings).
- This rent runs 43% of the median local income ($116k/yr) — at the standard rent-burdened threshold; future hikes will face affordability resistance.
Forward outlook
- In year one you build about $34k of equity ($4k loan paydown + $30k appreciation (5.0% local appreciation)).
- San Francisco County population projected at +39% by 2050 — long-run rental-demand tailwind backs the buy-and-hold thesis.
- By year 2, paydown + projected appreciation supports a ~$54k cash-out refi (75% LTV) — recoverable capital for the next deal without selling this one.
Negotiation context
- It's been on market 34 days — a 3% lower offer ($581k) is reasonable based on typical stale-listing flexibility.
Questions for the listing agent
- What do current leases actually rent for vs. the listed asking? Can we see a recent rent roll and the last 12 months of T-12 income?
- It's been on market 34 days. Have you received any prior offers? Is the seller open to a 32% concession, seller financing, or rate buy-down credit?
- What does the HOA fee cover, when was the last increase, and are there any pending special assessments or reserve-fund shortfalls?
- Any open or pending special assessments — roof, HVAC, plumbing, elevator, façade? What's the per-unit balance and payoff schedule, and is the seller paying it off at close or rolling it to the buyer?
- Is there a deadline driving the sale (1031 exchange, divorce, estate, relocation)? That informs how much negotiation room exists.
- Schools are B-rated — typically a magnet for longer-tenancy family renters. What's the average tenant stay here, and is there a school-zone premium baked into asking?
- Crime grade is F in this area — have there been break-ins, vandalism, or insurance claims at this property in the last 3 years? What carrier currently insures it and at what premium?
- The area grade is low — what's the realistic commute time and amenity access for the typical tenant pool here? Any planned neighborhood developments (good or bad) we should know about?
- What's the average days-on-market for RENTAL listings here right now (not sales)? A rising rental-DOM trend means longer vacancies and softer asking-rent achievability than the comps imply.
- What's the recent tenant-quality profile in this submarket — average credit score on applications, eviction rate, late-payment / NSF rate, and stable-employment percentage? A property-management company in the area should have these aggregated.
- How much new apartment / multifamily construction is in the pipeline within 1–3 miles? Heavy new supply (>2% of stock underway) typically softens rents 12–24 months out; light construction supports rent growth.
Investment metrics
- 1% rule
- 0.69% ✗
- Cap rate
- 4.14%
- Cash-on-cash
- -7.68%
- DSCR
- 0.66
- GRM
- 12.0
CMA / ARV
No comps found within radius.
Projected returns pro-forma
4.96% appreciation · 8.0% rent growth · sell at horizon
- IRR
- 8.2%
- Equity multiple
- 1.54×
- Total profit
- $90,458
- Equity at exit
- $338,081
- IRR
- 11.9%
- Equity multiple
- 3.30×
- Total profit
- $386,225
- Equity at exit
- $582,358
Cash invested: $167,720 (down + closing). Projections, not guarantees.
Landlord ↔ Tenant lean methodology
- Overall (CITY)
- 0 Strongly Tenant-Friendly
- State California
- 18 Strongly Tenant-Friendly · D+13
- County
- — inherits STATE
- City San Francisco
- 0 Strongly Tenant-Friendly · D+57
ZIP-level market 94103
- Home prices YoY
- 2.9%
- Rents YoY
- 15.5%
- Active inventory
- 113
- Price-to-rent
- 12.0×
Monthly cashflow live
- Estimated rent
- $4,143 high interval (Pro) →
- Mortgage (P&I)
- −$3,141
- Tax from tax record
- −$187 /mo · $2,238/yr
- Insurance
- −$250
- HOA
- −$770
- Vacancy / Maint / Mgmt
- −$870
- Net cashflow
- $-1,074
Break-even live
Sensitivity live
| Price | -10% $-735 | -5% $-905 | +0% $-1,074 | +5% $-1,244 | +10% $-1,413 |
|---|---|---|---|---|---|
| Rent | -10% $-1,401 | -5% $-1,238 | +0% $-1,074 | +5% $-910 | +10% $-747 |
| Rate | -1.0pp $-772 | -0.5pp $-922 | base $-1,074 | +0.5pp $-1,229 | +1.0pp $-1,387 |
UW: 25.0% down · 7.5% · 30yr · 1.5% tax · 5.0% vac · 8.0% maint · 8.0% mgmt
Financing live
Cash to close
- Down payment
- $149,750
- Closing costs
- $17,970
- Reserves months
- —
- Total cash needed
- —
Loan-product check · same deal, 3 products live
Conventional
25% down · 7.5% · 30yr
- Down + closing
- —
- Monthly P&I
- —
- Monthly cashflow
- —
- DSCR
- —
- Eligible?
- —
Personal DTI + credit; lowest rate.
DSCR
20% down · 8.5% · 30yr
- Down + closing
- —
- Monthly P&I
- —
- Monthly cashflow
- —
- DSCR
- —
- Eligible?
- —
No personal income docs; deal must DSCR.
Hard money
10% down · 12.0% · 12mo
- Down + closing
- —
- Monthly P&I
- —
- Monthly cashflow
- —
- DSCR
- —
- Eligible?
- —
Short-term bridge; refi at stabilization.
Rent comps 40 comps
| Address | Beds | Baths | Sqft | Rent | $/sqft | DOM | Units | Dist |
|---|---|---|---|---|---|---|---|---|
| 68 McCoppin St San Francisco, CA | 1.0 | 1.0 | 734 | $3,825 | $5.21 | 18d | 2 | 0.06mi |
| 1699 Market St San Francisco, CA | 1.0 | 1.0 | 561 | $4,871 | $8.68 | 0d | 7 | 0.10mi |
| 270 Valencia St #205 San Francisco, CA | 1.0 | 1.0 | 500 | $3,800 | $7.60 | 45d | 1 | 0.17mi |
| 1 Brady St San Francisco, CA | 2.0 | 1.0–2.0 | 889 | $5,570 | $6.26 | 0d | 26 | 0.19mi |
| 155 Haight St San Francisco, CA | — | 1.0 | 425 | $2,295 | $5.40 | 25d | 1 | 0.19mi |
| 429 14th St #1621 San Francisco, CA | 1.0 | 1.0 | 500 | $3,440 | $6.88 | 45d | 1 | 0.22mi |
| 30 Otis St San Francisco, CA | 2.0 | 1.0–2.0 | 874 | $6,956 | $7.95 | 0d | 15 | 0.22mi |
| 1801 Mission St San Francisco, CA | 1.0 | 1.0 | 446 | $10,000 | $22.42 | 45d | 1 | 0.24mi |
| 179 Oak St Apt F San Francisco, CA | — | 1.0 | 500 | $2,495 | $4.99 | 9d | 1 | 0.26mi |
| 200 Buchanan St San Francisco, CA | 1.0–2.0 | 1.0–2.0 | 1015 | $5,320 | $5.24 | 0d | 10 | 0.26mi |
| 24 Franklin St San Francisco, CA | — | 1.0 | 460 | $6,000 | $13.04 | 0d | 1 | 0.27mi |
| 1600 15th St San Francisco, CA | 1.0–2.0 | 1.0–2.0 | 931 | $4,109 | $4.41 | 0d | 6 | 0.30mi |
| 325 Octavia St San Francisco, CA | 2.0 | 1.0–2.0 | 811 | $6,889 | $8.49 | 0d | 1 | 0.31mi |
| 225 Fell St San Francisco, CA | 1.0 | 1.0 | 512 | $4,495 | $8.77 | 9d | 3 | 0.35mi |
| 100 Van Ness Ave #1477 San Francisco, CA | 1.0–2.0 | 1.0–2.0 | 865 | $5,470 | $6.32 | 0d | 2 | 0.41mi |
| 3178 16th St Unit 1 San Francisco, CA | — | 1.0 | 369 | $2,375 | $6.44 | 6d | 1 | 0.42mi |
| 18 10th St #1315 San Francisco, CA | — | 1.0 | 479 | $4,463 | $9.31 | 4d | 2 | 0.43mi |
| 8 10th St San Francisco, CA | 2.0 | 1.0–2.0 | 919 | $6,284 | $6.83 | 0d | 26 | 0.44mi |
| 305 Franklin St Unit 21 San Francisco, CA | — | 1.0 | 450 | $2,795 | $6.21 | 9d | 1 | 0.44mi |
| 150 Van Ness Ave #1475 San Francisco, CA | 1.0 | 1.0 | 615 | $5,510 | $8.96 | 21d | 1 | 0.45mi |
| 1 Polk St San Francisco, CA | 1.0 | 1.0 | 773 | $4,482 | $5.79 | 0d | 4 | 0.46mi |
| 2874 16th St Unit 2872A San Francisco, CA | — | 1.0 | 400 | $2,450 | $6.12 | 45d | 1 | 0.48mi |
| 1390 Market St San Francisco, CA | 1.0 | 1.0 | 561 | $4,067 | $7.25 | 0d | 13 | 0.49mi |
| 530 Grove St San Francisco, CA | 1.0 | 1.0 | 600 | $3,895 | $6.49 | 9d | 1 | 0.50mi |
| 101 Polk St San Francisco, CA | 1.0 | 1.0 | 573 | $4,628 | $8.07 | 0d | 7 | 0.50mi |
| 55 9th St San Francisco, CA | 2.0 | 1.0–2.0 | 833 | $4,428 | $5.32 | 0d | 1 | 0.55mi |
| 1288 Howard St #1908 San Francisco, CA | 1.0–2.0 | 1.0–2.0 | 782 | $4,190 | $5.35 | 3d | 2 | 0.57mi |
| 1288 Howard St #604 San Francisco, CA | 1.0 | 1.0 | 431 | $3,400 | $7.89 | 45d | 1 | 0.59mi |
| 901 Fell St Apt 17 San Francisco, CA | 1.0 | 1.0 | 750 | $3,000 | $4.00 | 0d | 1 | 0.64mi |
| 33 8th St San Francisco, CA | 1.0–2.0 | 1.0 | 646 | $3,637 | $5.63 | 0d | 10 | 0.67mi |
| 700 Steiner St San Francisco, CA | — | 1.0 | 515 | $3,650 | $7.09 | 45d | 1 | 0.68mi |
| 1190 Mission St San Francisco, CA | 1.0 | 1.0 | 508 | $3,342 | $6.57 | 0d | 5 | 0.68mi |
| 1177 Market St San Francisco, CA | 1.0–2.0 | 1.0 | 562 | $3,629 | $6.45 | 0d | 8 | 0.69mi |
| 750 Golden Gate Ave San Francisco, CA | 3.0 | 1.0–2.5 | 681 | $1,562 | $2.29 | 45d | 1 | 0.69mi |
| 601 Van Ness Ave San Francisco, CA | 1.0 | 1.0 | 637 | $3,820 | $6.00 | 0d | 2 | 0.70mi |
| 601 Van Ness Ave San Francisco, CA | 1.0 | 1.0 | 653 | $3,795 | $5.81 | 11d | 2 | 0.70mi |
| 1222 Harrison St San Francisco, CA | 2.0 | 1.0–2.5 | 853 | $4,902 | $5.75 | 0d | 33 | 0.71mi |
| 1188 Mission St San Francisco, CA | 1.0 | 1.0 | 448 | $3,333 | $7.43 | 0d | 17 | 0.72mi |
| 575 Pierce St San Francisco, CA | 1.0 | 1.0 | 700 | $5,595 | $7.99 | 45d | 1 | 0.76mi |
| 2315 Mission St Unit 106 San Francisco, CA | 1.0 | 1.0 | 450 | $2,995 | $6.66 | 9d | 1 | 0.78mi |
HOA detail condo
- Monthly dues
- $770 · $9,240/yr
- Assessments
- None detected in remarks — confirm with the listing agent.
Listing history 16 events
-
2026-06-21days on market $599,000 Active 34 DOM
-
2026-06-18days on market $599,000 Active 31 DOM
-
2026-06-17days on market $599,000 Active 30 DOM
-
2026-06-16days on market $599,000 Active 29 DOM
-
2026-06-15days on market $599,000 Active 28 DOM
-
2026-06-13days on market $599,000 Active 26 DOM
-
2026-06-13days on market $599,000 Active 25 DOM
-
2026-06-09days on market $599,000 Active 22 DOM
-
2026-06-08days on market $599,000 Active 21 DOM
-
2026-06-07days on market $599,000 Active 20 DOM
-
2026-06-04days on market $599,000 Active 17 DOM
-
2026-06-03days on market $599,000 Active 16 DOM
-
2026-06-02days on market $599,000 Active 15 DOM
-
2026-06-01days on market $599,000 Active 14 DOM
-
2026-05-31days on market $599,000 Active 13 DOM
-
2026-05-18$675,000 Active
ⓘ Source: listings_history table (triggers on properties + properties_extension) + one-shot
backfill from property_details.listing_events for pre-trigger history.
Tax reassessment forecast CA · Resets to sale price
- Current annual tax
- $2,238 · $187/mo
- Projected year-2 tax
- $4,552 · $379/mo
- Expected delta
- +$2,314/yr (+$193/mo · 103.4%)
ⓘ Screening estimate from a state-policy table — verify with the county assessor before closing.
Climate risk First Street
- Flood 1/10 Low FEMA zone X (unshaded) · 0% chance over 30 yrs
- Wildfire 1/10 Low
- Heat 2/10 Low 8 d/yr ≥78°F today · 18 d/yr by 30 yrs out
- Wind 1/10 Low
- Air quality 8/10 Severe 15 unhealthy d/yr today · 15 by 30 yrs out
Nearby sold comps map
Loading sold comps map…
Walkable amenities ~0.75 mi
Loading nearby amenities…
Taxation est. · year 1
- Rental income
- $49,720
- − Mortgage interest
- −$33,553
- − Property taxes
- −$2,238
- − Insurance
- −$2,995
- − Repairs & maintenance
- −$3,978
- − Management
- −$3,978
- − HOA
- −$9,240
- − Depreciation
- −$17,425
- Taxable loss
- −$23,687
- Est. tax savings @ 24.0%
- +$5,685
- After-tax cash flow
- $-7,204/yr
For passive investors: Depreciation is non-cash, so a rental often shows a tax loss while cash-flowing — sheltering income. Rental losses are passive: they offset passive income freely, and up to $25,000/yr can offset ordinary (W-2) income if you actively participate and your MAGI is under $100k (phasing out to $0 by $150k); unused losses carry forward. On sale, claimed depreciation is recaptured at up to 25%, and gains may owe capital-gains tax (a 1031 exchange can defer both). Figures are a year-1 estimate at your 24.0% rate — not tax advice; consult a CPA.
Schools (NCES district)
- District
- San Francisco Unified
- NCES district ID
- 0634410
- Math proficiency
- 50% ▬ 0.00%
- Reading proficiency
- 56% ▲ 1.00%
- Median HH income
- $81,249
- Composite
- 50.14/100
- National rank
- #4088
- State rank
- #322 of 1400 in CA
Livability — San Francisco
- Score
- 76/100
- State rank
- #90
- US rank
- #3143
Category grades
Schools grade is shown separately in the Schools card above.
Census & demographics
- Census place
- San Francisco, CA
- County
- San Francisco County · 827,552 people
- City population
- 827,552
- Metro
- San Francisco-Oakland-Berkeley, CA
- Population (ZIP)
- 34,964
- Household income
- $116,438
- Rent vs Own
- Severe rent burden
- 2666.0
Population outlook (San Francisco County) Hauer SSP2
- Today (2025)
- 1,030,936 people
- By 2030
- 1,110,409 · +7.7%
- By 2040
- 1,270,010 · +23.2%
- By 2050
- 1,435,001 · +39.2%
- By 2075
- 1,779,074 · +72.6%
- By 2100
- 1,966,767 · +90.8%
Race, ethnicity, and origin ACS 2023
- Neighborhood character
- Highly diverse neighborhood (Simpson 0.75)
- Race & ethnicity
- White 32% Asian 31% Hispanic / Latino 20% Two or more races 11% Black 10% Native American 2%
- Hispanic origin (detail)
- Mexican 11%
- Common ancestry
- Lithuanian 2% Slovak 2% Romanian 2%
- Foreign-born
- 36% · Canada, China, Vietnam
- Languages at home
- 56% English-only · Spanish 16% Chinese 9% Tagalog/Filipino 6%
Political lean MEDSL · San Francisco
- 2024 margin
- Solid D (+64.8) · D 80.3% · R 15.5% · Other 4.1%
- 2008→2024 swing
- -5.7pp toward R · 2008: 70.5pp · 2024: 64.8pp
- All cycles
- 2024: D+64.8 2020: D+72.5 2016: D+76.1 2012: D+70.2 2008: D+70.5
Not yet ingested
- Civics
- —
Market trends
- HPI YoY
- ▲ 4.96%
- Current HPI
- 175.4945
- Rent YoY
- ▲ 15.50%
- Metro
- San Francisco-Oakland-Berkeley, CA
- State GDP YoY
- ▲ 3.21%
- F500 in state
- 116
Industry mix (Fortune 500 HQ in CA)
| Industry | F500 HQs | Revenue |
|---|---|---|
| Technology | 27 | $1,492B |
|
||
| Financial Services | 3 | $174B |
|
||
| Retail | 3 | $44B |
|
||
| Insurance | 3 | $26B |
|
||
| Media / Entertainment | 2 | $115B |
|
||
| Pharmaceuticals / Biotech | 2 | $62B |
|
||
Price history
-11.3% since first listed2 events — show timeline
- 2026-05-26 Price Changed $599,000 San Francisco MLS
- 2026-05-18 Listed $675,000 San Francisco MLS
Property tax history
+1.1%/yrLatest (2025): $2,238 · +3.0% YoY. Source: county tax records.
Cash-flow waterfall
monthlySold comps — $/sqft
last 12 mo · ≤1 miLoading sold comps…