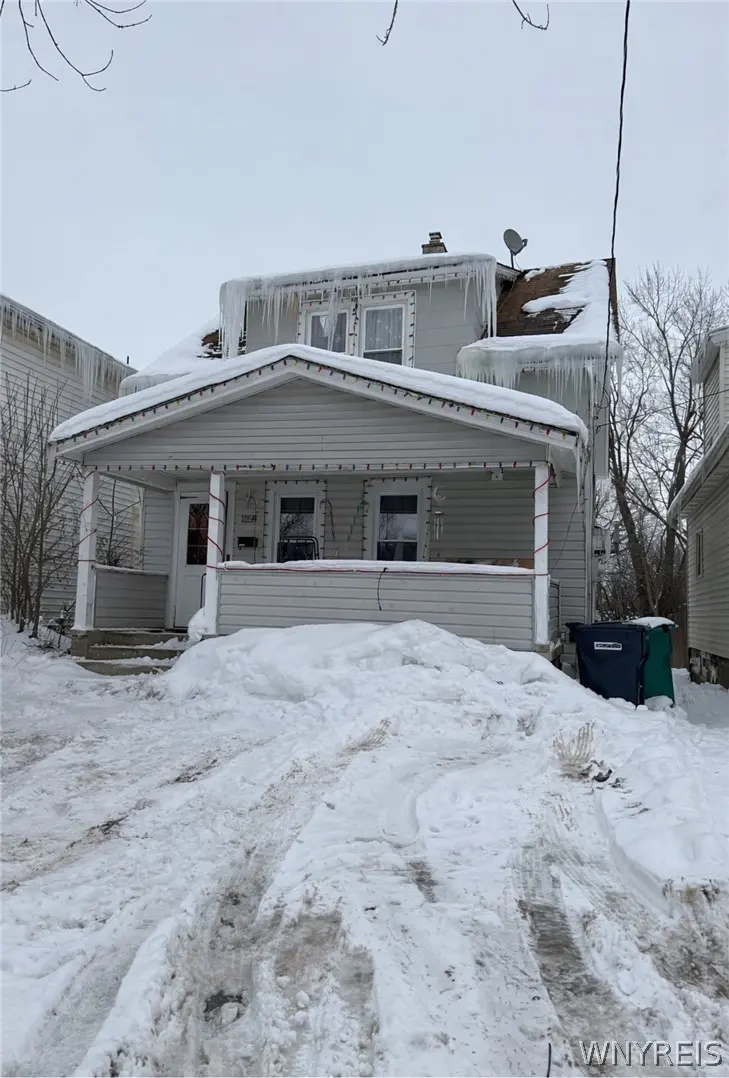
4021 Bell St · Niagara Falls, NY
Flood risk 1/10 · Minimal
- FEMA flood zone
- X (unshaded)
- Chance of flooding over 30 yrs
- 0.0%
- Est. flood insurance / yr
- $473 – $860
Fire risk 1/10 · Minimal
- Est. fire insurance / yr
- $691 – $1,283
Heat risk 2/10 · Minimal
- Hot days now (above 95°F)
- 7 days/yr
- Hot days in 30 yrs
- 14 days/yr
Wind risk 1/10 · Minimal
- Chance of severe wind over 30 yrs
- —
Air-quality risk 3/10 · Minor
- Unhealthy air days now
- 2 days/yr
- Unhealthy air days in 30 yrs
- 3 days/yr
Risk factors via First Street. Map © Google.
Why this score? — see what drove the B- grade
The composite is a weighted blend of 9 inputs, each scored 0–100. Each bar is that input's sub-score; the figure is the points it added to the 100-point composite (weight × sub-score).
- Cash flow +30.0/30.0
- 1% rule +10.0/10.0
- DSCR +10.0/10.0
- ARV discount +7.5/15.0
- Livability +3.0/5.0
- Rent growth +2.5/5.0
- Schools +2.5/10.0
- Condition / age +2.5/5.0
- Appreciation +0.0/10.0
$104,900
🖨 Deal sheet 📄 Offer letter ✓ Due diligence
Listing remarks MLS
Adorable rented, single family home with some updates. Newer vinyl flooring. Newer furnace and hot water tank. 3 Bedrooms and a full bath upstairs. The first floor has a master bedroom that was converted from a living room. Lots of space. Full basement. Deck with a partially fenced in yard.
Key facts
- Hot water tank
- Vinyl flooring
- Full basement
Tags
Neighborhood map
What this means for you Summary
Snapshot
- This is a 3-bed/2.0-bath single-family listed at $105k.
Deal economics
- At list price, monthly cash flow is $409 ($5k/yr) — positive.
- The deal already cash-flows at list — no discount required.
- Meets the 1% rule at list price ($2k rent vs $105k).
- Recommended offer: $92k (12.0% below list) — sets the bar for market timing.
- Cap rate 11.0% vs local median 7.7% in Niagara Falls — top-decile yield for the area; either an underpriced asset or a hidden risk that comps aren't pricing in. Stress-test before assuming the spread holds.
Location & tenants
- Location reads 60/100 on livability (#956 in NY) — a middle-class / working-renter tenant base. Strengths: cost of living A+, housing A+; Watch: schools F, crime F, amenities F.
- Niagara Falls City School District (urban): math 26% / reading 34% proficiency, ranked #578 of 590 in NY (top 98%) — families likely to look elsewhere, expect single-tenant / working-renter base with shorter leases; 66% free/reduced lunch — lower-income household profile, screen leases tightly.
- Market conditions: 142 active listings in the ZIP; 2 comparable units currently listed for rent nearby; 167 units permitted in Niagara County in 2024 (0 in 5+ unit buildings).
- This rent runs 41% of the median local income ($51k/yr) — at the standard rent-burdened threshold; future hikes will face affordability resistance.
Forward outlook
- Local home prices are declining (-3.0%/yr); year-one equity from $725 of loan paydown is wiped out by about $3k of value loss. Plan a longer hold.
- Niagara County population projected at -19% by 2050 — secular population decline; favor cash flow + early exit over multi-decade hold.
- At projected returns (-3.0% appreciation + 3.0% rent growth), your $29k cash investment doubles in ~8 years — after that, you're playing with house money.
Negotiation context
- It's been on market 129 days — a 12% lower offer ($92k) is reasonable based on typical stale-listing flexibility.
- 2 sale attempts since 15y ago; this cycle's ask has dropped $10k (9%) from the opening price — seller is motivated, your offer sets the floor, not the list.
Risks & watch-outs
- Watch-outs: property tax is 4.1% of price; built in 1920 — expect roof / HVAC / electrical / plumbing capex.
Questions for the listing agent
- It's been on market 129 days. Have you received any prior offers? Is the seller open to a 12% concession, seller financing, or rate buy-down credit?
- Built in 1920 — when were the roof, HVAC, electrical panel, plumbing, and water heater last replaced?
- Property tax is high relative to price — has the assessment been appealed recently, and will the sale trigger a re-assessment?
- Why hasn't it sold? Are there any deal-killer items the seller is aware of (foundation, flood, title, zoning, code violations)?
- Is there a deadline driving the sale (1031 exchange, divorce, estate, relocation)? That informs how much negotiation room exists.
- Schools are F-rated, which usually means shorter tenancies and higher turnover. Who's the typical renter profile here, and what's been the actual vacancy rate?
- Crime grade is F in this area — have there been break-ins, vandalism, or insurance claims at this property in the last 3 years? What carrier currently insures it and at what premium?
- What's the average days-on-market for RENTAL listings here right now (not sales)? A rising rental-DOM trend means longer vacancies and softer asking-rent achievability than the comps imply.
- What's the recent tenant-quality profile in this submarket — average credit score on applications, eviction rate, late-payment / NSF rate, and stable-employment percentage? A property-management company in the area should have these aggregated.
- How much new for-sale + rental construction is in the pipeline within 1–3 miles? Heavy new supply typically softens prices + rents 12–24 months out; constrained supply supports both.
Investment metrics
- 1% rule
- 1.65% ✓
- Cap rate
- 10.97%
- Cash-on-cash
- 16.70%
- DSCR
- 1.74
- GRM
- 5.1
CMA / ARV
- ARV (median comp)
- $218,034
- List price
- $104,900
- Delta
- -51.89%
- Verdict
- UNDERPRICED
- Comps
- 20 within 1.0 mi
Show comp detail 12 sales within ~0.75 mi
| Address | Dist | Beds/Ba | Sqft | Sold | Price | $/sf | Match |
|---|---|---|---|---|---|---|---|
| 3915 Deveaux St | 0.11mi | 3/2.0 | 1,460 (-8%) | 0mo | $120,000 | $82 | 82 |
| 3823 Macklem Ave | 0.24mi | 4/1.5 (+1) | 1,566 (-1%) | 2mo | $272,000 | $174 | 78 |
| 1315 Maple Ave | 0.03mi | 3/1.0 | 1,412 (-10%) | 2mo | $158,000 | $112 | 76 |
| 4011 Bell St | 0.02mi | 3/2.0 | 1,350 (-14%) | 4mo | $150,000 | $111 | 72 |
| 1314 Norwood Ave | 0.28mi | 4/1.0 (+1) | 1,628 (+3%) | 4mo | $140,000 | $86 | 70 |
| 914 Vanderbilt Ave | 0.25mi | 3/1.5 | 1,707 (+8%) | 7mo | $150,000 | $88 | 67 |
| 4026 Barton St | 0.49mi | 2/1.5 (-1) | 1,645 (+4%) | 5mo | $227,000 | $138 | 59 |
| 4214 Washington St | 0.33mi | 3/1.5 | 1,773 (+12%) | 5mo | $270,000 | $152 | 58 |
| 3742 Mckoon Ave | 0.27mi | 3/1.5 | 1,364 (-14%) | 6mo | $101,200 | $74 | 58 |
| 3040 Madison Ave | 0.39mi | 3/2.5 | 1,793 (+14%) | 0mo | $257,500 | $144 | 56 |
| 2863 Macklem Ave | 0.60mi | 3/1.0 | 1,451 (-8%) | 6mo | $109,999 | $76 | 49 |
| 2830 Macklem Ave | 0.65mi | 3/2.0 | 1,372 (-13%) | 0mo | $161,000 | $117 | 48 |
Match score weights: distance 35% · size 25% · config 20% · recency 20%. Top-matched comps best support the ARV.
Projected returns pro-forma
-3.0% appreciation · 3.0% rent growth · sell at horizon
- IRR
- 8.0%
- Equity multiple
- 1.31×
- Total profit
- $9,201
- Equity at exit
- $15,641
- IRR
- 17.3%
- Equity multiple
- 2.44×
- Total profit
- $42,215
- Equity at exit
- $9,070
Cash invested: $29,372 (down + closing). Projections, not guarantees.
Landlord ↔ Tenant lean methodology
- Overall (STATE)
- 15 Strongly Tenant-Friendly
- State New York
- 15 Strongly Tenant-Friendly · D+10
- County
- — inherits STATE
- City
- — inherits STATE
ZIP-level market 14305
- Home prices YoY
- -10.9%
- Active inventory
- 142
- Price-to-rent
- 5.1×
Monthly cashflow live
- Estimated rent
- $1,728 medium interval (Pro) →
- Mortgage (P&I)
- −$550
- Tax from tax record
- −$362 /mo · $4,350/yr
- Insurance
- −$44
- HOA
- −$0
- Vacancy / Maint / Mgmt
- −$363
- Net cashflow
- $409
Break-even live
UW: 25.0% down · 7.5% · 30yr · 1.5% tax · 5.0% vac · 8.0% maint · 8.0% mgmt
Financing live
Cash to close
- Down payment
- $26,225
- Closing costs
- $3,147
- Reserves months
- —
- Total cash needed
- —
Loan-product check · same deal, 3 products live
Conventional
25% down · 7.5% · 30yr
- Down + closing
- —
- Monthly P&I
- —
- Monthly cashflow
- —
- DSCR
- —
- Eligible?
- —
Personal DTI + credit; lowest rate.
DSCR
20% down · 8.5% · 30yr
- Down + closing
- —
- Monthly P&I
- —
- Monthly cashflow
- —
- DSCR
- —
- Eligible?
- —
No personal income docs; deal must DSCR.
Hard money
10% down · 12.0% · 12mo
- Down + closing
- —
- Monthly P&I
- —
- Monthly cashflow
- —
- DSCR
- —
- Eligible?
- —
Short-term bridge; refi at stabilization.
Rent comps 2 comps
| Address | Beds | Baths | Sqft | Rent | $/sqft | DOM | Units | Dist |
|---|---|---|---|---|---|---|---|---|
| 3025 Macklem Ave Niagara Falls, NY | 4.0 | 1.5 | 1750 | $2,200 | $1.26 | 44d | 1 | 0.41mi |
| 1312 Ontario Ave Niagara Falls, NY | 2.0 | 1.0 | 1956 | $1,200 | $0.61 | 44d | 1 | 1.05mi |
Listing history 20 events
-
2026-06-18days on market $104,900 Active 129 DOM
-
2026-06-17days on market $104,900 Active 128 DOM
-
2026-06-16days on market $104,900 Active 127 DOM
-
2026-06-15days on market $104,900 Active 126 DOM
-
2026-06-13days on market $104,900 Active 124 DOM
-
2026-06-13days on market $104,900 Active 123 DOM
-
2026-06-10days on market $104,900 Active 121 DOM
-
2026-06-09days on market $104,900 Active 120 DOM
-
2026-06-08pricedays on market $104,900 Active 119 DOM
-
2026-06-07days on market $109,900 Active 118 DOM
-
2026-06-03days on market $109,900 Active 114 DOM
-
2026-06-02days on market $109,900 Active 113 DOM
-
2026-06-01days on market $109,900 Active 112 DOM
-
2026-05-31days on market $109,900 Active 111 DOM
-
2026-03-23price $109,900 291-char remark
Show marketing remark (291 chars)
Adorable rented, single family home with some updates. Newer vinyl flooring. Newer furnace and hot water tank. 3 Bedrooms and a full bath upstairs. The first floor has a master bedroom that was converted from a living room. Lots of space. Full basement. Deck with a partially fenced in yard.
-
2026-02-09$114,900 Active 291-char remark
Show marketing remark (291 chars)
Adorable rented, single family home with some updates. Newer vinyl flooring. Newer furnace and hot water tank. 3 Bedrooms and a full bath upstairs. The first floor has a master bedroom that was converted from a living room. Lots of space. Full basement. Deck with a partially fenced in yard.
-
2024-03-20soldstatus $520,000
-
2012-05-17soldstatus $24,000
-
2012-05-11soldstatus $23,000 586-char remark
Show marketing remark (586 chars)
Be a homeowner today. Owner will consider all offers & all terms. Rocking chair front porch leads in to this Deveaux home. Over 1500 Sq' 1st floor offers great living space. Large addition off back of home leads to a deck. 1st floor bath and laundry, 3 br and a 2nd f/b upstairs Some replacement windows. This property the city will finance up to 100% of the cost of property improvements at 0% with no monthly payments, 50% of the loan is forgiven after 3 years. Balance due only when sold again. 203K is a great option for financing. Owner will consider all offers and all terms
-
2011-09-12$35,000 586-char remark
Show marketing remark (586 chars)
Be a homeowner today. Owner will consider all offers & all terms. Rocking chair front porch leads in to this Deveaux home. Over 1500 Sq' 1st floor offers great living space. Large addition off back of home leads to a deck. 1st floor bath and laundry, 3 br and a 2nd f/b upstairs Some replacement windows. This property the city will finance up to 100% of the cost of property improvements at 0% with no monthly payments, 50% of the loan is forgiven after 3 years. Balance due only when sold again. 203K is a great option for financing. Owner will consider all offers and all terms
ⓘ Source: listings_history table (triggers on properties + properties_extension) + one-shot
backfill from property_details.listing_events for pre-trigger history.
Tax reassessment forecast NY · Partial reset (capped growth)
- Current annual tax
- $4,350 · $362/mo
- Projected year-2 tax
- $4,350 · $362/mo
- Expected delta
- $0/yr ($0/mo · 0.0%)
ⓘ Screening estimate from a state-policy table — verify with the county assessor before closing.
Climate risk First Street
- Flood 1/10 Low FEMA zone X (unshaded) · 0% chance over 30 yrs
- Wildfire 1/10 Low
- Heat 2/10 Low 7 d/yr ≥95°F today · 14 d/yr by 30 yrs out
- Wind 1/10 Low
- Air quality 3/10 Moderate 2 unhealthy d/yr today · 3 by 30 yrs out
Nearby sold comps map
Loading sold comps map…
Walkable amenities ~0.75 mi
Loading nearby amenities…
Taxation est. · year 1
- Rental income
- $20,734
- − Mortgage interest
- −$5,876
- − Property taxes
- −$4,350
- − Insurance
- −$524
- − Repairs & maintenance
- −$1,659
- − Management
- −$1,659
- − Depreciation
- −$3,052
- Taxable income
- $3,615
- Est. tax owed @ 24.0%
- −$868
- After-tax cash flow
- $4,037/yr
For passive investors: Depreciation is non-cash, so a rental often shows a tax loss while cash-flowing — sheltering income. Rental losses are passive: they offset passive income freely, and up to $25,000/yr can offset ordinary (W-2) income if you actively participate and your MAGI is under $100k (phasing out to $0 by $150k); unused losses carry forward. On sale, claimed depreciation is recaptured at up to 25%, and gains may owe capital-gains tax (a 1031 exchange can defer both). Figures are a year-1 estimate at your 24.0% rate — not tax advice; consult a CPA.
Schools (NCES district)
- District
- Niagara Falls City School District
- NCES district ID
- 3620820
- Math proficiency
- 26% ▼ -10.00%
- Reading proficiency
- 34% ▲ 3.00%
- Median HH income
- $32,488
- Composite
- 24.5/100
- National rank
- #7655
- State rank
- #578 of 590 in NY
Livability — Niagara Falls
- Score
- 60/100
- State rank
- #956
- US rank
- #18749
Category grades
Schools grade is shown separately in the Schools card above.
Census & demographics
- Census place
- Niagara Falls, NY
- County
- Niagara County · 157,377 people
- City population
- 62,983
- Metro
- Buffalo-Cheektowaga, NY
- Population (ZIP)
- 16,696
- Household income
- $51,004
- Rent vs Own
- Severe rent burden
- 1095.0
Population outlook (Niagara County) Hauer SSP2
- Today (2025)
- 204,149 people
- By 2030
- 197,900 · -3.1%
- By 2040
- 182,239 · -10.7%
- By 2050
- 165,198 · -19.1%
- By 2075
- 129,416 · -36.6%
- By 2100
- 96,222 · -52.9%
Race, ethnicity, and origin ACS 2023
- Neighborhood character
- Diverse neighborhood (Simpson 0.63)
- Race & ethnicity
- White 55% Black 24% Two or more races 13% Hispanic / Latino 8% Asian 1% Native American 1%
- Hispanic origin (detail)
- Puerto Rican 4%
- Common ancestry
- Romanian 6% Slovak 2% Lithuanian 2%
- Foreign-born
- 6% · Canada, Jamaica
- Languages at home
- 93% English-only · Spanish 4% Other Indo-European 1%
Political lean MEDSL · Niagara
- 2024 margin
- R (+14.9) · D 42.5% · R 57.5%
- 2008→2024 swing
- -15.9pp toward R · 2008: 1.0pp · 2024: -14.9pp
- All cycles
- 2024: R+14.9 2020: R+9.7 2016: R+19.0 2012: D+0.6 2008: D+1.0
Not yet ingested
- Civics
- —
Market trends
- HPI YoY
- ▼ -43.08%
- Current HPI
- 350.8741
- Rent YoY
- —
- Metro
- Buffalo-Cheektowaga, NY
- State GDP YoY
- ▲ 2.60%
- F500 in state
- 92
Industry mix (Fortune 500 HQ in NY)
| Industry | F500 HQs | Revenue |
|---|---|---|
| Financial Services | 10 | $950B |
|
||
| Consumer Goods | 9 | $162B |
|
||
| Insurance | 4 | $225B |
|
||
| Telecommunications | 2 | $144B |
|
||
| Pharmaceuticals | 2 | $112B |
|
||
| Media / Entertainment | 2 | $69B |
|
||
Price history
+214.0% since first listed6 events — show timeline
- 2026-03-23 Price Changed $109,900 WNYREIS
- 2026-02-09 Listed $114,900 WNYREIS
- 2024-03-20 Sold (Public Records) $520,000 Public Records
- 2012-05-17 Sold (Public Records) $24,000 Public Records
- 2012-05-11 Sold (MLS) $23,000 WNYREIS
- 2011-09-12 Listed $35,000 WNYREIS
Property tax history
+6.3%/yrLatest (2025): $4,350 · +18.2% YoY. Source: county tax records.
Cash-flow waterfall
monthlySold comps — $/sqft
last 12 mo · ≤1 miLoading sold comps…