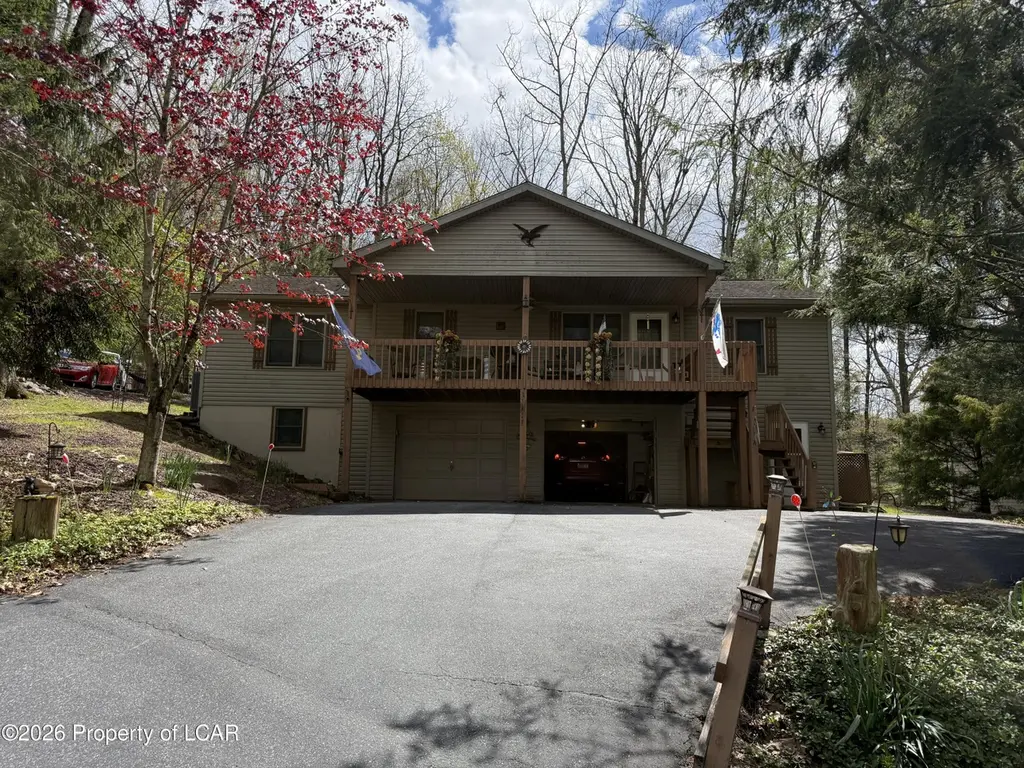
253 Snow Valley Dr · Beech Mountain Lakes, PA
Flood risk 1/10 · Minimal
- FEMA flood zone
- X (unshaded)
- Chance of flooding over 30 yrs
- 0.0%
- Est. flood insurance / yr
- $507 – $1,088
Fire risk 3/10 · Minor
- Est. fire insurance / yr
- $511 – $949
Heat risk 3/10 · Minor
- Hot days now (above 90°F)
- 7 days/yr
- Hot days in 30 yrs
- 17 days/yr
Wind risk 3/10 · Minor
- Chance of severe wind over 30 yrs
- 7.0%
Air-quality risk 2/10 · Minimal
- Unhealthy air days now
- 1 days/yr
- Unhealthy air days in 30 yrs
- 2 days/yr
Risk factors via First Street. Map © Google.
Why this score? — see what drove the D grade
The composite is a weighted blend of 9 inputs, each scored 0–100. Each bar is that input's sub-score; the figure is the points it added to the 100-point composite (weight × sub-score).
- Appreciation +10.0/10.0
- Cash flow +8.7/30.0
- ARV discount +6.3/15.0
- Livability +3.6/5.0
- 1% rule +2.8/10.0
- Rent growth +2.5/5.0
- Condition / age +2.5/5.0
- DSCR +2.4/10.0
- Schools +2.0/10.0
$270,000
🖨 Deal sheet (PDF) 📄 Offer letter ✓ Due diligence
Listing remarks MLS
Well built and perfectly maintained raised ranch. Stone FP in LR w/ vaulted ceiling. Vaulted ceiling in modern kitchen too. Large master with private bath. Covered front porch with ceiling fan.
Key facts
- 0.27 acre lot
- 2 garage spots
- Listed 38 days
Property features AI
Finance
- HOA & community: Homeowners association with annual fee of $1,100 (about $91.67/month)
Exterior
- Parking: Attached 2-car garage
- Utilities: Shared well water
- Home design: Single-family residential; Two levels
- Construction: Vinyl siding
- Exterior features: Located in the Beech Mountain Lakes subdivision; Lot is approximately 0.27 acres; Residential zoning
Interior
- Kitchen: Eat-in kitchen
- Bedrooms: Total of 6 rooms (bedroom count not specified)
- Bathrooms: 1 full bathroom; 1 three-quarter bathroom
- Heating & cooling: Central air conditioning; Electric and natural gas heating; Baseboard heating; Heat pump
- Interior features: Eat-in kitchen; Dining room fireplace
- Laundry & utility: Finished basement (utility/laundry details not specified)
Neighborhood map
What this means for you Summary
Snapshot
- This is a 3-bed/2.0-bath single-family listed at $270k.
Deal economics
- At list price, monthly cash flow is $-226 ($-3k/yr) — negative.
- To cash-flow at today's rent, offer at most $230k (14.8% below list).
- To meet the 1% rule (rent ≥ 1% of price), the offer needs to be $211k (21.9% below list).
- Recommended offer: $211k (21.9% below list) — sets the bar for 1% rule.
- Cap rate 5.3% vs local median 3.7% in Beech Mountain Lakes — top-decile yield for the area; either an underpriced asset or a hidden risk that comps aren't pricing in. Stress-test before assuming the spread holds.
Location & tenants
- Location reads 71/100 on livability (#698 in PA) — a middle-class / working-renter tenant base. Strengths: crime A+, employment A+, cost of living A+; Watch: amenities F, commute F, health & safety F.
- Hazleton Area SD (suburban): math 18% / reading 30% proficiency, ranked #476 of 539 in PA (top 88%) — low school quality limits family demand, transient renter base, plan for 1-2y turnover.
- Zoned schools: Drums El/Ms (math 17% / reading 53%, grade F, #1,042 of 1,518 statewide, top 69%, 784 students, 100% FRL); Hazleton Area Hs (math 53% / reading 8%, grade F, #347 of 437 statewide, top 79%, 3,795 students, 83% FRL) — zoned schools average 91% FRL vs 60% district-wide (32 pts higher); higher-poverty schools than district average — tighter screening recommended.
- Market conditions: 134 active listings in the ZIP; 349 units permitted in Luzerne County in 2024 (16 in 5+ unit buildings).
Forward outlook
- In year one you build about $29k of equity ($2k loan paydown + $27k appreciation (10.0% local appreciation)).
- Luzerne County population projected at +4% by 2050 — modest demand growth; plan on rents tracking national, not racing it.
- By year 2, paydown + projected appreciation supports a ~$46k cash-out refi (75% LTV) — recoverable capital for the next deal without selling this one.
Negotiation context
- It's been on market 38 days — a 3% lower offer ($262k) is reasonable based on typical stale-listing flexibility.
- 2 sale attempts since 7y ago with the ask held roughly flat each time — persistent listings suggest the price (not the market) is what's stuck; bring a comps-based counter.
- Current owner paid $162k; list at $270k implies a 66% gain — meaningful room to come down on a strong offer.
Questions for the listing agent
- What do current leases actually rent for vs. the listed asking? Can we see a recent rent roll and the last 12 months of T-12 income?
- It's been on market 38 days. Have you received any prior offers? Is the seller open to a 22% concession, seller financing, or rate buy-down credit?
- What does the HOA fee cover, when was the last increase, and are there any pending special assessments or reserve-fund shortfalls?
- Is there a deadline driving the sale (1031 exchange, divorce, estate, relocation)? That informs how much negotiation room exists.
- Schools are D-rated, which usually means shorter tenancies and higher turnover. Who's the typical renter profile here, and what's been the actual vacancy rate?
- The area grade is low — what's the realistic commute time and amenity access for the typical tenant pool here? Any planned neighborhood developments (good or bad) we should know about?
- What's the average days-on-market for RENTAL listings here right now (not sales)? A rising rental-DOM trend means longer vacancies and softer asking-rent achievability than the comps imply.
- What's the recent tenant-quality profile in this submarket — average credit score on applications, eviction rate, late-payment / NSF rate, and stable-employment percentage? A property-management company in the area should have these aggregated.
- How much new for-sale + rental construction is in the pipeline within 1–3 miles? Heavy new supply typically softens prices + rents 12–24 months out; constrained supply supports both.
Investment metrics
- 1% rule
- 0.78% ✗
- Cap rate
- 5.29%
- Cash-on-cash
- -3.59%
- DSCR
- 0.84
- GRM
- 10.7
CMA / ARV
- ARV (median comp)
- $262,914
- List price
- $270,000
- Delta
- 2.70%
- Verdict
- FAIR
- Comps
- 20 within 1.0 mi
Show comp detail 10 sales within ~0.75 mi
| Address | Dist | Beds/Ba | Sqft | Sold | Price | $/sf | Match |
|---|---|---|---|---|---|---|---|
| 307 Buck Saw Dr | 0.39mi | 3/2.0 | 1,441 (-3%) | 9mo | $215,000 | $149 | 70 |
| 205 Snow Valley Dr | 0.33mi | 3/2.0 | 1,520 (+3%) | 16mo | $250,000 | $164 | 67 |
| 154 Bear Run Dr | 0.20mi | 3/2.0 | 1,634 (+10%) | 11mo | $300,000 | $184 | 65 |
| 213 Shingle Mill Dr | 0.20mi | 3/2.0 | 1,310 (-12%) | 9mo | $256,000 | $195 | 64 |
| 226 Avalanche Ln | 0.09mi | 2/1.5 (-1) | 1,557 (+5%) | 22mo | $200,000 | $128 | 62 |
| 106 Randy Ridge Ct | 0.61mi | 2/1.5 (-1) | 1,475 (-0%) | 2mo | $170,000 | $115 | 62 |
| 241 Snow Valley Dr | 0.08mi | 3/2.0 | 1,700 (+15%) | 17mo | $260,000 | $153 | 57 |
| 158 Buck Ridge Dr | 0.44mi | 3/1.0 | 1,388 (-6%) | 16mo | $217,000 | $156 | 52 |
| 126 Buck Ridge Dr | 0.63mi | 3/2.0 | 1,606 (+8%) | 9mo | $259,000 | $161 | 49 |
| 291 Buck Saw Dr | 0.27mi | 3/2.0 | 1,676 (+13%) | 21mo | $235,000 | $140 | 48 |
Match score weights: distance 35% · size 25% · config 20% · recency 20%. Top-matched comps best support the ARV.
Projected returns pro-forma
10.0% appreciation · 3.0% rent growth · sell at horizon
- IRR
- 21.7%
- Equity multiple
- 2.75×
- Total profit
- $132,674
- Equity at exit
- $243,237
- IRR
- 19.6%
- Equity multiple
- 6.32×
- Total profit
- $402,142
- Equity at exit
- $524,551
Cash invested: $75,600 (down + closing). Projections, not guarantees.
Landlord ↔ Tenant lean methodology
- Overall (STATE)
- 62 Landlord-Friendly
- State Pennsylvania
- 62 Landlord-Friendly · EVEN
- County
- — inherits STATE
- City
- — inherits STATE
ZIP-level market 18222
- Home prices YoY
- 10.2%
- Active inventory
- 134
- Price-to-rent
- 10.7×
Monthly cashflow live
- Estimated rent
- $2,110 medium interval (Pro) →
- Mortgage (P&I)
- −$1,416
- Tax from tax record
- −$273 /mo · $3,271/yr
- Insurance
- −$112
- HOA
- −$92
- Vacancy / Maint / Mgmt
- −$443
- Net cashflow
- $-226
Break-even live
Sensitivity live
| Price | -10% $-74 | -5% $-150 | +0% $-226 | +5% $-303 | +10% $-379 |
|---|---|---|---|---|---|
| Rent | -10% $-393 | -5% $-310 | +0% $-226 | +5% $-143 | +10% $-60 |
| Rate | -1.0pp $-90 | -0.5pp $-158 | base $-226 | +0.5pp $-296 | +1.0pp $-368 |
UW: 25.0% down · 7.5% · 30yr · 1.5% tax · 5.0% vac · 8.0% maint · 8.0% mgmt
Financing live
Cash to close
- Down payment
- $67,500
- Closing costs
- $8,100
- Reserves months
- —
- Total cash needed
- —
Loan-product check · same deal, 3 products live
Conventional
25% down · 7.5% · 30yr
- Down + closing
- —
- Monthly P&I
- —
- Monthly cashflow
- —
- DSCR
- —
- Eligible?
- —
Personal DTI + credit; lowest rate.
DSCR
20% down · 8.5% · 30yr
- Down + closing
- —
- Monthly P&I
- —
- Monthly cashflow
- —
- DSCR
- —
- Eligible?
- —
No personal income docs; deal must DSCR.
Hard money
10% down · 12.0% · 12mo
- Down + closing
- —
- Monthly P&I
- —
- Monthly cashflow
- —
- DSCR
- —
- Eligible?
- —
Short-term bridge; refi at stabilization.
HOA detail
- Monthly dues
- $92 · $1,104/yr
Listing history 13 events
-
2026-06-12statusdays on market $270,000 Pending 38 DOM
-
2026-06-09days on market $270,000 Active 35 DOM
-
2026-06-08days on market $270,000 Active 34 DOM
-
2026-06-07days on market $270,000 Active 33 DOM
-
2026-06-02days on market $270,000 Active 28 DOM
-
2026-06-01days on market $270,000 Active 27 DOM
-
2026-05-31days on market $270,000 Active 26 DOM
-
2026-05-30days on market $270,000 Active 25 DOM
-
2026-05-05$270,000 Active 320-char remark
-
2019-06-18soldstatus $162,500
-
2019-06-14soldstatus $162,500 193-char remark
Show marketing remark (193 chars)
Well built and perfectly maintained raised ranch. Stone FP in LR w/ vaulted ceiling. Vaulted ceiling in modern kitchen too. Large master with private bath. Covered front porch with ceiling fan.
-
2019-03-25$162,500 193-char remark
Show marketing remark (193 chars)
Well built and perfectly maintained raised ranch. Stone FP in LR w/ vaulted ceiling. Vaulted ceiling in modern kitchen too. Large master with private bath. Covered front porch with ceiling fan.
-
2009-10-27soldstatus $151,000
ⓘ Source: listings_history table (triggers on properties + properties_extension) + one-shot
backfill from property_details.listing_events for pre-trigger history.
Tax reassessment forecast PA · Partial reset (capped growth)
- Current annual tax
- $3,271 · $273/mo
- Projected year-2 tax
- $3,769 · $314/mo
- Expected delta
- +$497/yr (+$41/mo · 15.2%)
ⓘ Screening estimate from a state-policy table — verify with the county assessor before closing.
Climate risk First Street
- Flood 1/10 Low FEMA zone X (unshaded) · 0% chance over 30 yrs
- Wildfire 3/10 Moderate
- Heat 3/10 Moderate 7 d/yr ≥90°F today · 17 d/yr by 30 yrs out
- Wind 3/10 Moderate 7% chance of damaging wind over 30 yrs
- Air quality 2/10 Low 1 unhealthy d/yr today · 2 by 30 yrs out
Nearby sold comps map
Loading sold comps map…
Walkable amenities ~0.75 mi
Loading nearby amenities…
Taxation est. · year 1
- Rental income
- $25,315
- − Mortgage interest
- −$15,124
- − Property taxes
- −$3,271
- − Insurance
- −$1,350
- − Repairs & maintenance
- −$2,025
- − Management
- −$2,025
- − HOA
- −$1,104
- − Depreciation
- −$7,855
- Taxable loss
- −$7,440
- Est. tax savings @ 24.0%
- +$1,786
- After-tax cash flow
- $-932/yr
For passive investors: Depreciation is non-cash, so a rental often shows a tax loss while cash-flowing — sheltering income. Rental losses are passive: they offset passive income freely, and up to $25,000/yr can offset ordinary (W-2) income if you actively participate and your MAGI is under $100k (phasing out to $0 by $150k); unused losses carry forward. On sale, claimed depreciation is recaptured at up to 25%, and gains may owe capital-gains tax (a 1031 exchange can defer both). Figures are a year-1 estimate at your 24.0% rate — not tax advice; consult a CPA.
Schools (NCES district)
- District
- Hazleton Area SD
- NCES district ID
- 4211700
- Math proficiency
- 18% ▼ -3.00%
- Reading proficiency
- 30% ▼ -15.00%
- Median HH income
- $42,247
- Composite
- 20.44/100
- National rank
- #8582
- State rank
- #476 of 539 in PA
Livability — Beech Mountain Lakes
- Score
- 71/100
- State rank
- #698
- US rank
- #6837
Category grades
Schools grade is shown separately in the Schools card above.
Census & demographics
- Census place
- Beech Mountain Lakes, PA
- Population (ZIP)
- 9,946
Population outlook (Luzerne County) Hauer SSP2
- Today (2025)
- 319,505 people
- By 2030
- 319,943 · +0.1%
- By 2040
- 322,643 · +1.0%
- By 2050
- 330,817 · +3.5%
- By 2075
- 379,145 · +18.7%
- By 2100
- 431,908 · +35.2%
Race, ethnicity, and origin ACS 2023
- Neighborhood character
- Predominantly White (86%)
- Race & ethnicity
- White 86% Hispanic / Latino 7% Two or more races 7% Black 2%
- Hispanic origin (detail)
- Puerto Rican 2% Dominican 4%
- Common ancestry
- Romanian 10% Scotch-Irish 2% Iranian 2%
- Foreign-born
- 2% · Canada
- Languages at home
- 94% English-only · Spanish 3% Other Indo-European 1% Arabic 1%
Political lean MEDSL · Luzerne
- 2024 margin
- R (+19.2) · D 40.0% · R 59.2%
- 2008→2024 swing
- -27.6pp toward R · 2008: 8.4pp · 2024: -19.2pp
- All cycles
- 2024: R+19.2 2020: R+14.4 2016: R+19.6 2012: D+4.8 2008: D+8.4
Not yet ingested
- Civics
- —
Market trends
- HPI YoY
- ▲ 28.01%
- Current HPI
- 302.4923
- Rent YoY
- —
- Metro
- —
- State GDP YoY
- ▲ 1.68%
- F500 in state
- 34
Industry mix (Fortune 500 HQ in PA)
| Industry | F500 HQs | Revenue |
|---|---|---|
| Healthcare | 2 | $309B |
|
||
| Insurance | 2 | $27B |
|
||
| Telecommunications / Media | 1 | $124B |
|
||
| Industrial Distribution | 1 | $22B |
|
||
| Financial Services | 1 | $20B |
|
||
| Chemicals / Materials | 1 | $18B |
|
||
Price history
+78.8% since first listed6 events — show timeline
- 2026-06-12 Pending — LCAR
- 2026-05-05 Listed $270,000 LCAR
- 2019-06-18 Sold (Public Records) $162,500 Public Records
- 2019-06-14 Sold (MLS) $162,500 LCAR
- 2019-03-25 Listed $162,500 LCAR
- 2009-10-27 Sold (Public Records) $151,000 Public Records
Property tax history
+2.6%/yrLatest (2026): $3,271 · +4.6% YoY. Source: county tax records.
Cash-flow waterfall
monthlySold comps — $/sqft
last 12 mo · ≤1 miLoading sold comps…