9777 Deerview Ln · Kimberly, AL
Flood risk 1/10 · Minimal
- FEMA flood zone
- X (unshaded)
- Chance of flooding over 30 yrs
- 0.0%
- Est. flood insurance / yr
- $507 – $1,088
Fire risk 3/10 · Minor
- Est. fire insurance / yr
- $916 – $1,700
Heat risk 6/10 · Moderate
- Hot days now (above 106°F)
- 7 days/yr
- Hot days in 30 yrs
- 19 days/yr
Wind risk 6/10 · Moderate
- Chance of severe wind over 30 yrs
- 27.0%
Air-quality risk 4/10 · Minor
- Unhealthy air days now
- 4 days/yr
- Unhealthy air days in 30 yrs
- 6 days/yr
Risk factors via First Street. Map © Google.
Why this score? — see what drove the D- grade
The composite is a weighted blend of 9 inputs, each scored 0–100. Each bar is that input's sub-score; the figure is the points it added to the 100-point composite (weight × sub-score).
- ARV discount +10.0/15.0
- Appreciation +10.0/10.0
- Cash flow +7.1/30.0
- Livability +3.3/5.0
- Rent growth +2.5/5.0
- Condition / age +2.5/5.0
- Schools +1.8/10.0
- DSCR +1.3/10.0
- 1% rule +0.9/10.0
$309,900
🖨 Deal sheet 📄 Offer letter ✓ Due diligence
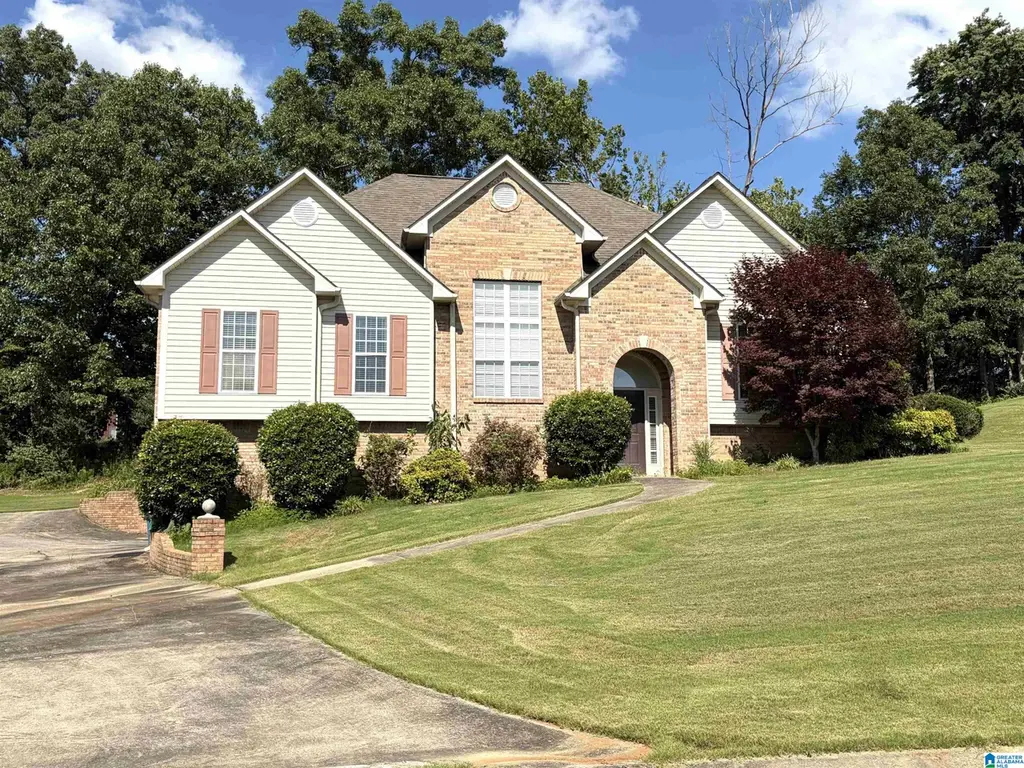
Listing remarks
Welcome home to this beautiful full-brick home featuring a desirable split-bedroom floor plan designed for both comfort and privacy. The inviting foyer opens to a spacious great room, while the formal dining room with vaulted ceilings provides for the perfect setting for family gatherings and entertaining. Real hardwood flooring flows throughout the foyer, great room, and dining room, adding warmth and timeless appeal. Enjoy relaxing on the covered back porch overlooking the backyard with woods behind the home. Take advantage of the full unfinished basement offering abundant storage and endless possibilities for future expansion. Situated in an established neighborhood known for it's conven
Key facts
- Hardwood flooring
- Formal dining room
- Full brick home
Tags
Neighborhood map
What this means for you Summary
Snapshot
- This is a 3-bed/3.0-bath single-family listed at $310k.
Deal economics
- At list price, monthly cash flow is $-440 ($-5k/yr) — negative.
- To cash-flow at today's rent, offer at most $232k (25.1% below list).
- To meet the 1% rule (rent ≥ 1% of price), the offer needs to be $182k (41.2% below list).
- Recommended offer: $182k (41.2% below list) — sets the bar for 1% rule.
Location & tenants
- Location reads 66/100 on livability (#99 in AL) — a middle-class / working-renter tenant base. Strengths: crime A+, employment A+, housing A+; Watch: amenities F, commute F, health & safety F.
- Jefferson County (suburban): math 9% / reading 32% proficiency, ranked #104 of 129 in AL (top 81%) — low school quality limits family demand, transient renter base, plan for 1-2y turnover.
- Market conditions: 129 active listings in the ZIP; 2,114 units permitted in Jefferson County in 2024 (556 in 5+ unit buildings).
Forward outlook
- In year one you build about $33k of equity ($2k loan paydown + $31k appreciation (10.0% local appreciation)).
- Jefferson County population projected to shrink 4% by 2050 — rents likely to lag national; underwrite the cash flow, not the appreciation.
- By year 2, paydown + projected appreciation supports a ~$53k cash-out refi (75% LTV) — recoverable capital for the next deal without selling this one.
Negotiation context
- Only 11 days on market — expect competitive offers; lowballing is unlikely to land.
Risks & watch-outs
- Climate carrying-cost: major wind risk, 27% chance of damaging wind over 30y; extreme-heat days projected 7→19/yr by 2055 (HVAC capex compounding) — expect insurance premiums to compound above CPI over the hold.
Questions for the listing agent
- What do current leases actually rent for vs. the listed asking? Can we see a recent rent roll and the last 12 months of T-12 income?
- Is there a deadline driving the sale (1031 exchange, divorce, estate, relocation)? That informs how much negotiation room exists.
- The area grade is low — what's the realistic commute time and amenity access for the typical tenant pool here? Any planned neighborhood developments (good or bad) we should know about?
- What's the average days-on-market for RENTAL listings here right now (not sales)? A rising rental-DOM trend means longer vacancies and softer asking-rent achievability than the comps imply.
- What's the recent tenant-quality profile in this submarket — average credit score on applications, eviction rate, late-payment / NSF rate, and stable-employment percentage? A property-management company in the area should have these aggregated.
- How much new for-sale + rental construction is in the pipeline within 1–3 miles? Heavy new supply typically softens prices + rents 12–24 months out; constrained supply supports both.
Investment metrics
- 1% rule
- 0.59% ✗
- Cap rate
- 4.59%
- Cash-on-cash
- -6.09%
- DSCR
- 0.73
- GRM
- 14.2
CMA / ARV
- ARV (median comp)
- $327,944
- List price
- $309,900
- Delta
- -1.20%
- Verdict
- FAIR
- Comps
- 20 within 1.0 mi
Show comp detail 12 sales within ~0.75 mi
| Address | Dist | Beds/Ba | Sqft | Sold | Price | $/sf | Match |
|---|---|---|---|---|---|---|---|
| 9792 Deerview Ln | 0.08mi | 3/2.0 | 1,894 (+9%) | 2mo | $325,000 | $172 | 76 |
| 1708 Bone Dry Rd | 0.52mi | 3/2.0 | 1,748 (+1%) | 4mo | $287,000 | $164 | 67 |
| 9188 Hagood Rd | 0.56mi | 3/2.0 | 1,700 (-2%) | 7mo | $307,000 | $181 | 61 |
| 1208 Julie Ln | 0.49mi | 3/2.0 | 1,661 (-4%) | 10mo | $325,000 | $196 | 58 |
| 9510 Pharris Ln | 0.73mi | 3/2.0 | 1,753 (+1%) | 4mo | $267,000 | $152 | 57 |
| 2004 Darwin Cir | 0.66mi | 3/2.0 | 1,610 (-7%) | 1mo | $295,000 | $183 | 52 |
| 9849 Deerview Ln | 0.27mi | 3/2.0 | 1,995 (+15%) | 8mo | $364,900 | $183 | 52 |
| 9268 Promise Trl | 0.25mi | 3/2.0 | 1,895 (+9%) | 23mo | $294,000 | $155 | 50 |
| 2181 Mahaffey Rd | 0.21mi | 3/2.0 | 1,514 (-13%) | 21mo | $212,500 | $140 | 47 |
| 9183 Bill Jones Rd | 0.56mi | 4/3.0 (+1) | 1,928 (+11%) | 13mo | $280,000 | $145 | 40 |
| 9085 Hagood Rd | 0.75mi | 3/2.0 | 1,663 (-4%) | 18mo | $250,000 | $150 | 38 |
| 2191 Country Cove Dr | 0.61mi | 3/2.0 | 1,488 (-14%) | 7mo | $265,000 | $178 | 38 |
Match score weights: distance 35% · size 25% · config 20% · recency 20%. Top-matched comps best support the ARV.
Projected returns pro-forma
10.0% appreciation · 3.0% rent growth · sell at horizon
- IRR
- 20.0%
- Equity multiple
- 2.62×
- Total profit
- $140,608
- Equity at exit
- $279,182
- IRR
- 18.3%
- Equity multiple
- 6.02×
- Total profit
- $435,850
- Equity at exit
- $602,068
Cash invested: $86,772 (down + closing). Projections, not guarantees.
Landlord ↔ Tenant lean methodology
- Overall (STATE)
- 90 Strongly Landlord-Friendly
- State Alabama
- 90 Strongly Landlord-Friendly · R+15
- County
- — inherits STATE
- City
- — inherits STATE
ZIP-level market 35091
- Home prices YoY
- 8.8%
- Active inventory
- 129
- Price-to-rent
- 14.2×
Monthly cashflow live
- Estimated rent
- $1,822 medium interval (Pro) →
- Mortgage (P&I)
- −$1,625
- Tax from tax record
- −$125 /mo · $1,501/yr
- Insurance
- −$129
- HOA
- −$0
- Vacancy / Maint / Mgmt
- −$383
- Net cashflow
- $-440
Break-even live
UW: 25.0% down · 7.5% · 30yr · 1.5% tax · 5.0% vac · 8.0% maint · 8.0% mgmt
Financing live
Cash to close
- Down payment
- $77,475
- Closing costs
- $9,297
- Reserves months
- —
- Total cash needed
- —
Loan-product check · same deal, 3 products live
Conventional
25% down · 7.5% · 30yr
- Down + closing
- —
- Monthly P&I
- —
- Monthly cashflow
- —
- DSCR
- —
- Eligible?
- —
Personal DTI + credit; lowest rate.
DSCR
20% down · 8.5% · 30yr
- Down + closing
- —
- Monthly P&I
- —
- Monthly cashflow
- —
- DSCR
- —
- Eligible?
- —
No personal income docs; deal must DSCR.
Hard money
10% down · 12.0% · 12mo
- Down + closing
- —
- Monthly P&I
- —
- Monthly cashflow
- —
- DSCR
- —
- Eligible?
- —
Short-term bridge; refi at stabilization.
Listing history 11 events
-
2026-06-18days on market $309,900 Active 11 DOM
-
2026-06-17days on market $309,900 Active 10 DOM
-
2026-06-16days on market $309,900 Active 9 DOM
-
2026-06-15days on market $309,900 Active 8 DOM
-
2026-06-13days on market $309,900 Active 6 DOM
-
2026-06-10days on market $309,900 Active 3 DOM
-
2026-06-09days on market $309,900 Active 2 DOM
-
2026-06-08remarks 699-char remark
-
2026-06-08pricestatusdays on market $309,900 Active 1 DOM
-
2026-04-29price $324,000
-
2026-02-24price $334,000
ⓘ Source: listings_history table (triggers on properties + properties_extension) + one-shot
backfill from property_details.listing_events for pre-trigger history.
Tax reassessment forecast AL · Resets to sale price
- Current annual tax
- $1,501 · $125/mo
- Projected year-2 tax
- $1,501 · $125/mo
- Expected delta
- $0/yr ($0/mo · -0.0%)
ⓘ Screening estimate from a state-policy table — verify with the county assessor before closing.
Climate risk First Street
- Flood 1/10 Low FEMA zone X (unshaded) · 0% chance over 30 yrs
- Wildfire 3/10 Moderate
- Heat 6/10 Major 7 d/yr ≥106°F today · 19 d/yr by 30 yrs out
- Wind 6/10 Major 27% chance of damaging wind over 30 yrs
- Air quality 4/10 Moderate 4 unhealthy d/yr today · 6 by 30 yrs out
Nearby sold comps map
Loading sold comps map…
Walkable amenities ~0.75 mi
Loading nearby amenities…
Taxation est. · year 1
- Rental income
- $21,860
- − Mortgage interest
- −$17,359
- − Property taxes
- −$1,501
- − Insurance
- −$1,550
- − Repairs & maintenance
- −$1,749
- − Management
- −$1,749
- − Depreciation
- −$9,015
- Taxable loss
- −$11,062
- Est. tax savings @ 24.0%
- +$2,655
- After-tax cash flow
- $-2,628/yr
For passive investors: Depreciation is non-cash, so a rental often shows a tax loss while cash-flowing — sheltering income. Rental losses are passive: they offset passive income freely, and up to $25,000/yr can offset ordinary (W-2) income if you actively participate and your MAGI is under $100k (phasing out to $0 by $150k); unused losses carry forward. On sale, claimed depreciation is recaptured at up to 25%, and gains may owe capital-gains tax (a 1031 exchange can defer both). Figures are a year-1 estimate at your 24.0% rate — not tax advice; consult a CPA.
Schools (NCES district)
- District
- Jefferson County
- NCES district ID
- 0101920
- Math proficiency
- 9% ▼ -24.00%
- Reading proficiency
- 32% ▼ -5.00%
- Median HH income
- $51,712
- Composite
- 18.4/100
- National rank
- #8937
- State rank
- #104 of 129 in AL
Livability — Kimberly
- Score
- 66/100
- State rank
- #99
- US rank
- #11415
Category grades
Schools grade is shown separately in the Schools card above.
Census & demographics
- Census place
- Kimberly, AL
- Population (ZIP)
- 3,632
Population outlook (Jefferson County) Hauer SSP2
- Today (2025)
- 669,185 people
- By 2030
- 669,694 · +0.1%
- By 2040
- 661,388 · -1.2%
- By 2050
- 643,086 · -3.9%
- By 2075
- 577,267 · -13.7%
- By 2100
- 474,758 · -29.1%
Race, ethnicity, and origin ACS 2023
- Neighborhood character
- Predominantly White (92%)
- Race & ethnicity
- White 92% Black 5% Two or more races 2%
- Common ancestry
- Italian 7% Slovak 4% Lithuanian 3%
- Foreign-born
- 1% · Canada, South Korea
- Languages at home
- 99% English-only · Korean 1% Other Indo-European 1%
Political lean MEDSL · Jefferson
- 2024 margin
- D (+10.4) · D 54.6% · R 44.2% · Other 1.2%
- 2008→2024 swing
- +5.4pp toward D · 2008: 5.1pp · 2024: 10.4pp
- All cycles
- 2024: D+10.4 2020: D+13.2 2016: D+7.2 2012: D+6.0 2008: D+5.1
Not yet ingested
- Civics
- —
Market trends
- HPI YoY
- ▲ 21.37%
- Current HPI
- 265.4636
- Rent YoY
- —
- Metro
- —
- State GDP YoY
- ▲ 2.94%
- F500 in state
- 4
Industry mix (Fortune 500 HQ in AL)
| Industry | F500 HQs | Revenue |
|---|---|---|
| Financial Services | 1 | $8B |
|
||
| Healthcare | 1 | $5B |
|
||
Price history
-3.0% since first listed2 events — show timeline
- 2026-04-29 Price Changed $324,000 Greater Alabama MLS
- 2026-02-24 Price Changed $334,000 Greater Alabama MLS
Property tax history
+7.3%/yrLatest (2025): $1,501 · +0.0% YoY. Source: county tax records.
Cash-flow waterfall
monthlySold comps — $/sqft
last 12 mo · ≤1 miLoading sold comps…