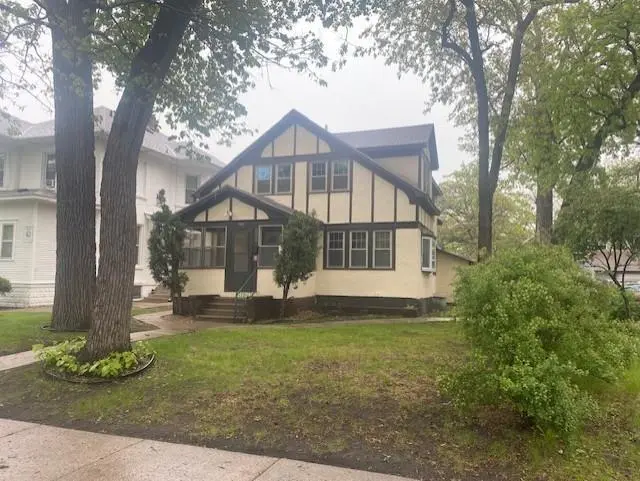
506 7th Ave S · St. Cloud, MN
Flood risk 1/10 · Minimal
- FEMA flood zone
- X (unshaded)
- Chance of flooding over 30 yrs
- 0.0%
- Est. flood insurance / yr
- $507 – $1,088
Fire risk 1/10 · Minimal
- Est. fire insurance / yr
- $888 – $1,650
Heat risk 2/10 · Minimal
- Hot days now (above 97°F)
- 7 days/yr
- Hot days in 30 yrs
- 13 days/yr
Wind risk 2/10 · Minimal
- Chance of severe wind over 30 yrs
- —
Air-quality risk 3/10 · Minor
- Unhealthy air days now
- 3 days/yr
- Unhealthy air days in 30 yrs
- 3 days/yr
Risk factors via First Street. Map © Google.
Why this score? — see what drove the C+ grade
The composite is a weighted blend of 9 inputs, each scored 0–100. Each bar is that input's sub-score; the figure is the points it added to the 100-point composite (weight × sub-score).
- Cash flow +27.6/30.0
- DSCR +9.7/10.0
- ARV discount +7.5/15.0
- 1% rule +7.1/10.0
- Rent growth +3.3/5.0
- Schools +2.8/10.0
- Livability +2.5/5.0
- Condition / age +2.5/5.0
- Appreciation +0.0/10.0
$155,000
🖨 Deal sheet 📄 Offer letter ✓ Due diligence
Listing remarks
Five Bedroom home. Sold AS-IS.
Key facts
- 6,098 sq ft lot
- Garage
- Built 1924
Property features AI
Finance
- Other: Property type: Residential
- Financial info: Rental license: Standard (licensed for rental)
Exterior
- Parking: Attached 1-car garage
- Utilities: City water connected; City sewer connected; Natural gas
- Home design: Residential property; Two levels
- Construction: Other foundation; Above-grade finished area approximately 1,374; Below-grade finished area approximately 198; Total living area approximately 1,572; Building area total approximately 2,272
- Exterior features: Stucco exterior; Lot approximately 0.14 acres (45 x 132)
Interior
- Bedrooms: 5 bedrooms
- Bathrooms: 2 three-quarter bathrooms
- Heating & cooling: Forced air heating; Central air conditioning
- Interior features: Basement with unspecified/other features; Forced air heating; Central air conditioning
Neighborhood map
What this means for you Summary
Snapshot
- This is a 5-bed/2.0-bath single-family listed at $155k.
Deal economics
- At list price, monthly cash flow is $463 ($6k/yr) — positive.
- The deal already cash-flows at list — no discount required.
- Meets the 1% rule at list price ($2k rent vs $155k).
- Recommended offer: $153k (1.5% below list) — sets the bar for market timing.
- Cap rate 9.9% vs local median 3.9% in St. Cloud — top-decile yield for the area; either an underpriced asset or a hidden risk that comps aren't pricing in. Stress-test before assuming the spread holds.
Location & tenants
- Location reads: area grade C — affects rentability + tenant quality, not the cash-flow math above.
- St. Cloud Public School District (urban): math 27% / reading 38% proficiency, ranked #264 of 301 in MN (top 88%) — families likely to look elsewhere, expect single-tenant / working-renter base with shorter leases.
- Market conditions: Rents rising (+3.4%/yr); 218 active listings in the ZIP; 8 comparable units currently listed for rent nearby; rentals lingering (median 44d on market — plan ~5-8 weeks vacancy on turnover, expect pricing pressure); 88% of comp listings sitting > 30 days — soft ceiling on asking rent; 661 units permitted in Stearns County in 2024 (291 in 5+ unit buildings).
- This rent runs 31% of the median local income ($73k/yr) — at the standard rent-burdened threshold; future hikes will face affordability resistance.
Forward outlook
- Local home prices are declining (-3.0%/yr); year-one equity from $1k of loan paydown is wiped out by about $5k of value loss. Plan a longer hold.
- Stearns County population projected at +9% by 2050 — modest demand growth; plan on rents tracking national, not racing it.
- At projected returns (-3.0% appreciation + 3.4% rent growth), your $43k cash investment doubles in ~9 years — after that, you're playing with house money.
Negotiation context
- It's been on market 25 days — a 2% lower offer ($153k) is reasonable based on typical stale-listing flexibility.
- 2 sale attempts; this cycle's ask has dropped $10k (6%) from the opening price — seller is motivated, your offer sets the floor, not the list.
Risks & watch-outs
- Watch-outs: built in 1924 — expect roof / HVAC / electrical / plumbing capex.
Questions for the listing agent
- Built in 1924 — when were the roof, HVAC, electrical panel, plumbing, and water heater last replaced?
- Is there a deadline driving the sale (1031 exchange, divorce, estate, relocation)? That informs how much negotiation room exists.
- What's the average days-on-market for RENTAL listings here right now (not sales)? A rising rental-DOM trend means longer vacancies and softer asking-rent achievability than the comps imply.
- What's the recent tenant-quality profile in this submarket — average credit score on applications, eviction rate, late-payment / NSF rate, and stable-employment percentage? A property-management company in the area should have these aggregated.
- How much new for-sale + rental construction is in the pipeline within 1–3 miles? Heavy new supply typically softens prices + rents 12–24 months out; constrained supply supports both.
Investment metrics
- 1% rule
- 1.21% ✓
- Cap rate
- 9.87%
- Cash-on-cash
- 12.79%
- DSCR
- 1.57
- GRM
- 6.9
CMA / ARV
No comps found within radius.
Projected returns pro-forma
-3.0% appreciation · 3.38% rent growth · sell at horizon
- IRR
- 3.0%
- Equity multiple
- 1.12×
- Total profit
- $5,071
- Equity at exit
- $23,111
- IRR
- 12.9%
- Equity multiple
- 2.04×
- Total profit
- $45,340
- Equity at exit
- $13,402
Cash invested: $43,400 (down + closing). Projections, not guarantees.
Landlord ↔ Tenant lean methodology
- Overall (STATE)
- 46 Balanced
- State Minnesota
- 46 Balanced · D+2
- County
- — inherits STATE
- City
- — inherits STATE
ZIP-level market 56301
- Rents YoY
- 3.4%
- Active inventory
- 218
- Price-to-rent
- 6.9×
Monthly cashflow live
- Estimated rent
- $1,881 high interval (Pro) →
- Mortgage (P&I)
- −$813
- Tax from tax record
- −$146 /mo · $1,748/yr
- Insurance
- −$65
- HOA
- −$0
- Vacancy / Maint / Mgmt
- −$395
- Net cashflow
- $463
Break-even live
UW: 25.0% down · 7.5% · 30yr · 1.5% tax · 5.0% vac · 8.0% maint · 8.0% mgmt
Financing live
Cash to close
- Down payment
- $38,750
- Closing costs
- $4,650
- Reserves months
- —
- Total cash needed
- —
Loan-product check · same deal, 3 products live
Conventional
25% down · 7.5% · 30yr
- Down + closing
- —
- Monthly P&I
- —
- Monthly cashflow
- —
- DSCR
- —
- Eligible?
- —
Personal DTI + credit; lowest rate.
DSCR
20% down · 8.5% · 30yr
- Down + closing
- —
- Monthly P&I
- —
- Monthly cashflow
- —
- DSCR
- —
- Eligible?
- —
No personal income docs; deal must DSCR.
Hard money
10% down · 12.0% · 12mo
- Down + closing
- —
- Monthly P&I
- —
- Monthly cashflow
- —
- DSCR
- —
- Eligible?
- —
Short-term bridge; refi at stabilization.
Rent comps 8 comps
| Address | Beds | Baths | Sqft | Rent | $/sqft | DOM | Units | Dist |
|---|---|---|---|---|---|---|---|---|
| 624 13th St S Unit US-201 St Cloud, MN | 4.0 | 1.0 | 1250 | $1,495 | $1.20 | 43d | 1 | 0.56mi |
| 801 15th Ave S Unit 1 St Cloud, MN | 4.0 | 2.0 | 1525 | $1,900 | $1.25 | 43d | 1 | 0.61mi |
| 524 14th St S Unit 304 St Cloud, MN | 4.0 | 1.0 | 1200 | $1,245 | $1.04 | 43d | 1 | 0.64mi |
| 520 14th St S Unit ST-403 St Cloud, MN | 4.0 | 1.0 | 1200 | $1,245 | $1.04 | 43d | 1 | 0.64mi |
| 1510 9th Ave S St Cloud, MN | 4.0 | 2.0 | 1100 | $1,095 | $1.00 | 43d | 1 | 0.72mi |
| 1205 11th St SE Saint Cloud, MN | 4.0 | 2.0 | 1416 | $2,450 | $1.73 | 43d | 1 | 1.05mi |
| 1225 13th St SE Saint Cloud, MN | 4.0 | 3.0 | 1500 | $2,450 | $1.63 | 43d | 1 | 1.09mi |
| 1615 15th Ave SE St Cloud, MN | 2.0–4.0 | 1.0–3.0 | 1312 | $2,722 | $2.07 | 1d | 8 | 1.30mi |
Listing history 21 events
-
2026-06-19days on market $155,000 Active 25 DOM
-
2026-06-18days on market $155,000 Active 24 DOM
-
2026-06-17days on market $155,000 Active 23 DOM
-
2026-06-16days on market $155,000 Active 22 DOM
-
2026-06-15days on market $155,000 Active 21 DOM
-
2026-06-14days on market $155,000 Active 19 DOM
-
2026-06-13days on market $155,000 Active 18 DOM
-
2026-06-10days on market $155,000 Active 16 DOM
-
2026-06-09days on market $155,000 Active 15 DOM
-
2026-06-08days on market $155,000 Active 14 DOM
-
2026-06-07days on market $155,000 Active 13 DOM
-
2026-06-03days on market $155,000 Active 9 DOM
-
2026-06-03price $155,000 Active 8 DOM
-
2026-06-02days on market $165,000 Active 8 DOM
-
2026-06-01days on market $165,000 Active 7 DOM
-
2026-05-31days on market $165,000 Active 6 DOM
-
2026-05-30days on market $165,000 Active 5 DOM
-
2026-05-25$165,000 Active
-
2025-11-01historical
-
2025-08-04price $155,000
-
2025-07-15$165,000 Active
ⓘ Source: listings_history table (triggers on properties + properties_extension) + one-shot
backfill from property_details.listing_events for pre-trigger history.
Tax reassessment forecast MN · Partial reset (capped growth)
- Current annual tax
- $1,748 · $146/mo
- Projected year-2 tax
- $1,748 · $146/mo
- Expected delta
- $0/yr ($0/mo · 0.0%)
ⓘ Screening estimate from a state-policy table — verify with the county assessor before closing.
Climate risk First Street
- Flood 1/10 Low FEMA zone X (unshaded) · 0% chance over 30 yrs
- Wildfire 1/10 Low
- Heat 2/10 Low 7 d/yr ≥97°F today · 13 d/yr by 30 yrs out
- Wind 2/10 Low
- Air quality 3/10 Moderate 3 unhealthy d/yr today · 3 by 30 yrs out
Nearby sold comps map
Loading sold comps map…
Walkable amenities ~0.75 mi
Loading nearby amenities…
Taxation est. · year 1
- Rental income
- $22,568
- − Mortgage interest
- −$8,682
- − Property taxes
- −$1,748
- − Insurance
- −$775
- − Repairs & maintenance
- −$1,805
- − Management
- −$1,805
- − Depreciation
- −$4,509
- Taxable income
- $3,243
- Est. tax owed @ 24.0%
- −$778
- After-tax cash flow
- $4,774/yr
For passive investors: Depreciation is non-cash, so a rental often shows a tax loss while cash-flowing — sheltering income. Rental losses are passive: they offset passive income freely, and up to $25,000/yr can offset ordinary (W-2) income if you actively participate and your MAGI is under $100k (phasing out to $0 by $150k); unused losses carry forward. On sale, claimed depreciation is recaptured at up to 25%, and gains may owe capital-gains tax (a 1031 exchange can defer both). Figures are a year-1 estimate at your 24.0% rate — not tax advice; consult a CPA.
Schools (NCES district)
- District
- St. Cloud Public School District
- NCES district ID
- 2733510
- Math proficiency
- 27% ▼ -9.00%
- Reading proficiency
- 38% ▼ -5.00%
- Median HH income
- $46,638
- Composite
- 27.91/100
- National rank
- #6866
- State rank
- #264 of 301 in MN
Livability — St. Cloud
No livability data for this city. (Only ~50 U.S. cities are tracked.)
Census & demographics
- Census place
- St. Cloud, MN
- County
- Stearns County · 90,226 people
- City population
- 60,914
- Metro
- St. Cloud, MN
- Population (ZIP)
- 35,580
- Household income
- $73,142
- Rent vs Own
- Severe rent burden
- 1831.0
Population outlook (Stearns County) Hauer SSP2
- Today (2025)
- 162,629 people
- By 2030
- 166,495 · +2.4%
- By 2040
- 172,661 · +6.2%
- By 2050
- 177,480 · +9.1%
- By 2075
- 192,907 · +18.6%
- By 2100
- 206,274 · +26.8%
Race, ethnicity, and origin ACS 2023
- Neighborhood character
- Predominantly White (66%)
- Race & ethnicity
- White 66% Black 20% Hispanic / Latino 6% Two or more races 6% Asian 4%
- Hispanic origin (detail)
- Mexican 2% Puerto Rican 1%
- Common ancestry
- Portuguese 6% Romanian 4% Lithuanian 2%
- Foreign-born
- 16% · Canada, Vietnam
- Languages at home
- 77% English-only · Spanish 4% Other Asian/Pacific 2% Other Indo-European 1%
Political lean MEDSL · Stearns
- 2024 margin
- Strong R (+26.8) · D 35.7% · R 62.5% · Other 1.9%
- 2008→2024 swing
- -19.8pp toward R · 2008: -7.0pp · 2024: -26.8pp
- All cycles
- 2024: R+26.8 2020: R+22.5 2016: R+27.9 2012: R+12.1 2008: R+7.0
Not yet ingested
- Civics
- —
Market trends
- HPI YoY
- ▼ -102.70%
- Current HPI
- 148.6882
- Rent YoY
- ▲ 3.38%
- Metro
- St. Cloud, MN
- State GDP YoY
- ▲ 2.41%
- F500 in state
- 34
Industry mix (Fortune 500 HQ in MN)
| Industry | F500 HQs | Revenue |
|---|---|---|
| Healthcare | 2 | $407B |
|
||
| Retail | 2 | $150B |
|
||
| Consumer Goods | 2 | $32B |
|
||
| Industrial Machinery | 2 | $6B |
|
||
| Agriculture | 1 | $40B |
|
||
| Healthcare / Medical Devices | 1 | $32B |
|
||
Price history
+0.0% since first listed4 events — show timeline
- 2026-05-25 Listed $165,000 NORTHSTARMLS as Distributed by MLS Grid
- 2025-11-01 Listing Removed — NORTHSTARMLS as Distributed by MLS Grid
- 2025-08-04 Price Changed $155,000 NORTHSTARMLS as Distributed by MLS Grid
- 2025-07-15 Listed $165,000 NORTHSTARMLS as Distributed by MLS Grid
Property tax history
+1.1%/yrLatest (2025): $1,748 · +1.6% YoY. Source: county tax records.
Cash-flow waterfall
monthlySold comps — $/sqft
last 12 mo · ≤1 miLoading sold comps…