 Duplex
2705 Stanford St · Rowlett, TX
Flood risk 1/10 · Minimal
- FEMA flood zone
- X (unshaded)
- Chance of flooding over 30 yrs
- 0.0%
- Est. flood insurance / yr
- $507 – $1,088
Fire risk 1/10 · Minimal
- Est. fire insurance / yr
- $1,222 – $2,270
Heat risk 8/10 · Major
- Hot days now (above 110°F)
- 7 days/yr
- Hot days in 30 yrs
- 25 days/yr
Wind risk 6/10 · Moderate
- Chance of severe wind over 30 yrs
- 27.0%
Air-quality risk 2/10 · Minimal
- Unhealthy air days now
- 2 days/yr
- Unhealthy air days in 30 yrs
- 2 days/yr
Risk factors via First Street. Map © Google.
Why this score? — see what drove the D grade
The composite is a weighted blend of 9 inputs, each scored 0–100. Each bar is that input's sub-score; the figure is the points it added to the 100-point composite (weight × sub-score).
- Cash flow +12.4/30.0
- ARV discount +9.8/15.0
- 1% rule +4.6/10.0
- Livability +3.8/5.0
- DSCR +3.7/10.0
- Schools +2.9/10.0
- Condition / age +2.5/5.0
- Rent growth +2.2/5.0
- Appreciation +1.6/10.0
$375,000
🖨 Deal sheet (PDF) 📄 Offer letter ✓ Due diligence
Multi-family units
County records classify this as Multi-Family (2-4 Unit). Listing-text estimate: 2 units. confirmed
Listing remarks MLS
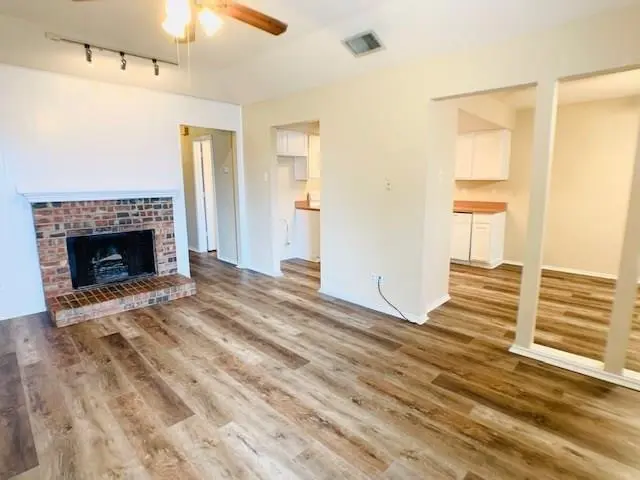
Income-producing Duplex near the Bayside area and I-30! Great Opportunity with walking distance to the lake. Easy access to shopping, commuting and dining. Offering 2 bedrooms and 2 bathrooms on each side, the property is perfectly situated and designed for comfortable living for commuters or investors! Minor updates will make this place shine. Each unit features spacious interiors with open floor plan and functional layouts. A single-car garage per unit offers additional convenience. Whether moving in and leasing the other side or lease both sides, this is a great property to choice for anyone wanting to invest in! Each side has a tenant on a month to month basis. Easy to show. Contact me for your tour today!
Key facts
- Spacious interiors
- Open floor plan
- Functional layouts
Tags
Neighborhood map
What this means for you Summary
Snapshot
- This is a 2 × 2-bed/1.0-bath units multifamily listed at $375k.
Deal economics
- At list price, monthly cash flow is $-64 ($-765/yr) — negative. Per door: $-32/mo.
- To cash-flow at today's rent, offer at most $364k (3.0% below list).
- To meet the 1% rule (rent ≥ 1% of price), the offer needs to be $360k (4.1% below list).
- Recommended offer: $352k (6.0% below list) — sets the bar for market timing.
- Cap rate 6.1% vs local median 3.1% in Rowlett — top-decile yield for the area; either an underpriced asset or a hidden risk that comps aren't pricing in. Stress-test before assuming the spread holds.
Location & tenants
- Location reads 75/100 on livability (#147 in TX, #4,150 nationally) — a middle-class / working-renter tenant base. Strengths: employment A+, housing A+, crime A-; Watch: amenities F, commute F, health & safety D-.
- Garland ISD (suburban): math 27% / reading 37% proficiency, ranked #553 of 826 in TX (top 67%) — families likely to look elsewhere, expect single-tenant / working-renter base with shorter leases.
- Zoned schools: Daugherty El (math 22% / reading 29%, grade F, #2,982 of 4,322 statewide, top 70%, 810 students, 94% FRL); B G Hudson Middle (math 33% / reading 42%, grade F, #736 of 1,662 statewide, top 45%, 1,207 students, 50% FRL); Sachse H S (math 46% / reading 53%, grade D, #509 of 1,632 statewide, top 34%, 2,997 students, 43% FRL).
- Market conditions: Rents soft (-1.2%/yr); 300 active listings in the ZIP; 6 comparable units currently listed for rent nearby; rentals lingering (median 46d on market — plan ~5-8 weeks vacancy on turnover, expect pricing pressure); 67% of comp listings sitting > 30 days — soft ceiling on asking rent; solid renter incomes; 12,577 units permitted in Dallas County in 2024 (6,829 in 5+ unit buildings).
- This rent runs 41% of the median local income ($105k/yr) — at the standard rent-burdened threshold; future hikes will face affordability resistance.
Forward outlook
- Local home prices are declining (-3.0%/yr); year-one equity from $3k of loan paydown is wiped out by about $11k of value loss. Plan a longer hold.
- Dallas County population projected at +35% by 2050 — long-run rental-demand tailwind backs the buy-and-hold thesis.
Negotiation context
- It's been on market 65 days — a 6% lower offer ($352k) is reasonable based on typical stale-listing flexibility.
Risks & watch-outs
- Climate carrying-cost: major wind risk, 27% chance of damaging wind over 30y; extreme-heat days projected 7→25/yr by 2055 (HVAC capex compounding) — expect insurance premiums to compound above CPI over the hold.
Questions for the listing agent
- What do current leases actually rent for vs. the listed asking? Can we see a recent rent roll and the last 12 months of T-12 income?
- It's been on market 65 days. Have you received any prior offers? Is the seller open to a 6% concession, seller financing, or rate buy-down credit?
- Can we see the unit-by-unit rent roll, current vacancy, and any below-market leases? What's the average tenancy length?
- What capital expenditures (roof, boiler, parking lot, exteriors) have been made in the last 5 years, and what's planned in the next 2?
- Why hasn't it sold? Are there any deal-killer items the seller is aware of (foundation, flood, title, zoning, code violations)?
- Is there a deadline driving the sale (1031 exchange, divorce, estate, relocation)? That informs how much negotiation room exists.
- The area grade is low — what's the realistic commute time and amenity access for the typical tenant pool here? Any planned neighborhood developments (good or bad) we should know about?
- What's the average days-on-market for RENTAL listings here right now (not sales)? A rising rental-DOM trend means longer vacancies and softer asking-rent achievability than the comps imply.
- What's the recent tenant-quality profile in this submarket — average credit score on applications, eviction rate, late-payment / NSF rate, and stable-employment percentage? A property-management company in the area should have these aggregated.
- How much new apartment / multifamily construction is in the pipeline within 1–3 miles? Heavy new supply (>2% of stock underway) typically softens rents 12–24 months out; light construction supports rent growth.
Investment metrics
- 1% rule
- 0.96% ✗
- Cap rate
- 6.09%
- Cash-on-cash
- -0.73%
- DSCR
- 0.97
- GRM
- 8.7
CMA / ARV
- ARV (median comp)
- $395,249
- List price
- $375,000
- Delta
- -5.12%
- Verdict
- FAIR
- Comps
- 4 within 1.0 mi
Projected returns pro-forma
-3.0% appreciation · 0.0% rent growth · sell at horizon
- IRR
- -21.3%
- Equity multiple
- 0.28×
- Total profit
- $-75,116
- Equity at exit
- $55,914
- IRR
- -25.6%
- Equity multiple
- -0.05×
- Total profit
- $-110,355
- Equity at exit
- $32,423
Cash invested: $105,000 (down + closing). Projections, not guarantees.
Landlord ↔ Tenant lean methodology
- Overall (STATE)
- 87 Strongly Landlord-Friendly
- State Texas
- 87 Strongly Landlord-Friendly · R+5
- County
- — inherits STATE
- City
- — inherits STATE
ZIP-level market 75088
- Home prices YoY
- -2.0%
- Rents YoY
- -1.2%
- Active inventory
- 300
- Price-to-rent
- 17.4×
Monthly cashflow live
- Estimated rent
- $3,595 high interval (Pro) →
- Mortgage (P&I)
- −$1,967
- Tax from tax record
- −$781 /mo · $9,372/yr
- Insurance
- −$156
- HOA
- −$0
- Vacancy / Maint / Mgmt
- −$755
- Net cashflow
- $-64
Break-even live
Sensitivity live
| Price | -10% $149 | -5% $42 | +0% $-64 | +5% $-170 | +10% $-276 |
|---|---|---|---|---|---|
| Rent | -10% $-348 | -5% $-206 | +0% $-64 | +5% $78 | +10% $220 |
| Rate | -1.0pp $125 | -0.5pp $32 | base $-64 | +0.5pp $-161 | +1.0pp $-260 |
2-unit breakdown (identical units grouped — click to expand)
| Units | Beds | Baths | Est. rent |
|---|---|---|---|
| 2× units | 2 | 1 | $3,596 |
| #1 | 2 | 1 | $1,798 |
| #2 | 2 | 1 | $1,798 |
| Total (2 units) | $3,595 | ||
UW: 25.0% down · 7.5% · 30yr · 1.5% tax · 5.0% vac · 8.0% maint · 8.0% mgmt
Financing live
Cash to close
- Down payment
- $93,750
- Closing costs
- $11,250
- Reserves months
- —
- Total cash needed
- —
Loan-product check · same deal, 3 products live
Conventional
25% down · 7.5% · 30yr
- Down + closing
- —
- Monthly P&I
- —
- Monthly cashflow
- —
- DSCR
- —
- Eligible?
- —
Personal DTI + credit; lowest rate.
DSCR
20% down · 8.5% · 30yr
- Down + closing
- —
- Monthly P&I
- —
- Monthly cashflow
- —
- DSCR
- —
- Eligible?
- —
No personal income docs; deal must DSCR.
Hard money
10% down · 12.0% · 12mo
- Down + closing
- —
- Monthly P&I
- —
- Monthly cashflow
- —
- DSCR
- —
- Eligible?
- —
Short-term bridge; refi at stabilization.
Rent comps 6 comps
| Address | Beds | Baths | Sqft | Rent | $/sqft | DOM | Units | Dist |
|---|---|---|---|---|---|---|---|---|
| 3514 Key Largo Dr Rowlett, TX | 5.0 | 2.5 | 1915 | $2,500 | $1.31 | 45d | 1 | 0.64mi |
| 8407 Cornerstone Dr Rowlett, TX | 5.0 | 4.0 | 3658 | $3,980 | $1.09 | 45d | 1 | 0.95mi |
| 8407 Cornerstone Dr Rowlett, TX | 5.0 | 4.0 | 2951 | $3,880 | $1.31 | 9d | 1 | 0.95mi |
| 4713 Highgate Ln Rowlett, TX | 5.0 | 2.5 | 2747 | $10,950 | $3.99 | 45d | 1 | 1.25mi |
| 4610 Clay Dr Rowlett, TX | 7.0 | 3.5 | 2782 | $4,000 | $1.44 | 46d | 1 | 1.32mi |
| 7006 Shipp Rd Unit 1056391P Rowlett, TX | 2.0–8.0 | 1.0–5.5 | 3842 | $17,676 | $4.60 | 0d | 2 | 1.38mi |
Listing history 17 events
-
2026-06-21days on market $375,000 Active 65 DOM
-
2026-06-18days on market $375,000 Active 62 DOM
-
2026-06-17days on market $375,000 Active 61 DOM
-
2026-06-16days on market $375,000 Active 60 DOM
-
2026-06-15days on market $375,000 Active 59 DOM
-
2026-06-13days on market $375,000 Active 57 DOM
-
2026-06-09days on market $375,000 Active 53 DOM
-
2026-06-08days on market $375,000 Active 52 DOM
-
2026-06-07days on market $375,000 Active 51 DOM
-
2026-06-04days on market $375,000 Active 48 DOM
-
2026-06-03days on market $375,000 Active 47 DOM
-
2026-06-02days on market $375,000 Active 46 DOM
-
2026-06-01days on market $375,000 Active 45 DOM
-
2026-05-31days on market $375,000 Active 44 DOM
-
2026-05-15historical Active Option Contract 721-char remark
Show marketing remark (721 chars)
Income-producing Duplex near the Bayside area and I-30! Great Opportunity with walking distance to the lake. Easy access to shopping, commuting and dining. Offering 2 bedrooms and 2 bathrooms on each side, the property is perfectly situated and designed for comfortable living for commuters or investors! Minor updates will make this place shine. Each unit features spacious interiors with open floor plan and functional layouts. A single-car garage per unit offers additional convenience. Whether moving in and leasing the other side or lease both sides, this is a great property to choice for anyone wanting to invest in! Each side has a tenant on a month to month basis. Easy to show. Contact me for your tour today!
-
2026-04-17$375,000 Active 721-char remark
Show marketing remark (721 chars)
Income-producing Duplex near the Bayside area and I-30! Great Opportunity with walking distance to the lake. Easy access to shopping, commuting and dining. Offering 2 bedrooms and 2 bathrooms on each side, the property is perfectly situated and designed for comfortable living for commuters or investors! Minor updates will make this place shine. Each unit features spacious interiors with open floor plan and functional layouts. A single-car garage per unit offers additional convenience. Whether moving in and leasing the other side or lease both sides, this is a great property to choice for anyone wanting to invest in! Each side has a tenant on a month to month basis. Easy to show. Contact me for your tour today!
-
1987-11-12soldstatus
ⓘ Source: listings_history table (triggers on properties + properties_extension) + one-shot
backfill from property_details.listing_events for pre-trigger history.
Tax reassessment forecast TX · Resets to sale price
- Current annual tax
- $9,372 · $781/mo
- Projected year-2 tax
- $9,372 · $781/mo
- Expected delta
- $0/yr ($0/mo · 0.0%)
ⓘ Screening estimate from a state-policy table — verify with the county assessor before closing.
Climate risk First Street
- Flood 1/10 Low FEMA zone X (unshaded) · 0% chance over 30 yrs
- Wildfire 1/10 Low
- Heat 8/10 Severe 7 d/yr ≥110°F today · 25 d/yr by 30 yrs out
- Wind 6/10 Major 27% chance of damaging wind over 30 yrs
- Air quality 2/10 Low 2 unhealthy d/yr today · 2 by 30 yrs out
Nearby sold comps map
Loading sold comps map…
Walkable amenities ~0.75 mi
Loading nearby amenities…
Taxation est. · year 1
- Rental income
- $43,140
- − Mortgage interest
- −$21,006
- − Property taxes
- −$9,372
- − Insurance
- −$1,875
- − Repairs & maintenance
- −$3,451
- − Management
- −$3,451
- − Depreciation
- −$10,909
- Taxable loss
- −$6,925
- Est. tax savings @ 24.0%
- +$1,662
- After-tax cash flow
- $897/yr
For passive investors: Depreciation is non-cash, so a rental often shows a tax loss while cash-flowing — sheltering income. Rental losses are passive: they offset passive income freely, and up to $25,000/yr can offset ordinary (W-2) income if you actively participate and your MAGI is under $100k (phasing out to $0 by $150k); unused losses carry forward. On sale, claimed depreciation is recaptured at up to 25%, and gains may owe capital-gains tax (a 1031 exchange can defer both). Figures are a year-1 estimate at your 24.0% rate — not tax advice; consult a CPA.
Schools (NCES district)
- District
- Garland ISD
- NCES district ID
- 4820340
- Math proficiency
- 27% ▼ -23.00%
- Reading proficiency
- 37% ▼ -10.00%
- Median HH income
- $58,392
- Composite
- 28.63/100
- National rank
- #6706
- State rank
- #553 of 826 in TX
Livability — Rowlett
- Score
- 75/100
- State rank
- #147
- US rank
- #4150
Category grades
Schools grade is shown separately in the Schools card above.
Census & demographics
- Census place
- Rowlett, TX
- County
- Dallas County · 2,612,404 people
- City population
- 35,619
- Metro
- Dallas-Fort Worth-Arlington, TX
- Population (ZIP)
- 28,075
- Household income
- $105,313
- Rent vs Own
- Severe rent burden
- 626.0
Population outlook (Dallas County) Hauer SSP2
- Today (2025)
- 2,979,839 people
- By 2030
- 3,191,823 · +7.1%
- By 2040
- 3,619,611 · +21.5%
- By 2050
- 4,026,915 · +35.1%
- By 2075
- 4,957,073 · +66.4%
- By 2100
- 5,508,725 · +84.9%
Race, ethnicity, and origin ACS 2023
- Neighborhood character
- Diverse neighborhood (Simpson 0.62)
- Race & ethnicity
- White 56% Hispanic / Latino 19% Black 18% Two or more races 10% Asian 4%
- Hispanic origin (detail)
- Mexican 15%
- Common ancestry
- Slovak 3% Italian 2% Romanian 2%
- Foreign-born
- 10% · Canada, Vietnam
- Languages at home
- 84% English-only · Spanish 11% Other Indo-European 1% Other Asian/Pacific 1%
Political lean MEDSL · Dallas
- 2024 margin
- Strong D (+22.2) · D 60.2% · R 38.0% · Other 1.8%
- 2008→2024 swing
- +6.9pp toward D · 2008: 15.3pp · 2024: 22.2pp
- All cycles
- 2024: D+22.2 2020: D+31.6 2016: D+26.2 2012: D+15.4 2008: D+15.3
Not yet ingested
- Civics
- —
Market trends
- HPI YoY
- ▼ -6.72%
- Current HPI
- 328.27
- Rent YoY
- ▼ -1.22%
- Metro
- Dallas-Fort Worth-Arlington, TX
- State GDP YoY
- ▲ 3.95%
- F500 in state
- 110
Industry mix (Fortune 500 HQ in TX)
| Industry | F500 HQs | Revenue |
|---|---|---|
| Energy | 16 | $1,198B |
|
||
| Technology | 5 | $198B |
|
||
| Engineering / Construction | 4 | $72B |
|
||
| Energy Services | 3 | $60B |
|
||
| Utilities | 3 | $41B |
|
||
| Healthcare | 2 | $330B |
|
||
Price history
3 events — show timeline
- 2026-05-15 Contingent — NTREIS
- 2026-04-17 Listed $375,000 NTREIS
- 1987-11-12 Sold (Public Records) — Public Records
Property tax history
+7.5%/yrLatest (2025): $9,372 · +6.8% YoY. Source: county tax records.
Cash-flow waterfall
monthlySold comps — $/sqft
last 12 mo · ≤1 miLoading sold comps…