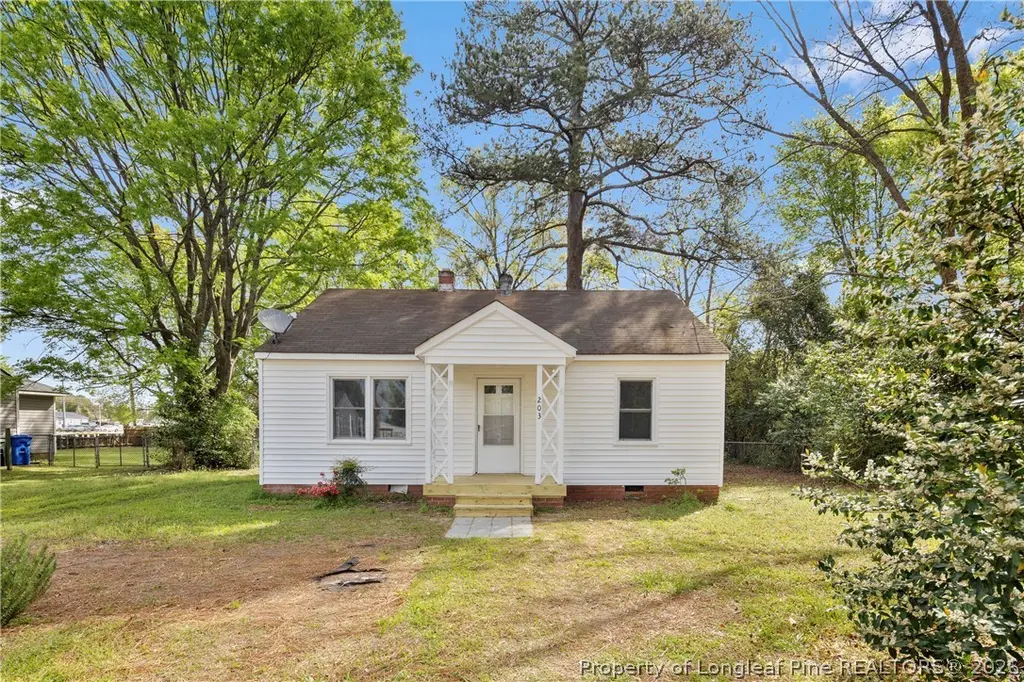
203 Rodie Ave · Fayetteville, NC
Flood risk 6/10 · Moderate
- FEMA flood zone
- X (unshaded)
- Chance of flooding over 30 yrs
- 0.73%
- Est. flood insurance / yr
- $507 – $1,088
Fire risk 1/10 · Minimal
- Est. fire insurance / yr
- $906 – $1,684
Heat risk 7/10 · Major
- Hot days now (above 106°F)
- 7 days/yr
- Hot days in 30 yrs
- 16 days/yr
Wind risk 7/10 · Major
- Chance of severe wind over 30 yrs
- 76.0%
Air-quality risk 1/10 · Minimal
- Unhealthy air days now
- 0 days/yr
- Unhealthy air days in 30 yrs
- 0 days/yr
Risk factors via First Street. Map © Google.
Why this score? — see what drove the D grade
The composite is a weighted blend of 9 inputs, each scored 0–100. Each bar is that input's sub-score; the figure is the points it added to the 100-point composite (weight × sub-score).
- Cash flow +14.6/30.0
- ARV discount +6.7/15.0
- DSCR +4.4/10.0
- 1% rule +3.8/10.0
- Livability +3.8/5.0
- Rent growth +3.3/5.0
- Schools +3.1/10.0
- Condition / age +2.5/5.0
- Appreciation +0.0/10.0
$125,000
🖨 Deal sheet (PDF) 📄 Offer letter ✓ Due diligence
Listing remarks
Great Starter Home in a fantastic location! 2 Bedrooms / 1 Bathroom with a spacious living room and spacious kitchen with plenty of counter and cabinet space. The large & flat yard provides plenty of space for kids to play. No carpet, newly painted and newer windows make this home move-in ready. Located close to the All American Freeway and minutes to Ft. Bragg, Cape Fear Valley and all of Fayetteville's restaurants and shopping.
Key facts
- Spacious kitchen
- Large flat yard
- Newer windows
Tags
Neighborhood map
What this means for you Summary
Snapshot
- This is a 2-bed/1.0-bath single-family listed at $125k.
Deal economics
- At list price, monthly cash flow is $29 ($353/yr) — positive.
- The deal already cash-flows at list — no discount required.
- To meet the 1% rule (rent ≥ 1% of price), the offer needs to be $110k (12.3% below list).
- Recommended offer: $110k (12.3% below list) — sets the bar for 1% rule.
- Cap rate 6.6% vs local median 4.8% in Fayetteville — top-decile yield for the area; either an underpriced asset or a hidden risk that comps aren't pricing in. Stress-test before assuming the spread holds.
Location & tenants
- Location reads 75/100 on livability (#45 in NC, #4,031 nationally) — a middle-class / working-renter tenant base. Strengths: commute A+, cost of living A+, housing A+; Watch: crime F, employment D-.
- Cumberland County Schools (urban): math 32% / reading 41% proficiency, ranked #126 of 178 in NC (top 71%) — families likely to look elsewhere, expect single-tenant / working-renter base with shorter leases.
- Zoned schools: Mary Mcarthur Elementary (math 17% / reading 27%, grade F, #1,190 of 1,410 statewide, top 86%, 371 students, 99% FRL); Douglas Byrd Middle (math 13% / reading 30%, grade F, #422 of 475 statewide, top 89%, 935 students, 100% FRL); Douglas Byrd High (math 22% / reading 42%, grade F, #445 of 535 statewide, top 84%, 940 students, 99% FRL) — zoned schools average 99% FRL vs 55% district-wide (45 pts higher); higher-poverty schools than district average — tighter screening recommended.
- Market conditions: Rents rising (+3.2%/yr); 308 active listings in the ZIP; 32 comparable units currently listed for rent nearby; rentals at typical pace (median 25d on market — plan ~3-4 weeks tenant-placement turnaround); 1,125 units permitted in Cumberland County in 2024 (104 in 5+ unit buildings).
Forward outlook
- Local home prices are declining (-3.0%/yr); year-one equity from $864 of loan paydown is wiped out by about $4k of value loss. Plan a longer hold.
Negotiation context
- Only 8 days on market — expect competitive offers; lowballing is unlikely to land.
Risks & watch-outs
- Watch-outs: built in 1946 — expect roof / HVAC / electrical / plumbing capex.
- Climate carrying-cost: major flood risk; major wind risk, 76% chance of damaging wind over 30y; extreme-heat days projected 7→16/yr by 2055 (HVAC capex compounding) — expect insurance premiums to compound above CPI over the hold.
Questions for the listing agent
- Built in 1946 — when were the roof, HVAC, electrical panel, plumbing, and water heater last replaced?
- Is there a deadline driving the sale (1031 exchange, divorce, estate, relocation)? That informs how much negotiation room exists.
- Crime grade is F in this area — have there been break-ins, vandalism, or insurance claims at this property in the last 3 years? What carrier currently insures it and at what premium?
- The area grade is low — what's the realistic commute time and amenity access for the typical tenant pool here? Any planned neighborhood developments (good or bad) we should know about?
- What's the average days-on-market for RENTAL listings here right now (not sales)? A rising rental-DOM trend means longer vacancies and softer asking-rent achievability than the comps imply.
- What's the recent tenant-quality profile in this submarket — average credit score on applications, eviction rate, late-payment / NSF rate, and stable-employment percentage? A property-management company in the area should have these aggregated.
- How much new for-sale + rental construction is in the pipeline within 1–3 miles? Heavy new supply typically softens prices + rents 12–24 months out; constrained supply supports both.
Investment metrics
- 1% rule
- 0.88% ✗
- Cap rate
- 6.57%
- Cash-on-cash
- 1.01%
- DSCR
- 1.04
- GRM
- 9.5
CMA / ARV
- ARV (on-the-fly)
- $122,688
- Comps found
- 7
Show comp detail 7 sales within ~0.75 mi
| Address | Dist | Beds/Ba | Sqft | Sold | Price | $/sf | Match |
|---|---|---|---|---|---|---|---|
| 203 Rodie Ave | 0.00mi | 2/1.0 | 847 (-2%) | 1mo | $120,000 | $142 | 96 |
| 501 Roxie Ave | 0.22mi | 2/1.0 | 859 (-1%) | 6mo | $133,000 | $155 | 84 |
| 309 Faison Ave | 0.14mi | 2/1.0 | 875 (+1%) | 20mo | $60,000 | $69 | 75 |
| 306 Rodie Ave | 0.11mi | 3/1.0 (+1) | 980 (+13%) | 12mo | $176,000 | $180 | 57 |
| 1112 Faison Ave | 0.68mi | 3/1.0 (+1) | 936 (+8%) | 0mo | $170,000 | $182 | 49 |
| 1110 Martindale Dr | 0.68mi | 3/1.0 (+1) | 959 (+11%) | 2mo | $71,500 | $75 | 44 |
| 801 Miller Ave | 0.44mi | 3/1.0 (+1) | 962 (+11%) | 22mo | $130,000 | $135 | 37 |
Match score weights: distance 35% · size 25% · config 20% · recency 20%. Top-matched comps best support the ARV.
Projected returns pro-forma
-3.0% appreciation · 3.17% rent growth · sell at horizon
- IRR
- -14.5%
- Equity multiple
- 0.48×
- Total profit
- $-18,196
- Equity at exit
- $18,638
- IRR
- -5.5%
- Equity multiple
- 0.64×
- Total profit
- $-12,661
- Equity at exit
- $10,808
Cash invested: $35,000 (down + closing). Projections, not guarantees.
Landlord ↔ Tenant lean methodology
- Overall (STATE)
- 85 Strongly Landlord-Friendly
- State North Carolina
- 85 Strongly Landlord-Friendly · R+3
- County
- — inherits STATE
- City
- — inherits STATE
ZIP-level market 28304
- Home prices YoY
- -21.7%
- Rents YoY
- 3.2%
- Active inventory
- 308
- Price-to-rent
- 9.5×
Monthly cashflow live
- Estimated rent
- $1,097 high interval (Pro) →
- Mortgage (P&I)
- −$656
- Tax from tax record
- −$130 /mo · $1,554/yr
- Insurance
- −$52
- HOA
- −$0
- Vacancy / Maint / Mgmt
- −$230
- Net cashflow
- $29
Break-even live
Sensitivity live
| Price | -10% $100 | -5% $65 | +0% $29 | +5% $-6 | +10% $-41 |
|---|---|---|---|---|---|
| Rent | -10% $-57 | -5% $-14 | +0% $29 | +5% $73 | +10% $116 |
| Rate | -1.0pp $92 | -0.5pp $61 | base $29 | +0.5pp $-3 | +1.0pp $-36 |
UW: 25.0% down · 7.5% · 30yr · 1.5% tax · 5.0% vac · 8.0% maint · 8.0% mgmt
Financing live
Cash to close
- Down payment
- $31,250
- Closing costs
- $3,750
- Reserves months
- —
- Total cash needed
- —
Loan-product check · same deal, 3 products live
Conventional
25% down · 7.5% · 30yr
- Down + closing
- —
- Monthly P&I
- —
- Monthly cashflow
- —
- DSCR
- —
- Eligible?
- —
Personal DTI + credit; lowest rate.
DSCR
20% down · 8.5% · 30yr
- Down + closing
- —
- Monthly P&I
- —
- Monthly cashflow
- —
- DSCR
- —
- Eligible?
- —
No personal income docs; deal must DSCR.
Hard money
10% down · 12.0% · 12mo
- Down + closing
- —
- Monthly P&I
- —
- Monthly cashflow
- —
- DSCR
- —
- Eligible?
- —
Short-term bridge; refi at stabilization.
Rent comps 32 comps
| Address | Beds | Baths | Sqft | Rent | $/sqft | DOM | Units | Dist |
|---|---|---|---|---|---|---|---|---|
| 1309 Ireland Dr Fayetteville, NC | 2.0 | 1.5 | 900 | $1,000 | $1.11 | 15d | 1 | 0.33mi |
| 1313 Ireland Dr Unit B Fayetteville, NC | 2.0 | 1.5 | 900 | $1,000 | $1.11 | 25d | 1 | 0.34mi |
| 1409 Ireland Dr Unit D Fayetteville, NC | 1.0 | 1.0 | 950 | $850 | $0.89 | 15d | 1 | 0.37mi |
| 1425 Ireland Dr Unit B Fayetteville, NC | 1.0 | 1.0 | 950 | $875 | $0.92 | 25d | 1 | 0.41mi |
| 1437 Ireland Dr Unit C Fayetteville, NC | 1.0 | 1.0 | 950 | $875 | $0.92 | 25d | 1 | 0.45mi |
| 3212 Tallywood Dr Unit 03 Fayetteville, NC | 2.0 | 1.0 | 900 | $900 | $1.00 | 25d | 1 | 0.52mi |
| 3211 Tallywood Dr Fayetteville, NC | 1.0–3.0 | 1.0–1.5 | 925 | $812 | $0.88 | 25d | 1 | 0.52mi |
| 3209 Tallywood Dr Unit 06 Fayetteville, NC | 2.0 | 1.0 | 800 | $900 | $1.12 | 25d | 1 | 0.54mi |
| 910 Miller Ave Unit 910 Fayetteville, NC | 2.0 | 2.0 | 1000 | $1,250 | $1.25 | 25d | 1 | 0.55mi |
| 3210 Tallywood Dr Unit 09 Fayetteville, NC | 2.0 | 1.0 | 900 | $900 | $1.00 | 23d | 1 | 0.55mi |
| 1005 Ancestry Dr #2 Fayetteville, NC | 2.0 | 2.0 | 950 | $995 | $1.05 | 15d | 1 | 0.55mi |
| 3210 Tallywood Dr #12 Fayetteville, NC | 3.0 | 1.5 | 1000 | $1,000 | $1.00 | 23d | 1 | 0.55mi |
| 3210 Tallywood Dr #04 Fayetteville, NC | 2.0 | 1.0 | 900 | $900 | $1.00 | 25d | 1 | 0.55mi |
| 1031 Ancestry Dr Fayetteville, NC | 2.0 | 2.0 | 950 | $935 | $0.98 | 25d | 1 | 0.58mi |
| 3526 Furman Dr Fayetteville, NC | 3.0 | 1.5 | 1050 | $1,500 | $1.43 | 25d | 1 | 0.72mi |
| 1100 Marlborough Rd Fayetteville, NC | 2.0 | 2.0 | 1025 | $1,198 | $1.17 | 23d | 5 | 0.74mi |
| 1100 Marlborough Rd Fayetteville, NC | 2.0 | 2.0 | 1025 | $1,198 | $1.17 | 15d | 5 | 0.74mi |
| 4810 Alamance Rd Fayetteville, NC | 1.0–2.0 | 1.0–2.0 | 827 | $1,200 | $1.45 | 25d | 1 | 0.83mi |
| 1805 Wayne Ln Fayetteville, NC | 3.0 | 1.0 | 975 | $2,400 | $2.46 | 25d | 1 | 1.07mi |
| 3311 Turtle Point Dr Fayetteville, NC | 1.0 | 1.0 | 792 | $1,312 | $1.66 | 25d | 1 | 1.08mi |
| 4935 Walnut Dr Fayetteville, NC | 3.0 | 1.5 | 1024 | $1,200 | $1.17 | 15d | 1 | 1.09mi |
| 1707 Owen Dr Fayetteville, NC | 1.0 | 1.0 | 615 | $1,150 | $1.87 | 15d | 15 | 1.18mi |
| 2696 Brigadoon Ln Unit C Fayetteville, NC | 1.0 | 1.0 | 800 | $995 | $1.24 | 15d | 1 | 1.34mi |
| 2696 Brigadoon Ln Unit C Fayetteville, NC | 1.0 | 1.0 | 800 | $1,000 | $1.25 | 25d | 1 | 1.34mi |
| 409 Tradewinds Dr Fayetteville, NC | 1.0–2.0 | 1.0–2.0 | 867 | $1,195 | $1.38 | 15d | 16 | 1.37mi |
| 479 McBain Dr Fayetteville, NC | 2.0 | 1.0 | 858 | $1,200 | $1.40 | 25d | 1 | 1.42mi |
| 609 Ashbrook Ct Fayetteville, NC | 2.0 | 1.5 | 997 | $1,049 | $1.05 | 25d | 1 | 1.44mi |
| 469 McBain Dr Fayetteville, NC | 2.0 | 1.0 | 858 | $1,000 | $1.17 | 25d | 1 | 1.44mi |
| 613 Ashbrook Ct Fayetteville, NC | 3.0 | 1.5 | 1103 | $1,299 | $1.18 | 25d | 1 | 1.44mi |
| 29 Briar Cir Fayetteville, NC | 1.0–2.0 | 1.0–1.5 | 765 | $1,283 | $1.68 | 15d | 36 | 1.45mi |
| 600 Ashbrook Ct Fayetteville, NC | 2.0–3.0 | 1.5 | 1050 | $1,049 | $1.00 | 23d | 6 | 1.46mi |
| 855 King Arthur Dr Fayetteville, NC | 1.0–2.0 | 1.0–2.0 | 810 | $1,182 | $1.46 | 15d | 9 | 1.50mi |
Listing history 3 events
-
2026-04-08status Pending
-
2026-03-31$125,000 Active
-
2016-11-03soldstatus $130,000
ⓘ Source: listings_history table (triggers on properties + properties_extension) + one-shot
backfill from property_details.listing_events for pre-trigger history.
Tax reassessment forecast NC · Resets to sale price
- Current annual tax
- $1,554 · $130/mo
- Projected year-2 tax
- $1,554 · $130/mo
- Expected delta
- $0/yr ($0/mo · 0.0%)
ⓘ Screening estimate from a state-policy table — verify with the county assessor before closing.
Climate risk First Street
- Flood 6/10 Major FEMA zone X (unshaded) · 73% chance over 30 yrs
- Wildfire 1/10 Low
- Heat 7/10 Severe 7 d/yr ≥106°F today · 16 d/yr by 30 yrs out
- Wind 7/10 Severe 76% chance of damaging wind over 30 yrs
- Air quality 1/10 Low 0 unhealthy d/yr today · 0 by 30 yrs out
Nearby sold comps map
Loading sold comps map…
Walkable amenities ~0.75 mi
Loading nearby amenities…
Taxation est. · year 1
- Rental income
- $13,162
- − Mortgage interest
- −$7,002
- − Property taxes
- −$1,554
- − Insurance
- −$625
- − Repairs & maintenance
- −$1,053
- − Management
- −$1,053
- − Depreciation
- −$3,636
- Taxable loss
- −$1,762
- Est. tax savings @ 24.0%
- +$423
- After-tax cash flow
- $775/yr
For passive investors: Depreciation is non-cash, so a rental often shows a tax loss while cash-flowing — sheltering income. Rental losses are passive: they offset passive income freely, and up to $25,000/yr can offset ordinary (W-2) income if you actively participate and your MAGI is under $100k (phasing out to $0 by $150k); unused losses carry forward. On sale, claimed depreciation is recaptured at up to 25%, and gains may owe capital-gains tax (a 1031 exchange can defer both). Figures are a year-1 estimate at your 24.0% rate — not tax advice; consult a CPA.
Schools (NCES district)
- District
- Cumberland County Schools
- NCES district ID
- 3700011
- Math proficiency
- 32% ▼ -2.00%
- Reading proficiency
- 41% ▼ -1.00%
- Median HH income
- $44,168
- Composite
- 31.0/100
- National rank
- #6096
- State rank
- #126 of 178 in NC
Livability — Fayetteville
- Score
- 75/100
- State rank
- #45
- US rank
- #4031
Category grades
Schools grade is shown separately in the Schools card above.
Census & demographics
- Census place
- Fayetteville, NC
- County
- Cumberland County · 265,314 people
- City population
- 226,118
- Metro
- Fayetteville, NC
- Population (ZIP)
- 37,140
- Household income
- $58,563
- Rent vs Own
- Severe rent burden
- 1667.0
Population outlook (Cumberland County) Hauer SSP2
- Today (2025)
- 330,855 people
- By 2030
- 333,523 · +0.8%
- By 2040
- 335,583 · +1.4%
- By 2050
- 335,325 · +1.4%
- By 2075
- 342,853 · +3.6%
- By 2100
- 340,698 · +3.0%
Race, ethnicity, and origin ACS 2023
- Neighborhood character
- Highly diverse neighborhood (Simpson 0.70)
- Race & ethnicity
- Black 39% White 36% Hispanic / Latino 14% Two or more races 12% Asian 3% Native American 1%
- Hispanic origin (detail)
- Mexican 5% Puerto Rican 5%
- Common ancestry
- Slovak 2% Italian 1% Serbian 1%
- Foreign-born
- 8% · Canada, South Korea, Vietnam
- Languages at home
- 87% English-only · Spanish 9% Tagalog/Filipino 1% French/Haitian/Cajun 1%
Political lean MEDSL · Cumberland
- 2024 margin
- D (+13.4) · D 56.1% · R 42.7% · Other 1.2%
- 2008→2024 swing
- -4.3pp toward R · 2008: 17.7pp · 2024: 13.4pp
- All cycles
- 2024: D+13.4 2020: D+16.6 2016: D+16.0 2012: D+19.7 2008: D+17.7
Not yet ingested
- Civics
- —
Market trends
- HPI YoY
- ▼ -59.90%
- Current HPI
- 215.927
- Rent YoY
- ▲ 3.17%
- Metro
- Fayetteville, NC
- State GDP YoY
- ▲ 3.28%
- F500 in state
- 26
Industry mix (Fortune 500 HQ in NC)
| Industry | F500 HQs | Revenue |
|---|---|---|
| Financial Services | 2 | $213B |
|
||
| Retail | 2 | $95B |
|
||
| Industrial Conglomerate | 1 | $38B |
|
||
| Metals / Steel | 1 | $35B |
|
||
| Utilities | 1 | $30B |
|
||
| Industrial Machinery | 1 | $19B |
|
||
Price history
-3.8% since first listed3 events — show timeline
- 2026-04-08 Pending — LPRMLS
- 2026-03-31 Listed $125,000 LPRMLS
- 2016-11-03 Sold (Public Records) $130,000 Public Records
Property tax history
+6.8%/yrLatest (2025): $1,554 · +42.6% YoY. Source: county tax records.
Cash-flow waterfall
monthlySold comps — $/sqft
last 12 mo · ≤1 miLoading sold comps…