6444 Colorado Rd Unit 4 · Smyer, TX
Flood risk 1/10 · Minimal
- FEMA flood zone
- X
- Chance of flooding over 30 yrs
- 0.0%
- Est. flood insurance / yr
- $507 – $1,088
Fire risk 6/10 · Moderate
- Est. fire insurance / yr
- $1,222 – $2,270
Heat risk 5/10 · Moderate
- Hot days now (above 99°F)
- 7 days/yr
- Hot days in 30 yrs
- 20 days/yr
Wind risk 2/10 · Minimal
- Chance of severe wind over 30 yrs
- 2.0%
Air-quality risk 2/10 · Minimal
- Unhealthy air days now
- 0 days/yr
- Unhealthy air days in 30 yrs
- 1 days/yr
Risk factors via First Street. Map © Google.
Why this score? — see what drove the B- grade
The composite is a weighted blend of 9 inputs, each scored 0–100. Each bar is that input's sub-score; the figure is the points it added to the 100-point composite (weight × sub-score).
- Cash flow +30.0/30.0
- 1% rule +10.0/10.0
- DSCR +10.0/10.0
- ARV discount +7.5/15.0
- Schools +4.1/10.0
- Livability +3.4/5.0
- Rent growth +2.5/5.0
- Condition / age +2.5/5.0
- Appreciation +0.0/10.0
$84,900
🖨 Deal sheet (PDF) 📄 Offer letter ✓ Due diligence
Listing remarks
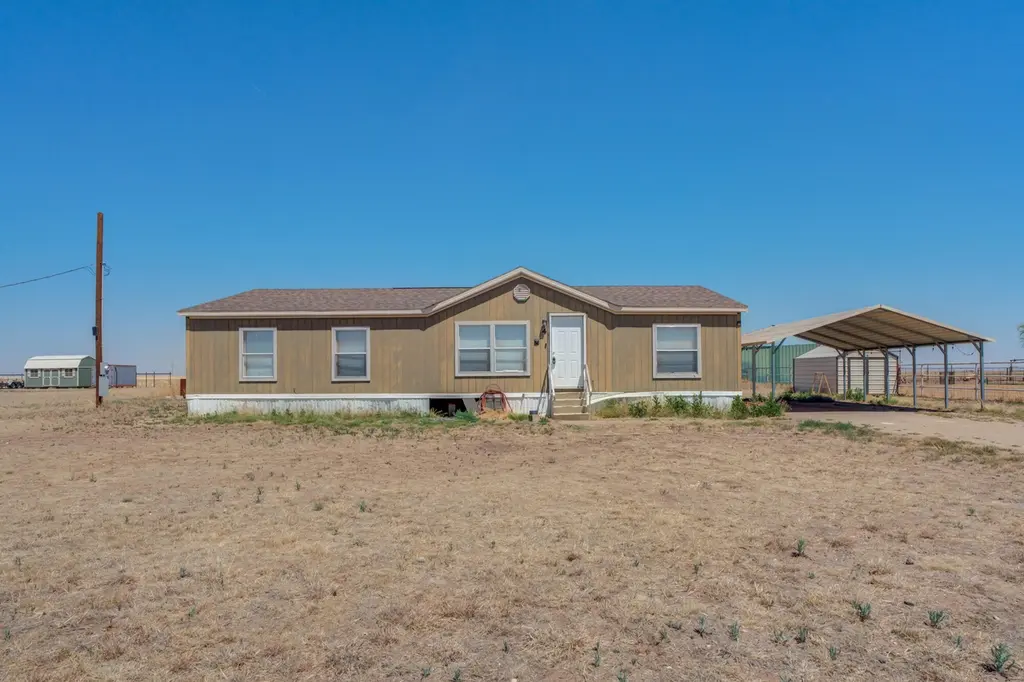
Tucked away in the charming community of Smyer and just minutes from Lubbock, this property offers the perfect blend of small-town living and peaceful country views. Situated on a spacious acre, there's room to spread out, slow down, and truly enjoy the feeling of home. Inside, you'll love the excellent layout with oversized living spaces designed for comfort and everyday living. The kitchen is the heart of the home, featuring abundant storage, a large center island with bar seating, and a separate dining area perfect for gathering with family and friends. The isolated primary suite offers a private retreat with a spacious bathroom complete with a walk-in shower and an oversized closet. Whe
Key facts
- Large center island
- Abundant storage
- Spacious acre
Tags
Property features AI
Exterior
- Parking: 2-space carport
- Utilities: Shared well water; Electricity connected; Sewer connected; Water connected
- Home design: Single-family residence; Residential property
- Construction: Board & batten siding; Permanent foundation; Other roof material; Built as a single-story (above grade area: 1,664)
- Exterior features: No additional exterior features listed; No fencing
Interior
- Kitchen: Dishwasher; Refrigerator
- Bedrooms: Total rooms: 8
- Flooring: Laminate
- Bathrooms: 2 full bathrooms
- Heating & cooling: Electric heating; Ceiling fan and electric cooling
- Interior features: Ceiling fans; Walk-in closets
- Laundry & utility: Washer; Dryer
Neighborhood map
What this means for you Summary
Snapshot
- This is a 4-bed/2.0-bath manufactured listed at $85k.
Deal economics
- At list price, monthly cash flow is $830 ($10k/yr) — positive.
- The deal already cash-flows at list — no discount required.
- Meets the 1% rule at list price ($2k rent vs $85k).
Location & tenants
- Location reads 67/100 on livability (#581 in TX) — a middle-class / working-renter tenant base. Strengths: cost of living A+, housing A+; Watch: health & safety C-, schools D+, crime F.
- Smyer ISD (rural): math 49% / reading 47% proficiency, ranked #206 of 826 in TX (top 25%) — families likely to look elsewhere, expect single-tenant / working-renter base with shorter leases.
- Market conditions: Rents soft (-0.1%/yr); 610 active listings in the ZIP; 7 units permitted in Hockley County in 2024 (0 in 5+ unit buildings).
- This rent runs 36% of the median local income ($62k/yr) — at the standard rent-burdened threshold; future hikes will face affordability resistance.
Forward outlook
- Local home prices are declining (-3.0%/yr); year-one equity from $587 of loan paydown is wiped out by about $3k of value loss. Plan a longer hold.
- Hockley County population projected at +21% by 2050 — long-run rental-demand tailwind backs the buy-and-hold thesis.
- At projected returns (-3.0% appreciation + 0.0% rent growth), your $24k cash investment doubles in ~3 years — after that, you're playing with house money.
Negotiation context
- Only 1 days on market — expect competitive offers; lowballing is unlikely to land.
Risks & watch-outs
- Climate carrying-cost: major wildfire risk; extreme-heat days projected 7→20/yr by 2055 (HVAC capex compounding) — expect insurance premiums to compound above CPI over the hold.
Questions for the listing agent
- Is there a deadline driving the sale (1031 exchange, divorce, estate, relocation)? That informs how much negotiation room exists.
- Schools are D-rated, which usually means shorter tenancies and higher turnover. Who's the typical renter profile here, and what's been the actual vacancy rate?
- Crime grade is F in this area — have there been break-ins, vandalism, or insurance claims at this property in the last 3 years? What carrier currently insures it and at what premium?
- What's the average days-on-market for RENTAL listings here right now (not sales)? A rising rental-DOM trend means longer vacancies and softer asking-rent achievability than the comps imply.
- What's the recent tenant-quality profile in this submarket — average credit score on applications, eviction rate, late-payment / NSF rate, and stable-employment percentage? A property-management company in the area should have these aggregated.
- How much new for-sale + rental construction is in the pipeline within 1–3 miles? Heavy new supply typically softens prices + rents 12–24 months out; constrained supply supports both.
Investment metrics
- 1% rule
- 2.15% ✓
- Cap rate
- 18.02%
- Cash-on-cash
- 41.89%
- DSCR
- 2.86
- GRM
- 3.9
CMA / ARV
No comps found within radius.
Projected returns pro-forma
-3.0% appreciation · 0.0% rent growth · sell at horizon
- IRR
- 35.0%
- Equity multiple
- 2.42×
- Total profit
- $33,785
- Equity at exit
- $12,659
- IRR
- 40.2%
- Equity multiple
- 4.24×
- Total profit
- $76,976
- Equity at exit
- $7,341
Cash invested: $23,772 (down + closing). Projections, not guarantees.
Landlord ↔ Tenant lean methodology
- Overall (STATE)
- 87 Strongly Landlord-Friendly
- State Texas
- 87 Strongly Landlord-Friendly · R+5
- County
- — inherits STATE
- City
- — inherits STATE
ZIP-level market 79407
- Home prices YoY
- -16.3%
- Rents YoY
- -0.1%
- Active inventory
- 610
- Price-to-rent
- 3.9×
Monthly cashflow live
- Estimated rent
- $1,825 medium interval (Pro) →
- Mortgage (P&I)
- −$445
- Tax from tax record
- −$131 /mo · $1,576/yr
- Insurance
- −$35
- HOA
- −$0
- Vacancy / Maint / Mgmt
- −$383
- Net cashflow
- $830
Break-even live
Sensitivity live
| Price | -10% $878 | -5% $854 | +0% $830 | +5% $806 | +10% $782 |
|---|---|---|---|---|---|
| Rent | -10% $686 | -5% $758 | +0% $830 | +5% $902 | +10% $974 |
| Rate | -1.0pp $873 | -0.5pp $851 | base $830 | +0.5pp $808 | +1.0pp $785 |
UW: 25.0% down · 7.5% · 30yr · 1.5% tax · 5.0% vac · 8.0% maint · 8.0% mgmt
Financing live
Cash to close
- Down payment
- $21,225
- Closing costs
- $2,547
- Reserves months
- —
- Total cash needed
- —
Loan-product check · same deal, 3 products live
Conventional
25% down · 7.5% · 30yr
- Down + closing
- —
- Monthly P&I
- —
- Monthly cashflow
- —
- DSCR
- —
- Eligible?
- —
Personal DTI + credit; lowest rate.
DSCR
20% down · 8.5% · 30yr
- Down + closing
- —
- Monthly P&I
- —
- Monthly cashflow
- —
- DSCR
- —
- Eligible?
- —
No personal income docs; deal must DSCR.
Hard money
10% down · 12.0% · 12mo
- Down + closing
- —
- Monthly P&I
- —
- Monthly cashflow
- —
- DSCR
- —
- Eligible?
- —
Short-term bridge; refi at stabilization.
Listing history 18 events
-
2026-06-17days on market $84,900 Active 1 DOM
-
2026-06-17days on market $84,900 Active 13 DOM
-
2026-06-16days on market $84,900 Active 12 DOM
-
2026-06-15price $84,900 Active 11 DOM
-
2026-06-15days on market $89,900 Active 11 DOM
-
2026-06-14days on market $89,900 Active 9 DOM
-
2026-06-10days on market $89,900 Active 6 DOM
-
2026-06-09days on market $89,900 Active 5 DOM
-
2026-06-08days on market $89,900 Active 4 DOM
-
2026-06-07days on market $89,900 Active 3 DOM
-
2026-06-03pricedays on market $89,900 Active 20 DOM
-
2026-06-02days on market $99,900 Active 19 DOM
-
2026-06-01days on market $99,900 Active 18 DOM
-
2026-05-31days on market $99,900 Active 17 DOM
-
2026-05-30days on market $99,900 Active 16 DOM
-
2026-05-14$99,900 Active 860-char remark
-
2018-07-17soldstatus
-
2016-03-03soldstatus
ⓘ Source: listings_history table (triggers on properties + properties_extension) + one-shot
backfill from property_details.listing_events for pre-trigger history.
Tax reassessment forecast TX · Resets to sale price
- Current annual tax
- $1,576 · $131/mo
- Projected year-2 tax
- $1,576 · $131/mo
- Expected delta
- $0/yr ($0/mo · 0.0%)
ⓘ Screening estimate from a state-policy table — verify with the county assessor before closing.
Climate risk First Street
- Flood 1/10 Low FEMA zone X · 0% chance over 30 yrs
- Wildfire 6/10 Major
- Heat 5/10 Major 7 d/yr ≥99°F today · 20 d/yr by 30 yrs out
- Wind 2/10 Low 2% chance of damaging wind over 30 yrs
- Air quality 2/10 Low 0 unhealthy d/yr today · 1 by 30 yrs out
Nearby sold comps map
Loading sold comps map…
Walkable amenities ~0.75 mi
Loading nearby amenities…
Taxation est. · year 1
- Rental income
- $21,899
- − Mortgage interest
- −$4,756
- − Property taxes
- −$1,576
- − Insurance
- −$424
- − Repairs & maintenance
- −$1,752
- − Management
- −$1,752
- − Depreciation
- −$2,470
- Taxable income
- $9,169
- Est. tax owed @ 24.0%
- −$2,201
- After-tax cash flow
- $7,756/yr
For passive investors: Depreciation is non-cash, so a rental often shows a tax loss while cash-flowing — sheltering income. Rental losses are passive: they offset passive income freely, and up to $25,000/yr can offset ordinary (W-2) income if you actively participate and your MAGI is under $100k (phasing out to $0 by $150k); unused losses carry forward. On sale, claimed depreciation is recaptured at up to 25%, and gains may owe capital-gains tax (a 1031 exchange can defer both). Figures are a year-1 estimate at your 24.0% rate — not tax advice; consult a CPA.
Schools (NCES district)
- District
- Smyer ISD
- NCES district ID
- 4840590
- Math proficiency
- 49% ▲ 15.00%
- Reading proficiency
- 47% ▲ 9.00%
- Median HH income
- $49,331
- Composite
- 41.08/100
- National rank
- #3574
- State rank
- #206 of 826 in TX
Livability — Smyer
- Score
- 67/100
- State rank
- #581
- US rank
- #11104
Category grades
Schools grade is shown separately in the Schools card above.
Census & demographics
- County
- Lubbock County · 293,542 people
- City population
- 602
- Metro
- Lubbock, TX
- Population (ZIP)
- 24,000
- Household income
- $61,509
- Rent vs Own
- Severe rent burden
- 1914.0
Population outlook (Hockley County) Hauer SSP2
- Today (2025)
- 25,295 people
- By 2030
- 26,230 · +3.7%
- By 2040
- 28,268 · +11.8%
- By 2050
- 30,536 · +20.7%
- By 2075
- 36,867 · +45.7%
- By 2100
- 40,662 · +60.8%
Race, ethnicity, and origin ACS 2023
- Neighborhood character
- Diverse neighborhood (Simpson 0.56)
- Race & ethnicity
- White 58% Hispanic / Latino 31% Two or more races 17% Black 4% Asian 3%
- Hispanic origin (detail)
- Mexican 27%
- Common ancestry
- Italian 2% Lithuanian 1% Slovak 1%
- Foreign-born
- 5% · Canada, South Korea, China
- Languages at home
- 83% English-only · Spanish 13% Other Asian/Pacific 1% Chinese 1%
Political lean MEDSL · Hockley
- 2024 margin
- Solid R (+66.3) · D 16.6% · R 82.8%
- 2008→2024 swing
- -14.0pp toward R · 2008: -52.3pp · 2024: -66.3pp
- All cycles
- 2024: R+66.3 2020: R+62.4 2016: R+62.3 2012: R+57.0 2008: R+52.3
Not yet ingested
- Civics
- —
Market trends
- HPI YoY
- ▼ -44.87%
- Current HPI
- 229.9895
- Rent YoY
- ▼ -0.07%
- Metro
- Lubbock, TX
- State GDP YoY
- ▲ 3.95%
- F500 in state
- 110
Industry mix (Fortune 500 HQ in TX)
| Industry | F500 HQs | Revenue |
|---|---|---|
| Energy | 16 | $1,198B |
|
||
| Technology | 5 | $198B |
|
||
| Engineering / Construction | 4 | $72B |
|
||
| Energy Services | 3 | $60B |
|
||
| Utilities | 3 | $41B |
|
||
| Healthcare | 2 | $330B |
|
||
Price history
-5.6% since first listed5 events — show timeline
- 2026-06-17 Listed $84,900 LARMLS
- 2026-06-15 Price Changed $84,900 LARMLS
- 2026-06-03 Price Changed $89,900 LARMLS
- 2018-07-17 Sold (Public Records) — Public Records
- 2016-03-03 Sold (Public Records) — Public Records
Property tax history
+70.4%/yrLatest (2025): $1,576 · +22.7% YoY. Source: county tax records.
Cash-flow waterfall
monthlySold comps — $/sqft
last 12 mo · ≤1 miLoading sold comps…