 🏗️ New Construction
Farm 3 Flex Plan · Cimarron Hills, CO
Flood risk 7/10 · Major
- FEMA flood zone
- X (unshaded)
- Chance of flooding over 30 yrs
- 0.96%
- Est. flood insurance / yr
- $507 – $1,088
Fire risk 6/10 · Moderate
- Est. fire insurance / yr
- $939 – $1,743
Heat risk 2/10 · Minimal
- Hot days now (above 89°F)
- 6 days/yr
- Hot days in 30 yrs
- 16 days/yr
Wind risk 2/10 · Minimal
- Chance of severe wind over 30 yrs
- —
Air-quality risk 1/10 · Minimal
- Unhealthy air days now
- 0 days/yr
- Unhealthy air days in 30 yrs
- 0 days/yr
Risk factors via First Street. Map © Google.
Why this score? — see what drove the B- grade
The composite is a weighted blend of 9 inputs, each scored 0–100. Each bar is that input's sub-score; the figure is the points it added to the 100-point composite (weight × sub-score).
- Cash flow +29.9/30.0
- DSCR +10.0/10.0
- 1% rule +8.4/10.0
- ARV discount +7.5/15.0
- Condition / age +4.0/5.0
- Livability +3.4/5.0
- Rent growth +2.9/5.0
- Schools +2.5/10.0
- Appreciation +0.0/10.0
$172,000
🖨 Deal sheet (PDF) 📄 Offer letter ✓ Due diligence
Listing remarks
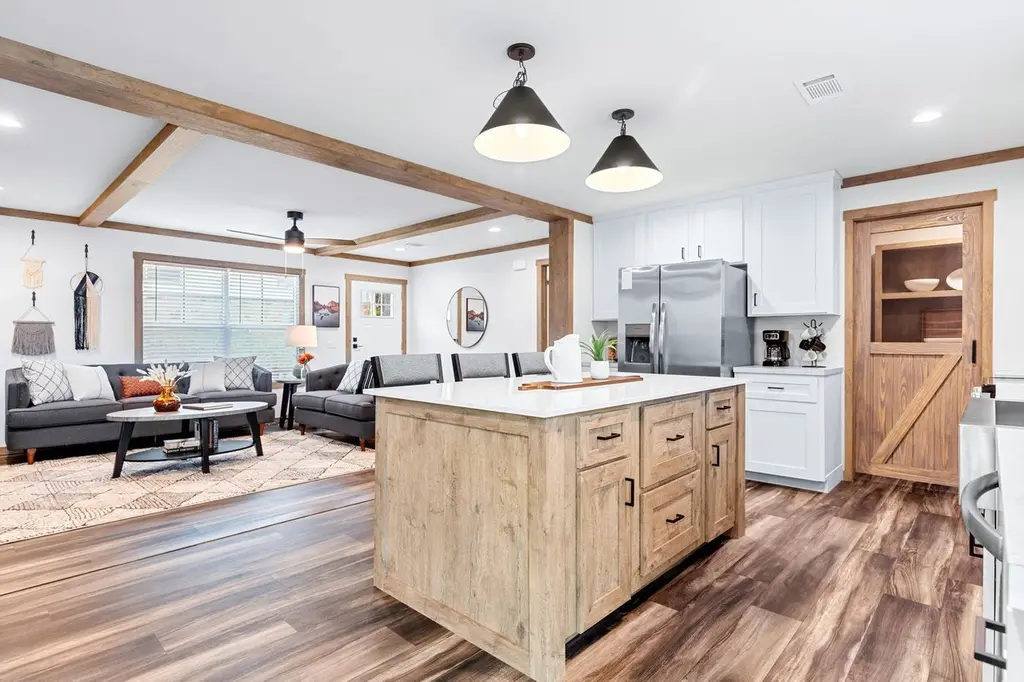
Discover the perfect home for your modern lifestyle with the Farm 3 Flex. This adaptable 3-bedroom, 2-bathroom home features a flexible space that can be transformed into a home office, playroom, or extra bedroom to suit your family's needs. Our popular split floor plan offers privacy and functionality, while the eye-catching curb appeal makes a lasting impression. Inside, enjoy the comfort and style of tape and textured walls, creating a finished look. Built with Clayton's eco-friendly eBuilt system, the Farm 3 Flex incorporates over 25 sustainable features without compromising on quality or comfort.
Key facts
- Listed 74 days
Property features AI
Finance
- Other: Address marketed as Farm 3 Flex Plan, Colorado Springs, CO 80915; Listing status: Active
- Financial info: List price $172,000
Exterior
- Home design: Plan name: Farm 3 Flex; New construction plan
- Construction: Constructed as part of 2026 plan
- Exterior features: Living area approximately 1,580 (plan)
Interior
- Bedrooms: 3 bedrooms
- Bathrooms: 2 full bathrooms
- Interior features: Open living area (plan); Plan released in 2026
Neighborhood map
What this means for you Summary
Snapshot
- This is a 3-bed/2.0-bath manufactured listed at $172k. Condition is rated good.
Deal economics
- At list price, monthly cash flow is $571 ($7k/yr) — positive.
- The deal already cash-flows at list — no discount required.
- Meets the 1% rule at list price ($2k rent vs $172k).
- Recommended offer: $162k (6.0% below list) — sets the bar for market timing.
- Cap rate 10.7% vs local median 3.9% in Cimarron Hills — top-decile yield for the area; either an underpriced asset or a hidden risk that comps aren't pricing in. Stress-test before assuming the spread holds.
Location & tenants
- Location reads 68/100 on livability (#111 in CO) — a middle-class / working-renter tenant base. Strengths: housing A+, health & safety A, employment A-; Watch: crime F, amenities F, commute F.
- Colorado Springs School District No. 11 In The County Of E (urban): math 20% / reading 37% proficiency, ranked #56 of 86 in CO (top 65%) — low school quality limits family demand, transient renter base, plan for 1-2y turnover.
- Zoned schools: Henry Elementary School (math 15% / reading 27%, grade F, #673 of 966 statewide, top 71%, 358 students, 66% FRL); Jack Swigert Aerospace Academy (math 5% / reading 17%, grade F, #242 of 270 statewide, top 90%, 479 students, 80% FRL); Mitchell High School (math 2% / reading 22%, grade F, #352 of 381 statewide, top 94%, 886 students, 72% FRL) — zoned schools average 72% FRL vs 49% district-wide (24 pts higher); higher-poverty schools than district average — tighter screening recommended.
- Zoned-school proficiency averages 15% at this address vs 28% district-wide (-14 pts) — the specific schools serving this property underperform the Colorado Springs School District No. 11 In The County Of E average; the district grade overstates school quality for this exact location.
- Market conditions: Rents rising (+1.6%/yr); 150 active listings in the ZIP; 17 comparable units currently listed for rent nearby; rentals leasing fast (median 4d on market — plan ~1-2 weeks tenant-placement turnaround); 3,906 units permitted in El Paso County in 2024 (872 in 5+ unit buildings).
- This rent runs 38% of the median local income ($72k/yr) — at the standard rent-burdened threshold; future hikes will face affordability resistance.
Forward outlook
- Local home prices are declining (-3.0%/yr); year-one equity from $1k of loan paydown is wiped out by about $5k of value loss. Plan a longer hold.
- El Paso County population projected at +28% by 2050 — long-run rental-demand tailwind backs the buy-and-hold thesis.
- At projected returns (-3.0% appreciation + 1.6% rent growth), your $48k cash investment doubles in ~10 years — after that, you're playing with house money.
Negotiation context
- It's been on market 74 days — a 6% lower offer ($162k) is reasonable based on typical stale-listing flexibility.
Risks & watch-outs
- Watch-outs: flood insurance adds $66/mo.
- Climate carrying-cost: major flood risk; major wildfire risk — expect insurance premiums to compound above CPI over the hold.
Questions for the listing agent
- It's been on market 74 days. Have you received any prior offers? Is the seller open to a 6% concession, seller financing, or rate buy-down credit?
- What's the actual annual flood-insurance premium (NFIP or private), and is the property in a SFHA with mandatory coverage?
- Why hasn't it sold? Are there any deal-killer items the seller is aware of (foundation, flood, title, zoning, code violations)?
- Is there a deadline driving the sale (1031 exchange, divorce, estate, relocation)? That informs how much negotiation room exists.
- Schools are B-rated — typically a magnet for longer-tenancy family renters. What's the average tenant stay here, and is there a school-zone premium baked into asking?
- Crime grade is F in this area — have there been break-ins, vandalism, or insurance claims at this property in the last 3 years? What carrier currently insures it and at what premium?
- What's the average days-on-market for RENTAL listings here right now (not sales)? A rising rental-DOM trend means longer vacancies and softer asking-rent achievability than the comps imply.
- What's the recent tenant-quality profile in this submarket — average credit score on applications, eviction rate, late-payment / NSF rate, and stable-employment percentage? A property-management company in the area should have these aggregated.
- How much new for-sale + rental construction is in the pipeline within 1–3 miles? Heavy new supply typically softens prices + rents 12–24 months out; constrained supply supports both.
Investment metrics
- 1% rule
- 1.34% ✓
- Cap rate
- 10.74%
- Cash-on-cash
- 15.89%
- DSCR
- 1.71
- GRM
- 6.2
CMA / ARV
No comps found within radius.
Projected returns pro-forma
-3.0% appreciation · 1.59% rent growth · sell at horizon
- IRR
- 2.9%
- Equity multiple
- 1.11×
- Total profit
- $5,359
- Equity at exit
- $25,646
- IRR
- 11.1%
- Equity multiple
- 1.81×
- Total profit
- $38,930
- Equity at exit
- $14,871
Cash invested: $48,160 (down + closing). Projections, not guarantees.
Landlord ↔ Tenant lean methodology
- Overall (STATE)
- 38 Tenant-Leaning
- State Colorado
- 38 Tenant-Leaning · D+4
- County
- — inherits STATE
- City
- — inherits STATE
ZIP-level market 80915
- Home prices YoY
- -30.2%
- Rents YoY
- 1.6%
- Active inventory
- 150
- Price-to-rent
- 6.2×
Monthly cashflow live
- Estimated rent
- $2,312 high interval (Pro) →
- Mortgage (P&I)
- −$902
- Tax est. 1.5%
- −$215 /mo · $2,580/yr
- Insurance
- −$72
- Flood insurance flood zone
- −$66 /mo · $798/yr
- HOA
- −$0
- Vacancy / Maint / Mgmt
- −$486
- Net cashflow
- $571
Break-even live
Sensitivity live
| Price | -10% $690 | -5% $631 | +0% $571 | +5% $512 | +10% $452 |
|---|---|---|---|---|---|
| Rent | -10% $389 | -5% $480 | +0% $571 | +5% $663 | +10% $754 |
| Rate | -1.0pp $658 | -0.5pp $615 | base $571 | +0.5pp $527 | +1.0pp $481 |
UW: 25.0% down · 7.5% · 30yr · 1.5% tax · 5.0% vac · 8.0% maint · 8.0% mgmt
Financing live
Cash to close
- Down payment
- $43,000
- Closing costs
- $5,160
- Reserves months
- —
- Total cash needed
- —
Loan-product check · same deal, 3 products live
Conventional
25% down · 7.5% · 30yr
- Down + closing
- —
- Monthly P&I
- —
- Monthly cashflow
- —
- DSCR
- —
- Eligible?
- —
Personal DTI + credit; lowest rate.
DSCR
20% down · 8.5% · 30yr
- Down + closing
- —
- Monthly P&I
- —
- Monthly cashflow
- —
- DSCR
- —
- Eligible?
- —
No personal income docs; deal must DSCR.
Hard money
10% down · 12.0% · 12mo
- Down + closing
- —
- Monthly P&I
- —
- Monthly cashflow
- —
- DSCR
- —
- Eligible?
- —
Short-term bridge; refi at stabilization.
Rent comps 17 comps
| Address | Beds | Baths | Sqft | Rent | $/sqft | DOM | Units | Dist |
|---|---|---|---|---|---|---|---|---|
| 7010 Crossbuck Pt Colorado Springs, CO | 1.0–3.0 | 1.0–2.0 | 981 | $2,631 | $2.68 | 4d | 17 | 0.50mi |
| 6944 Palmer Park Blvd Colorado Springs, CO | 3.0 | 2.5 | 1280 | $1,950 | $1.52 | 4d | 1 | 0.65mi |
| 1885 Sandtoft Hts Colorado Springs, CO | 3.0 | 2.5 | 2080 | $2,200 | $1.06 | 23d | 1 | 0.82mi |
| 2284 Reed Grass Way Colorado Springs, CO | 3.0 | 2.5 | 1853 | $2,500 | $1.35 | 5d | 1 | 0.92mi |
| 8120 Postrock Dr Colorado Springs, CO | 3.0 | 2.0 | 1215 | $2,200 | $1.81 | 4d | 1 | 1.12mi |
| 2434 Vanhoutte Vw Colorado Springs, CO | 3.0 | 2.5 | 1438 | $2,800 | $1.95 | 4d | 1 | 1.18mi |
| 7230 Constitution Square Hts Colorado Springs, CO | 1.0–3.0 | 1.0–2.0 | 992 | $1,700 | $1.71 | 4d | 12 | 1.22mi |
| 1020 Solace Pond Vw Colorado Springs, CO | 1.0–3.0 | 1.0–2.0 | 1158 | $2,632 | $2.27 | 4d | 12 | 1.23mi |
| 1888 Reilly Grv Colorado Springs, CO | 2.0 | 2.5 | 1396 | $2,150 | $1.54 | 12d | 1 | 1.24mi |
| 7640 Norice GRV Colorado Springs, CO | 1.0–3.0 | 1.0–2.0 | 1051 | $2,395 | $2.28 | 4d | 11 | 1.29mi |
| 7333 Rosa Belle Hts Colorado Springs, CO | 2.0 | 2.0 | 1302 | $2,100 | $1.61 | 23d | 1 | 1.30mi |
| 7263 Hunter Jumper Dr Colorado Springs, CO | 3.0 | 3.5 | 2116 | $3,500 | $1.65 | 12d | 1 | 1.32mi |
| 7359 Hunter Jumper Dr Colorado Springs, CO | 3.0 | 3.5 | 2116 | $2,600 | $1.23 | 4d | 1 | 1.33mi |
| 6639 Rio Bravo Grv Colorado Springs, CO | 2.0 | 2.5 | 1764 | $2,043 | $1.16 | 4d | 1 | 1.37mi |
| 2645 Akers Dr Colorado Springs, CO | 1.0–3.0 | 1.0–2.0 | 1035 | $2,349 | $2.27 | 4d | 14 | 1.43mi |
| 6364 Zermatt Dr Colorado Springs, CO | 3.0 | 2.0 | 1529 | $1,980 | $1.29 | 4d | 1 | 1.46mi |
| 2052 Springside Dr Colorado Springs, CO | 4.0 | 2.5 | 1464 | $2,349 | $1.60 | 23d | 1 | 1.48mi |
Listing history 15 events
-
2026-06-22days on market $172,000 Active 74 DOM
-
2026-06-18days on market $172,000 Active 71 DOM
-
2026-06-17days on market $172,000 Active 70 DOM
-
2026-06-16days on market $172,000 Active 69 DOM
-
2026-06-15days on market $172,000 Active 68 DOM
-
2026-06-14days on market $172,000 Active 66 DOM
-
2026-06-10days on market $172,000 Active 63 DOM
-
2026-06-09days on market $172,000 Active 62 DOM
-
2026-06-08days on market $172,000 Active 61 DOM
-
2026-06-07days on market $172,000 Active 60 DOM
-
2026-06-05days on market $172,000 Active 57 DOM
-
2026-06-03days on market $172,000 Active 56 DOM
-
2026-06-03days on market $172,000 Active 55 DOM
-
2026-06-01days on market $172,000 Active 54 DOM
-
2026-05-31days on market $172,000 Active 53 DOM
ⓘ Source: listings_history table (triggers on properties + properties_extension) + one-shot
backfill from property_details.listing_events for pre-trigger history.
Climate risk First Street
- Flood 7/10 Severe FEMA zone X (unshaded) · 96% chance over 30 yrs
- Wildfire 6/10 Major
- Heat 2/10 Low 6 d/yr ≥89°F today · 16 d/yr by 30 yrs out
- Wind 2/10 Low
- Air quality 1/10 Low 0 unhealthy d/yr today · 0 by 30 yrs out
Nearby sold comps map
Loading sold comps map…
Walkable amenities ~0.75 mi
Loading nearby amenities…
Taxation est. · year 1
- Rental income
- $27,744
- − Mortgage interest
- −$9,635
- − Property taxes
- −$2,580
- − Insurance
- −$1,658
- − Repairs & maintenance
- −$2,220
- − Management
- −$2,220
- − Depreciation
- −$5,004
- Taxable income
- $4,429
- Est. tax owed @ 24.0%
- −$1,063
- After-tax cash flow
- $5,793/yr
For passive investors: Depreciation is non-cash, so a rental often shows a tax loss while cash-flowing — sheltering income. Rental losses are passive: they offset passive income freely, and up to $25,000/yr can offset ordinary (W-2) income if you actively participate and your MAGI is under $100k (phasing out to $0 by $150k); unused losses carry forward. On sale, claimed depreciation is recaptured at up to 25%, and gains may owe capital-gains tax (a 1031 exchange can defer both). Figures are a year-1 estimate at your 24.0% rate — not tax advice; consult a CPA.
Condition & rehab AI · 10 photos
This modern, well-maintained home with a good condition score and no visible repairs needed is ready for immediate occupancy and can be easily enhanced with minor updates to boost its value.
Value-add opportunities
- Both Painting the exterior — Fresh paint can enhance curb appeal and property value.
- Both Landscaping improvements — Enhanced landscaping can attract more potential buyers or renters.
- Both Add smart home features — Modern technology can increase both resale and rental value.
- Both Install smart thermostat — Energy-efficient systems can lower utility costs and attract eco-conscious buyers or renters.
Renovation cost estimate screening
Value-add ROI direction
- Both Painting the exterior — Fresh paint can enhance curb appeal and property value. ↑
- Both Landscaping improvements — Enhanced landscaping can attract more potential buyers or renters. ↑
- Both Add smart home features — Modern technology can increase both resale and rental value. ↑
- Both Install smart thermostat — Energy-efficient systems can lower utility costs and attract eco-conscious buyers or renters. ↑
ⓘ Cost ranges are severity-bucket heuristics (US national rule-of-thumb). Get contractor quotes + a written scope before underwriting a rehab budget.
Schools (NCES district)
- District
- Colorado Springs School District No. 11 In The County Of E
- NCES district ID
- 0803060
- Math proficiency
- 20% ▼ -8.00%
- Reading proficiency
- 37% ▼ -4.00%
- Median HH income
- $47,884
- Composite
- 24.69/100
- National rank
- #7613
- State rank
- #56 of 86 in CO
Livability — Cimarron Hills
- Score
- 68/100
- State rank
- #111
- US rank
- #9580
Category grades
Schools grade is shown separately in the Schools card above.
Census & demographics
- Census place
- Cimarron Hills, CO
- County
- El Paso County · 689,348 people
- City population
- 23,570
- Metro
- Colorado Springs, CO
- Population (ZIP)
- 23,884
- Household income
- $72,352
- Rent vs Own
- Severe rent burden
- 650.0
Population outlook (El Paso County) Hauer SSP2
- Today (2025)
- 768,926 people
- By 2030
- 815,739 · +6.1%
- By 2040
- 903,489 · +17.5%
- By 2050
- 981,204 · +27.6%
- By 2075
- 1,155,542 · +50.3%
- By 2100
- 1,202,070 · +56.3%
Race, ethnicity, and origin ACS 2023
- Neighborhood character
- Diverse neighborhood (Simpson 0.57)
- Race & ethnicity
- White 59% Hispanic / Latino 27% Two or more races 15% Black 4% Asian 2% Native American 1%
- Hispanic origin (detail)
- Mexican 17% Puerto Rican 2%
- Common ancestry
- Italian 4% Slovak 3% Lithuanian 3%
- Foreign-born
- 6% · Canada, Dominican Republic
- Languages at home
- 88% English-only · Spanish 9% Tagalog/Filipino 1%
Political lean MEDSL · El Paso
- 2024 margin
- Lean R (+9.8) · D 43.8% · R 53.5% · Other 2.7%
- 2008→2024 swing
- +9.0pp toward D · 2008: -18.8pp · 2024: -9.8pp
- All cycles
- 2024: R+9.8 2020: R+10.8 2016: R+22.6 2012: R+21.4 2008: R+18.8
Not yet ingested
- Civics
- —
Market trends
- HPI YoY
- ▼ -122.65%
- Current HPI
- 283.9227
- Rent YoY
- ▲ 1.59%
- Metro
- Colorado Springs, CO
- State GDP YoY
- ▲ 1.95%
- F500 in state
- 14
Industry mix (Fortune 500 HQ in CO)
| Industry | F500 HQs | Revenue |
|---|---|---|
| Technology Distribution | 1 | $31B |
|
||
| Food / Agriculture | 1 | $18B |
|
||
| Packaging | 1 | $14B |
|
||
| Healthcare | 1 | $13B |
|
||
| Energy | 1 | $10B |
|
||
| Technology | 1 | $4B |
|
||
Cash-flow waterfall
monthlySold comps — $/sqft
last 12 mo · ≤1 miLoading sold comps…