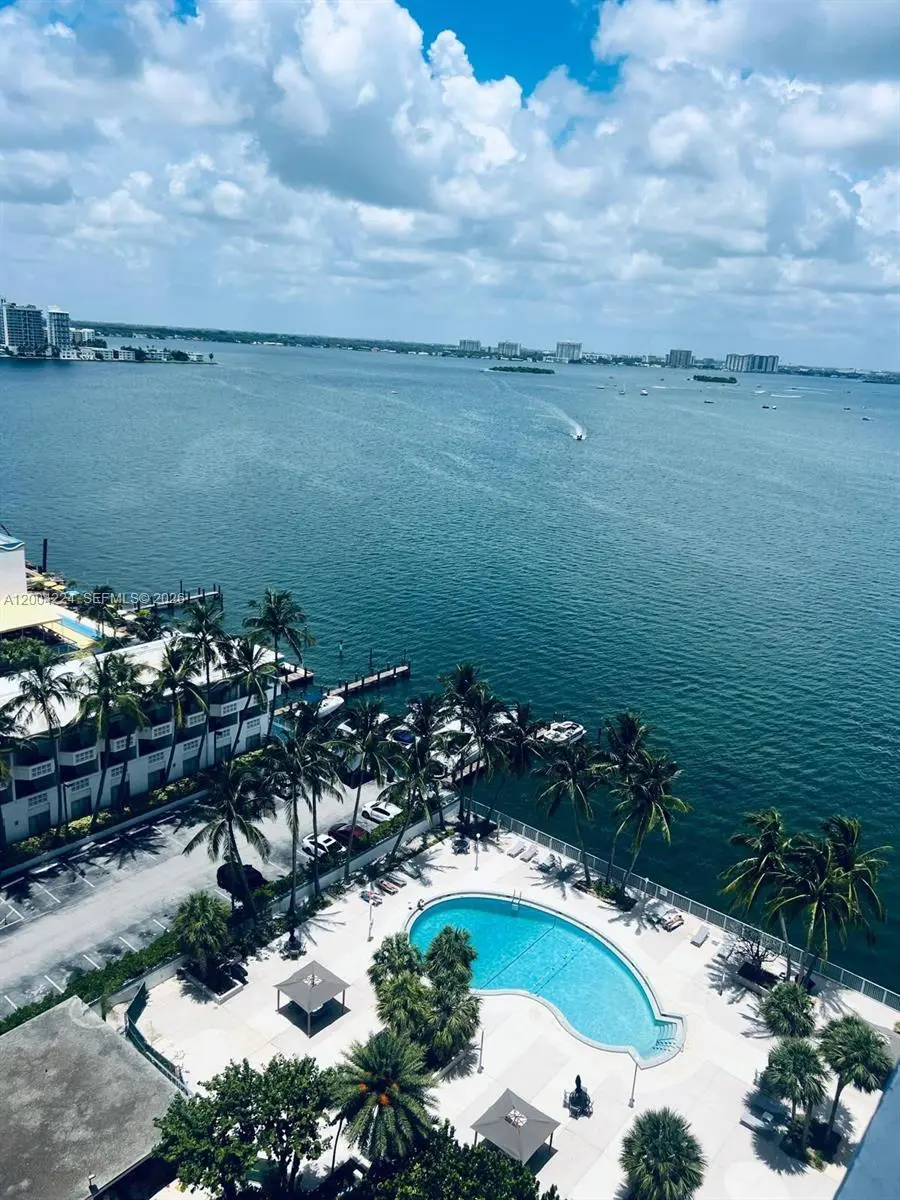
1865 79th St Csw Ph -J · North Bay Village, FL
Flood risk No data
- FEMA flood zone
- —
- Chance of flooding over 30 yrs
- —
- Est. flood insurance / yr
- —
Fire risk No data
- Est. fire insurance / yr
- —
Heat risk No data
- Hot days now (above threshold)
- —
- Hot days in 30 yrs
- —
Wind risk No data
- Chance of severe wind over 30 yrs
- —
Air-quality risk No data
- Unhealthy air days now
- —
- Unhealthy air days in 30 yrs
- —
Risk factors via First Street. Map © Google.
Why this score? — see what drove the D grade
The composite is a weighted blend of 9 inputs, each scored 0–100. Each bar is that input's sub-score; the figure is the points it added to the 100-point composite (weight × sub-score).
- Cash flow +11.0/30.0
- ARV discount +7.5/15.0
- 1% rule +7.1/10.0
- Livability +4.3/5.0
- Schools +4.2/10.0
- Condition / age +3.8/5.0
- DSCR +3.2/10.0
- Rent growth +2.6/5.0
- Appreciation +0.0/10.0
$317,000
🖨 Deal sheet (PDF) 📄 Offer letter ✓ Due diligence
Listing remarks
Penthouse unit offering breathtaking views and abundant natural light. This spacious residence features an open layout, ideal for both comfortable living and entertaining. Conveniently located near major highways, shopping, dining, and just minutes from the beach. A rare opportunity to enjoy elevated living in a prime Miami location.
Key facts
- Breathtaking views
- Open layout
- Prime miami location
Tags
Property features AI
Finance
- Financial info: Pets allowed with restrictions/conditions
- HOA & community: Monthly association fee of $976; Association includes cable TV and elevator(s)
Exterior
- Parking: Attached garage with 1 covered space
- Security: Secured elevator
- Home design: Property is attached; Entry/level: 16; Has a view
- Construction: Block construction; Effective year built; 16-story building
- Exterior features: Balcony (open); Bayfront waterfront
Interior
- Kitchen: Dishwasher
- Bedrooms: Bedroom located on the main level
- Flooring: Tile
- Bathrooms: 1 full bathroom
- Interior features: First-floor entry; Bedroom on main level; Tile flooring
Neighborhood map
What this means for you Summary
Snapshot
- This is a 1-bed/1.0-bath condo listed at $317k. Condition is rated good.
Deal economics
- At list price, monthly cash flow is $-132 ($-2k/yr) — negative.
- To cash-flow at today's rent, offer at most $298k (6.0% below list).
- Meets the 1% rule at list price ($4k rent vs $317k).
- Recommended offer: $298k (6.0% below list) — sets the bar for cash-flow.
Location & tenants
- Location reads 86/100 on livability (#18 in FL, #426 nationally) — a professional / high-income tenant draw. Strengths: crime A+, commute A+, employment A+; Watch: amenities F, cost of living F.
- Miami-Dade (suburban): math 45% / reading 54% proficiency, ranked #40 of 73 in FL (top 55%) — families likely to look elsewhere, expect single-tenant / working-renter base with shorter leases; 64% free/reduced lunch — lower-income household profile, screen leases tightly.
- Zoned schools: Treasure Island Elementary School (math 52% / reading 57%, grade C, #892 of 2,144 statewide, top 44%, 399 students, 59% FRL); Miami Beach Nautilus Middle School (math 46% / reading 58%, grade C+, #217 of 571 statewide, top 40%, 918 students, 44% FRL); Miami Beach Senior High School (math 21% / reading 48%, grade F, #386 of 667 statewide, top 59%, 2,175 students, 40% FRL) — zoned schools average 48% FRL vs 64% district-wide (16 pts lower); this property's tenant base skews higher-income than the district average.
- Market conditions: Rents flat; 649 active listings in the ZIP; 10,051 units permitted in Miami-Dade County in 2024 (7,758 in 5+ unit buildings).
- At $3,841/mo this rent would consume 67% of the median local household income ($69k/yr) (locally 3521% of renters already pay >50% of income on rent) — very limited rent-growth headroom before tenants either downsize or default.
Forward outlook
- Local home prices are declining (-3.0%/yr); year-one equity from $2k of loan paydown is wiped out by about $10k of value loss. Plan a longer hold.
- Miami-Dade County population projected at +28% by 2050 — long-run rental-demand tailwind backs the buy-and-hold thesis.
Negotiation context
- It's been on market 63 days — a 6% lower offer ($298k) is reasonable based on typical stale-listing flexibility.
Risks & watch-outs
- Watch-outs: HOA is 25% of rent; built in 1952 — expect roof / HVAC / electrical / plumbing capex.
Questions for the listing agent
- What do current leases actually rent for vs. the listed asking? Can we see a recent rent roll and the last 12 months of T-12 income?
- It's been on market 63 days. Have you received any prior offers? Is the seller open to a 6% concession, seller financing, or rate buy-down credit?
- Built in 1952 — when were the roof, HVAC, electrical panel, plumbing, and water heater last replaced?
- What does the HOA fee cover, when was the last increase, and are there any pending special assessments or reserve-fund shortfalls?
- Any open or pending special assessments — roof, HVAC, plumbing, elevator, façade? What's the per-unit balance and payoff schedule, and is the seller paying it off at close or rolling it to the buyer?
- Why hasn't it sold? Are there any deal-killer items the seller is aware of (foundation, flood, title, zoning, code violations)?
- Is there a deadline driving the sale (1031 exchange, divorce, estate, relocation)? That informs how much negotiation room exists.
- Schools are A-rated — typically a magnet for longer-tenancy family renters. What's the average tenant stay here, and is there a school-zone premium baked into asking?
- The area grade is low — what's the realistic commute time and amenity access for the typical tenant pool here? Any planned neighborhood developments (good or bad) we should know about?
- What's the average days-on-market for RENTAL listings here right now (not sales)? A rising rental-DOM trend means longer vacancies and softer asking-rent achievability than the comps imply.
- What's the recent tenant-quality profile in this submarket — average credit score on applications, eviction rate, late-payment / NSF rate, and stable-employment percentage? A property-management company in the area should have these aggregated.
- How much new apartment / multifamily construction is in the pipeline within 1–3 miles? Heavy new supply (>2% of stock underway) typically softens rents 12–24 months out; light construction supports rent growth.
Investment metrics
- 1% rule
- 1.21% ✓
- Cap rate
- 5.79%
- Cash-on-cash
- -1.79%
- DSCR
- 0.92
- GRM
- 6.9
CMA / ARV
No comps found within radius.
Projected returns pro-forma
-3.0% appreciation · 0.44% rent growth · sell at horizon
- IRR
- -23.3%
- Equity multiple
- 0.23×
- Total profit
- $-68,778
- Equity at exit
- $47,266
- IRR
- -32.9%
- Equity multiple
- -0.19×
- Total profit
- $-105,671
- Equity at exit
- $27,408
Cash invested: $88,760 (down + closing). Projections, not guarantees.
Landlord ↔ Tenant lean methodology
- Overall (STATE)
- 87 Strongly Landlord-Friendly
- State Florida
- 87 Strongly Landlord-Friendly · R+3
- County
- — inherits STATE
- City
- — inherits STATE
ZIP-level market 33141
- Rents YoY
- 0.4%
- Active inventory
- 649
- Price-to-rent
- 6.9×
Monthly cashflow live
- Estimated rent
- $3,841 medium interval (Pro) →
- Mortgage (P&I)
- −$1,662
- Tax est. 1.5%
- −$396 /mo · $4,755/yr
- Insurance
- −$132
- HOA
- −$976
- Lot rent
- −$0
- Vacancy / Maint / Mgmt
- −$807
- Net cashflow
- $-132
Break-even live
Sensitivity live
| Price | -10% $87 | -5% $-23 | +0% $-132 | +5% $-242 | +10% $-351 |
|---|---|---|---|---|---|
| Rent | -10% $-436 | -5% $-284 | +0% $-132 | +5% $20 | +10% $171 |
| Rate | -1.0pp $27 | -0.5pp $-52 | base $-132 | +0.5pp $-214 | +1.0pp $-298 |
UW: 25.0% down · 7.5% · 30yr · 1.5% tax · 5.0% vac · 8.0% maint · 8.0% mgmt
Financing live
Cash to close
- Down payment
- $79,250
- Closing costs
- $9,510
- Reserves months
- —
- Total cash needed
- —
Loan-product check · same deal, 3 products live
Conventional
25% down · 7.5% · 30yr
- Down + closing
- —
- Monthly P&I
- —
- Monthly cashflow
- —
- DSCR
- —
- Eligible?
- —
Personal DTI + credit; lowest rate.
DSCR
20% down · 8.5% · 30yr
- Down + closing
- —
- Monthly P&I
- —
- Monthly cashflow
- —
- DSCR
- —
- Eligible?
- —
No personal income docs; deal must DSCR.
Hard money
10% down · 12.0% · 12mo
- Down + closing
- —
- Monthly P&I
- —
- Monthly cashflow
- —
- DSCR
- —
- Eligible?
- —
Short-term bridge; refi at stabilization.
HOA detail condo
- Monthly dues
- $976 · $11,712/yr
- Assessments
- None detected in remarks — confirm with the listing agent.
Listing history 17 events
-
2026-06-22days on market $317,000 Active 63 DOM
-
2026-06-21days on market $317,000 Active 62 DOM
-
2026-06-18days on market $317,000 Active 59 DOM
-
2026-06-17days on market $317,000 Active 58 DOM
-
2026-06-16days on market $317,000 Active 57 DOM
-
2026-06-15days on market $317,000 Active 56 DOM
-
2026-06-13days on market $317,000 Active 54 DOM
-
2026-06-09days on market $317,000 Active 50 DOM
-
2026-06-08days on market $317,000 Active 49 DOM
-
2026-06-07days on market $317,000 Active 48 DOM
-
2026-06-04days on market $317,000 Active 45 DOM
-
2026-06-03days on market $317,000 Active 44 DOM
-
2026-06-02days on market $317,000 Active 43 DOM
-
2026-06-01days on market $317,000 Active 42 DOM
-
2026-05-31days on market $317,000 Active 41 DOM
-
2026-04-23price $317,000
-
2026-04-20$349,000 Active
ⓘ Source: listings_history table (triggers on properties + properties_extension) + one-shot
backfill from property_details.listing_events for pre-trigger history.
Nearby sold comps map
Loading sold comps map…
Walkable amenities ~0.75 mi
Loading nearby amenities…
Taxation est. · year 1
- Rental income
- $46,094
- − Mortgage interest
- −$17,757
- − Property taxes
- −$4,755
- − Insurance
- −$1,585
- − Repairs & maintenance
- −$3,687
- − Management
- −$3,687
- − HOA
- −$11,712
- − Depreciation
- −$9,222
- Taxable loss
- −$6,312
- Est. tax savings @ 24.0%
- +$1,515
- After-tax cash flow
- $-72/yr
For passive investors: Depreciation is non-cash, so a rental often shows a tax loss while cash-flowing — sheltering income. Rental losses are passive: they offset passive income freely, and up to $25,000/yr can offset ordinary (W-2) income if you actively participate and your MAGI is under $100k (phasing out to $0 by $150k); unused losses carry forward. On sale, claimed depreciation is recaptured at up to 25%, and gains may owe capital-gains tax (a 1031 exchange can defer both). Figures are a year-1 estimate at your 24.0% rate — not tax advice; consult a CPA.
Condition & rehab AI · 14 photos
This penthouse unit offers a good condition with minor repairs needed, and potential for significant value increase with cosmetic updates.
Repairs flagged
- Minor Kitchen backsplash — The backsplash shows signs of wear, but not severe damage.
- Minor Bathroom tiles — The tiles in the bathroom show some wear, but not severe damage.
Value-add opportunities
- Both Paint interior walls — Fresh paint can improve the overall appearance and value of the home.
- Both Replace kitchen backsplash — A new backsplash can enhance the kitchen's aesthetic and functionality.
- Both Replace bathroom tiles — New tiles can improve the bathroom's appearance and functionality.
Renovation cost estimate screening
| Repair item | Severity | Est. cost |
|---|---|---|
| Kitchen backsplash · The backsplash shows signs of wear, but not severe damage. | Minor | $500–3,000 |
| Bathroom tiles · The tiles in the bathroom show some wear, but not severe damage. | Minor | $500–3,000 |
| Total estimated repair cost · 2 items | $1,000–6,000 |
Value-add ROI direction
- Both Paint interior walls — Fresh paint can improve the overall appearance and value of the home. ↑
- Both Replace kitchen backsplash — A new backsplash can enhance the kitchen's aesthetic and functionality. ↑
- Both Replace bathroom tiles — New tiles can improve the bathroom's appearance and functionality. ↑
ⓘ Cost ranges are severity-bucket heuristics (US national rule-of-thumb). Get contractor quotes + a written scope before underwriting a rehab budget.
Schools (NCES district)
- District
- Miami-Dade
- NCES district ID
- 1200390
- Math proficiency
- 45% ▼ -16.00%
- Reading proficiency
- 54% ▼ -5.00%
- Median HH income
- $43,928
- Composite
- 41.76/100
- National rank
- #3397
- State rank
- #40 of 73 in FL
Livability — North Bay Village
- Score
- 86/100
- State rank
- #18
- US rank
- #426
Category grades
Schools grade is shown separately in the Schools card above.
Census & demographics
- Census place
- North Bay Village, FL
- County
- Miami-Dade County · 2,697,751 people
- Metro
- Miami-Fort Lauderdale-Pompano Beach, FL
- Population (ZIP)
- 36,438
- Household income
- $68,738
- Rent vs Own
- Severe rent burden
- 3521.0
Population outlook (Miami-Dade County) Hauer SSP2
- Today (2025)
- 3,126,439 people
- By 2030
- 3,325,765 · +6.4%
- By 2040
- 3,697,561 · +18.3%
- By 2050
- 4,012,134 · +28.3%
- By 2075
- 4,605,612 · +47.3%
- By 2100
- 4,866,598 · +55.7%
Race, ethnicity, and origin ACS 2023
- Neighborhood character
- Predominantly Hispanic (67%)
- Race & ethnicity
- Hispanic / Latino 67% Two or more races 36% White 20% Black 4% Asian 3%
- Hispanic origin (detail)
- Mexican 1% Puerto Rican 3% Cuban 27% Salvadoran 6%
- Common ancestry
- Scotch-Irish 2% Romanian 2% Armenian 1%
- Foreign-born
- 62% · Canada, Jamaica, Dominican Republic
- Languages at home
- 18% English-only · Spanish 69% Other Indo-European 4% French/Haitian/Cajun 3%
Political lean MEDSL · Miami-Dade
- 2024 margin
- R (+11.4) · D 43.9% · R 55.4%
- 2008→2024 swing
- -27.6pp toward R · 2008: 16.1pp · 2024: -11.4pp
- All cycles
- 2024: R+11.4 2020: D+7.3 2016: D+29.6 2012: D+23.7 2008: D+16.1
Not yet ingested
- Civics
- —
Market trends
- HPI YoY
- ▼ -472.71%
- Current HPI
- 336.7298
- Rent YoY
- ▲ 0.44%
- Metro
- Miami-Fort Lauderdale-Pompano Beach, FL
- State GDP YoY
- ▲ 3.28%
- F500 in state
- 36
Industry mix (Fortune 500 HQ in FL)
| Industry | F500 HQs | Revenue |
|---|---|---|
| Industrial Technology | 2 | $29B |
|
||
| Insurance | 2 | $17B |
|
||
| Retail | 1 | $60B |
|
||
| Technology Distribution | 1 | $58B |
|
||
| Homebuilding | 1 | $35B |
|
||
| Technology Manufacturing | 1 | $35B |
|
||
Price history
-9.2% since first listed2 events — show timeline
- 2026-04-23 Price Changed $317,000 MARMLS
- 2026-04-20 Listed $349,000 MARMLS
Cash-flow waterfall
monthlySold comps — $/sqft
last 12 mo · ≤1 miLoading sold comps…