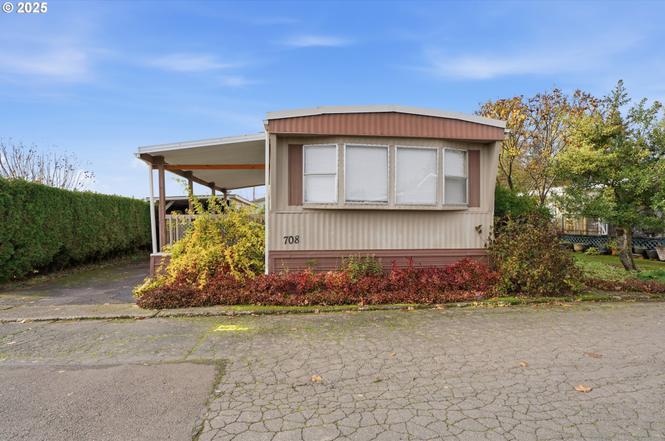
205 W Heintz St #708 · Molalla, OR
Flood risk 1/10 · Minimal
- FEMA flood zone
- X (unshaded)
- Chance of flooding over 30 yrs
- 0.0%
- Est. flood insurance / yr
- $507 – $1,088
Fire risk 6/10 · Moderate
- Est. fire insurance / yr
- $498 – $926
Heat risk 3/10 · Minor
- Hot days now (above 92°F)
- 7 days/yr
- Hot days in 30 yrs
- 15 days/yr
Wind risk 1/10 · Minimal
- Chance of severe wind over 30 yrs
- —
Air-quality risk 10/10 · Severe
- Unhealthy air days now
- 14 days/yr
- Unhealthy air days in 30 yrs
- 17 days/yr
Risk factors via First Street. Map © Google.
Why this score? — see what drove the B- grade
The composite is a weighted blend of 9 inputs, each scored 0–100. Each bar is that input's sub-score; the figure is the points it added to the 100-point composite (weight × sub-score).
- Cash flow +30.0/30.0
- 1% rule +10.0/10.0
- DSCR +10.0/10.0
- ARV discount +7.5/15.0
- Livability +4.0/5.0
- Schools +2.8/10.0
- Rent growth +2.5/5.0
- Condition / age +2.5/5.0
- Appreciation +0.0/10.0
$65,000
🖨 Deal sheet 📄 Offer letter ✓ Due diligence
Listing remarks
Impeccably maintained 2-bedroom, 1-bath home in a quiet 55+ community! This inviting residence features upgraded, like-new carpet, a covered deck with ramp access, and a carport with additional driveway parking. Pride of ownership is evident throughout, offering a truly move-in-ready experience. With water, sewer, trash, and lawn care all included in the affordable $590/month space rent, this home provides exceptional value for anyone seeking a comfortable and convenient lifestyle in a well-kept community.
Key facts
- Covered deck
- Carport
- Ramp access
Tags
Property features AI
Finance
- Other: Land lease expires November 30, 2025
- Financial info: Land lease (monthly) — lot rent reported
- HOA & community: Community amenities include trash and water; Located in Twin Firs Mobile Home Park; Senior community
Exterior
- Parking: Carport; Driveway
- Utilities: Electric fuel; Public water; Public sewer
- Home design: Manufactured home in park; Single-story; Model: Homette; Manufacturer: FREEDOM/SKYLINE; Resale condition; No significant view
- Construction: Built in 1981; Rubber roof; Skirting foundation
- Exterior features: Deck; Porch; Storm doors; Wood siding
Interior
- Kitchen: Kitchen on main level; Electric hot water
- Bedrooms: Primary bedroom on main level; Second bedroom on main level
- Bathrooms: One full bathroom (main level)
- Heating & cooling: Baseboard heating; Forced air heating; No central cooling
- Interior features: Accessible approach with ramp; Main-floor bedroom with bath; One-level living; Accessible parking and pathway; Crawl space basement
Neighborhood map
What this means for you Summary
Snapshot
- This is a 2-bed/1.0-bath other listed at $65k.
Deal economics
- At list price, monthly cash flow is $946 ($11k/yr) — positive.
- The deal already cash-flows at list — no discount required.
- Meets the 1% rule at list price ($2k rent vs $65k).
- Recommended offer: $57k (12.0% below list) — sets the bar for market timing.
- Cap rate 23.8% vs local median 2.8% in Molalla — top-decile yield for the area; either an underpriced asset or a hidden risk that comps aren't pricing in. Stress-test before assuming the spread holds.
Location & tenants
- Location reads 79/100 on livability (#62 in OR, #2,293 nationally) — a middle-class / working-renter tenant base. Strengths: crime A+, housing A+, health & safety A+; Watch: cost of living C-, amenities F.
- Molalla River SD 35 (town): math 21% / reading 43% proficiency, ranked #32 of 58 in OR (top 55%) — families likely to look elsewhere, expect single-tenant / working-renter base with shorter leases.
- Zoned schools: Molalla River Academy (math 34% / reading 54%, grade F, #143 of 412 statewide, top 38%, 202 students, 18% FRL, charter); Molalla River Middle School (math 15% / reading 41%, grade F, #95 of 128 statewide, top 74%, 532 students, 33% FRL); Molalla High School (math 27% / reading 52%, grade F, #78 of 143 statewide, top 58%, 763 students, 32% FRL).
- Market conditions: 108 active listings in the ZIP; 5 comparable units currently listed for rent nearby; rentals leasing fast (median 2d on market — plan ~1-2 weeks tenant-placement turnaround); solid renter incomes; 946 units permitted in Clackamas County in 2024 (188 in 5+ unit buildings).
Forward outlook
- Local home prices are declining (-3.0%/yr); year-one equity from $449 of loan paydown is wiped out by about $2k of value loss. Plan a longer hold.
- Clackamas County population projected at +25% by 2050 — long-run rental-demand tailwind backs the buy-and-hold thesis.
- At projected returns (-3.0% appreciation + 3.0% rent growth), your $18k cash investment doubles in ~2 years — after that, you're playing with house money.
Negotiation context
- It's been on market 152 days — a 12% lower offer ($57k) is reasonable based on typical stale-listing flexibility.
Risks & watch-outs
- Climate carrying-cost: major wildfire risk — expect insurance premiums to compound above CPI over the hold.
Questions for the listing agent
- It's been on market 152 days. Have you received any prior offers? Is the seller open to a 12% concession, seller financing, or rate buy-down credit?
- Why hasn't it sold? Are there any deal-killer items the seller is aware of (foundation, flood, title, zoning, code violations)?
- Is there a deadline driving the sale (1031 exchange, divorce, estate, relocation)? That informs how much negotiation room exists.
- Schools are D-rated, which usually means shorter tenancies and higher turnover. Who's the typical renter profile here, and what's been the actual vacancy rate?
- What's the average days-on-market for RENTAL listings here right now (not sales)? A rising rental-DOM trend means longer vacancies and softer asking-rent achievability than the comps imply.
- What's the recent tenant-quality profile in this submarket — average credit score on applications, eviction rate, late-payment / NSF rate, and stable-employment percentage? A property-management company in the area should have these aggregated.
- How much new for-sale + rental construction is in the pipeline within 1–3 miles? Heavy new supply typically softens prices + rents 12–24 months out; constrained supply supports both.
Investment metrics
- 1% rule
- 2.59% ✓
- Cap rate
- 23.76%
- Cash-on-cash
- 62.39%
- DSCR
- 3.78
- GRM
- 3.2
CMA / ARV
No comps found within radius.
Projected returns pro-forma
-3.0% appreciation · 3.0% rent growth · sell at horizon
- IRR
- 61.3%
- Equity multiple
- 3.73×
- Total profit
- $49,723
- Equity at exit
- $9,692
- IRR
- 65.9%
- Equity multiple
- 7.64×
- Total profit
- $120,845
- Equity at exit
- $5,620
Cash invested: $18,200 (down + closing). Projections, not guarantees.
Landlord ↔ Tenant lean methodology
- Overall (STATE)
- 28 Tenant-Leaning
- State Oregon
- 28 Tenant-Leaning · D+6
- County
- — inherits STATE
- City
- — inherits STATE
ZIP-level market 97038
- Active inventory
- 108
- Price-to-rent
- 3.2×
Monthly cashflow live
- Estimated rent
- $1,683 high interval (Pro) →
- Mortgage (P&I)
- −$341
- Tax from tax record
- −$15 /mo · $182/yr
- Insurance
- −$27
- HOA
- −$0
- Vacancy / Maint / Mgmt
- −$353
- Net cashflow
- $946
Break-even live
UW: 25.0% down · 7.5% · 30yr · 1.5% tax · 5.0% vac · 8.0% maint · 8.0% mgmt
Financing live
Cash to close
- Down payment
- $16,250
- Closing costs
- $1,950
- Reserves months
- —
- Total cash needed
- —
Loan-product check · same deal, 3 products live
Conventional
25% down · 7.5% · 30yr
- Down + closing
- —
- Monthly P&I
- —
- Monthly cashflow
- —
- DSCR
- —
- Eligible?
- —
Personal DTI + credit; lowest rate.
DSCR
20% down · 8.5% · 30yr
- Down + closing
- —
- Monthly P&I
- —
- Monthly cashflow
- —
- DSCR
- —
- Eligible?
- —
No personal income docs; deal must DSCR.
Hard money
10% down · 12.0% · 12mo
- Down + closing
- —
- Monthly P&I
- —
- Monthly cashflow
- —
- DSCR
- —
- Eligible?
- —
Short-term bridge; refi at stabilization.
Rent comps 5 comps
| Address | Beds | Baths | Sqft | Rent | $/sqft | DOM | Units | Dist |
|---|---|---|---|---|---|---|---|---|
| 201 S Leroy Ave Molalla, OR | 1.0–3.0 | 1.0–2.0 | 966 | $1,908 | $1.98 | 1d | 11 | 0.56mi |
| 872 W Main St Molalla, OR | 3.0 | 1.0–2.0 | 876 | $1,872 | $2.14 | 1d | 23 | 0.76mi |
| 1000 W Main St Molalla, OR | 2.0 | 1.0 | 945 | $1,419 | $1.50 | 1d | 1 | 0.82mi |
| 899 E Main St Molalla, OR | 2.0 | 1.0 | 828 | $1,215 | $1.47 | 1d | 1 | 0.88mi |
| 1111 Meadow Dr Molalla, OR | 2.0 | 1.0 | 855 | $1,525 | $1.78 | 1d | 2 | 0.93mi |
Listing history 3 events
-
2026-05-02status Pending
-
2025-12-09historical Active with Bumpable Contingency
-
2025-12-01$65,000 Active
ⓘ Source: listings_history table (triggers on properties + properties_extension) + one-shot
backfill from property_details.listing_events for pre-trigger history.
Tax reassessment forecast OR · Resets to sale price
- Current annual tax
- $182 · $15/mo
- Projected year-2 tax
- $630 · $53/mo
- Expected delta
- +$448/yr (+$37/mo · 245.5%)
ⓘ Screening estimate from a state-policy table — verify with the county assessor before closing.
Climate risk First Street
- Flood 1/10 Low FEMA zone X (unshaded) · 0% chance over 30 yrs
- Wildfire 6/10 Major
- Heat 3/10 Moderate 7 d/yr ≥92°F today · 15 d/yr by 30 yrs out
- Wind 1/10 Low
- Air quality 10/10 Extreme 14 unhealthy d/yr today · 17 by 30 yrs out
Nearby sold comps map
Loading sold comps map…
Walkable amenities ~0.75 mi
Loading nearby amenities…
Taxation est. · year 1
- Rental income
- $20,194
- − Mortgage interest
- −$3,641
- − Property taxes
- −$182
- − Insurance
- −$325
- − Repairs & maintenance
- −$1,616
- − Management
- −$1,616
- − Depreciation
- −$1,891
- Taxable income
- $10,924
- Est. tax owed @ 24.0%
- −$2,622
- After-tax cash flow
- $8,734/yr
For passive investors: Depreciation is non-cash, so a rental often shows a tax loss while cash-flowing — sheltering income. Rental losses are passive: they offset passive income freely, and up to $25,000/yr can offset ordinary (W-2) income if you actively participate and your MAGI is under $100k (phasing out to $0 by $150k); unused losses carry forward. On sale, claimed depreciation is recaptured at up to 25%, and gains may owe capital-gains tax (a 1031 exchange can defer both). Figures are a year-1 estimate at your 24.0% rate — not tax advice; consult a CPA.
Schools (NCES district)
- District
- Molalla River SD 35
- NCES district ID
- 4108310
- Math proficiency
- 21% ▼ -13.00%
- Reading proficiency
- 43% ▼ -7.00%
- Median HH income
- $57,194
- Composite
- 28.46/100
- National rank
- #6748
- State rank
- #32 of 58 in OR
Livability — Molalla
- Score
- 79/100
- State rank
- #62
- US rank
- #2293
Category grades
Schools grade is shown separately in the Schools card above.
Census & demographics
- Census place
- Molalla, OR
- County
- Clackamas County · 361,406 people
- City population
- 16,440
- Metro
- Portland-Vancouver-Hillsboro, OR-WA
- Population (ZIP)
- 16,440
- Household income
- $89,564
- Rent vs Own
- Severe rent burden
- 439.0
Population outlook (Clackamas County) Hauer SSP2
- Today (2025)
- 458,456 people
- By 2030
- 485,185 · +5.8%
- By 2040
- 532,932 · +16.2%
- By 2050
- 574,445 · +25.3%
- By 2075
- 665,497 · +45.2%
- By 2100
- 697,488 · +52.1%
Race, ethnicity, and origin ACS 2023
- Neighborhood character
- Predominantly White (86%)
- Race & ethnicity
- White 86% Hispanic / Latino 11% Two or more races 4%
- Hispanic origin (detail)
- Mexican 9%
- Common ancestry
- Slovak 4% Portuguese 4% Italian 3%
- Foreign-born
- 4% · Canada
- Languages at home
- 92% English-only · Spanish 6% Russian/Polish/Slavic 1% German/W. Germanic 1%
Political lean MEDSL · Clackamas
- 2024 margin
- Lean D (+9.7) · D 53.4% · R 43.6% · Other 3.0%
- 2008→2024 swing
- -0.6pp no change · 2008: 10.4pp · 2024: 9.7pp
- All cycles
- 2024: D+9.7 2020: D+11.1 2016: D+6.1 2012: D+3.5 2008: D+10.4
Not yet ingested
- Civics
- —
Market trends
- HPI YoY
- ▼ -185.07%
- Current HPI
- 287.6491
- Rent YoY
- —
- Metro
- Portland-Vancouver-Hillsboro, OR-WA
- State GDP YoY
- ▲ 2.05%
- F500 in state
- 2
Industry mix (Fortune 500 HQ in OR)
| Industry | F500 HQs | Revenue |
|---|---|---|
| Consumer Goods | 1 | $51B |
|
||
Price history
3 events — show timeline
- 2026-05-02 Pending — RMLS
- 2025-12-09 Contingent — RMLS
- 2025-12-01 Listed $65,000 RMLS
Property tax history
+1.8%/yrLatest (2018): $182 · +8.7% YoY. Source: county tax records.
Cash-flow waterfall
monthlySold comps — $/sqft
last 12 mo · ≤1 miLoading sold comps…