1208 Breezy Oak Dr · Josephine, TX
Flood risk No data
- FEMA flood zone
- —
- Chance of flooding over 30 yrs
- —
- Est. flood insurance / yr
- —
Fire risk No data
- Est. fire insurance / yr
- —
Heat risk No data
- Hot days now (above threshold)
- —
- Hot days in 30 yrs
- —
Wind risk No data
- Chance of severe wind over 30 yrs
- —
Air-quality risk No data
- Unhealthy air days now
- —
- Unhealthy air days in 30 yrs
- —
Risk factors via First Street. Map © Google.
Why this score? — see what drove the D- grade
The composite is a weighted blend of 9 inputs, each scored 0–100. Each bar is that input's sub-score; the figure is the points it added to the 100-point composite (weight × sub-score).
- Appreciation +10.0/10.0
- Cash flow +7.6/30.0
- ARV discount +7.0/15.0
- Schools +3.2/10.0
- Livability +3.0/5.0
- 1% rule +2.5/10.0
- Rent growth +2.5/5.0
- Condition / age +2.5/5.0
- DSCR +1.7/10.0
$272,990
🖨 Deal sheet (PDF) 📄 Offer letter ✓ Due diligence
Listing remarks MLS
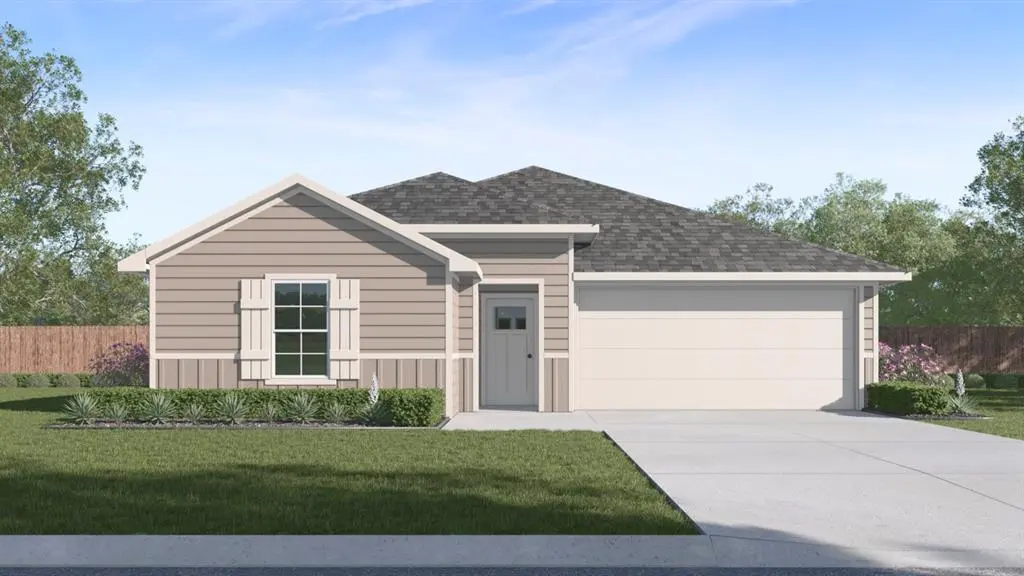
Welcome to 1208 Breezy Oak, part of our Waverly Estates community in Josephine, TX. Experience the perfect combination of modern amenities and comfortable living with this thoughtfully designed Express Series home. The architecturally designed elevation, featuring divided light windows and a front-facing garage with decorative hardware, creates a striking curb appeal. A covered front porch leads to a raised panel fiberglass insulated front door, welcoming you inside. Upon entry, a spacious foyer seamlessly transitions into the open concept living areas. The kitchen, equipped with cabinets with hidden hinges, granite or quartz countertops, and stainless-steel appliances, offers both style and functionality. A built-in sink, dishwasher, and spacious pantry cater to everyday needs. The primary bedroom, a tranquil retreat, features an adjoining bathroom designed for convenience. An elongated vanity with a sink and non-framed mirror, along with a walk-in closet, provides ample space and comfort. This Express Series home is further enhanced by a user-friendly smart home system and an innovative tech package, offering modern convenience and seamless connectivity. The blend of thoughtful design and contemporary features makes it an ideal choice for modern living. Photos shown here may not depict the specified home and features. Contact us today for more details!
Key facts
- 7,405 sq ft lot
- 2 garage spots
- Built 2026
Property features AI
Finance
- Other: Builder listing; possession at closing/funding or upon completion
- Financial info: Financing accepted: Cash, Conventional, FHA, USDA, VA
- HOA & community: Mandatory association; Association fee $275 semi-annually; Association fee includes full use of facilities; HOA managed by AAM
Exterior
- Parking: Attached garage; Two garage spaces (approx. 20' wide x 20' deep, 10' height); Two covered parking spaces
- Security: Smoke detectors; Carbon monoxide detectors
- Utilities: City water; City sewer; Municipal utility district; Energy-efficient features including enhanced attic insulation, HVAC efficiency, insulation, efficient lighting, programmable thermostat, and efficient windows
- Home design: Single-family residence; One story; New construction (incomplete)
- Construction: Brick exterior; Composition roof; Slab foundation; Year built: 2026 (new construction - incomplete)
- Exterior features: Wood fencing; Less than 0.5-acre lot
Interior
- Kitchen: Dishwasher; Disposal; Electric range; Microwave; Breakfast bar; Built-in cabinets; Water line to refrigerator; Granite countertops
- Bedrooms: Primary bedroom (first floor) with ensuite bath and walk-in closet; Three additional bedrooms (first floor), two of which are in a split-bedroom arrangement
- Flooring: Carpet; Laminate
- Bathrooms: Two full bathrooms
- Heating & cooling: Central heating (electric); Central air conditioning (electric)
- Interior features: Open floorplan with decorative lighting; Eat-in kitchen with kitchen island and pantry; Granite counters; Cable TV available; High-speed internet available
- Laundry & utility: Utilities include city water and city sewer
Neighborhood map
What this means for you Summary
Snapshot
- This is a 4-bed/2.0-bath single-family listed at $273k.
Deal economics
- At list price, monthly cash flow is $-325 ($-4k/yr) — negative.
- To cash-flow at today's rent, offer at most $226k (17.2% below list).
- To meet the 1% rule (rent ≥ 1% of price), the offer needs to be $204k (25.5% below list).
- Recommended offer: $204k (25.5% below list) — sets the bar for 1% rule.
Location & tenants
- Location reads 60/100 on livability (#1,076 in TX) — a middle-class / working-renter tenant base. Strengths: cost of living A+, housing A+, crime A-; Watch: amenities F, commute F, health & safety F.
- Community ISD (rural): math 30% / reading 38% proficiency, ranked #479 of 826 in TX (top 58%) — families likely to look elsewhere, expect single-tenant / working-renter base with shorter leases.
- Zoned schools: Leland E Edge Middle (math 25% / reading 35%, grade F, #1,056 of 1,662 statewide, top 65%, 931 students, 53% FRL) — zoned schools average 53% FRL vs 36% district-wide (18 pts higher); higher-poverty schools than district average — tighter screening recommended.
- Market conditions: 421 active listings in the ZIP; 32 comparable units currently listed for rent nearby; rentals at typical pace (median 15d on market — plan ~3-4 weeks tenant-placement turnaround); 19,194 units permitted in Collin County in 2024 (3,988 in 5+ unit buildings).
Forward outlook
- In year one you build about $29k of equity ($2k loan paydown + $27k appreciation (10.0% local appreciation)).
- Collin County population projected at +60% by 2050 — long-run rental-demand tailwind backs the buy-and-hold thesis.
- By year 2, paydown + projected appreciation supports a ~$47k cash-out refi (75% LTV) — recoverable capital for the next deal without selling this one.
Negotiation context
- It's been on market 47 days — a 3% lower offer ($265k) is reasonable based on typical stale-listing flexibility.
- 2 sale attempts; this cycle's ask has dropped $30k (10%) from the opening price — seller is motivated, your offer sets the floor, not the list.
Questions for the listing agent
- What do current leases actually rent for vs. the listed asking? Can we see a recent rent roll and the last 12 months of T-12 income?
- It's been on market 47 days. Have you received any prior offers? Is the seller open to a 25% concession, seller financing, or rate buy-down credit?
- What does the HOA fee cover, when was the last increase, and are there any pending special assessments or reserve-fund shortfalls?
- Is there a deadline driving the sale (1031 exchange, divorce, estate, relocation)? That informs how much negotiation room exists.
- Schools are F-rated, which usually means shorter tenancies and higher turnover. Who's the typical renter profile here, and what's been the actual vacancy rate?
- The area grade is low — what's the realistic commute time and amenity access for the typical tenant pool here? Any planned neighborhood developments (good or bad) we should know about?
- What's the average days-on-market for RENTAL listings here right now (not sales)? A rising rental-DOM trend means longer vacancies and softer asking-rent achievability than the comps imply.
- What's the recent tenant-quality profile in this submarket — average credit score on applications, eviction rate, late-payment / NSF rate, and stable-employment percentage? A property-management company in the area should have these aggregated.
- How much new for-sale + rental construction is in the pipeline within 1–3 miles? Heavy new supply typically softens prices + rents 12–24 months out; constrained supply supports both.
Investment metrics
- 1% rule
- 0.75% ✗
- Cap rate
- 4.86%
- Cash-on-cash
- -5.10%
- DSCR
- 0.77
- GRM
- 11.2
CMA / ARV
- ARV (median comp)
- $270,200
- List price
- $272,990
- Delta
- 1.03%
- Verdict
- FAIR
- Comps
- 20 within 1.0 mi
Show comp detail 12 sales within ~0.75 mi
| Address | Dist | Beds/Ba | Sqft | Sold | Price | $/sf | Match |
|---|---|---|---|---|---|---|---|
| 407 Saddle Blanket Dr | 0.13mi | 4/2.0 | 1,801 (+9%) | 2mo | $273,990 | $152 | 77 |
| 506 Saddle Blanket Dr | 0.20mi | 4/2.0 | 1,801 (+9%) | 1mo | $290,990 | $162 | 74 |
| 406 Saddle Blanket Dr | 0.14mi | 3/2.0 (-1) | 1,404 (-15%) | 0mo | $251,010 | $179 | 63 |
| 409 Saddle Blanket Dr | 0.14mi | 3/2.0 (-1) | 1,404 (-15%) | 3mo | $270,990 | $193 | 62 |
| 406 Shady Bank Way | 0.50mi | 3/2.0 (-1) | 1,712 (+4%) | 6mo | $319,235 | $186 | 60 |
| 208 Cultivator Ct | 0.57mi | 4/2.0 | 1,537 (-7%) | 6mo | $239,900 | $156 | 57 |
| 503 Silo Cir | 0.74mi | 4/2.0 | 1,732 (+5%) | 2mo | $249,900 | $144 | 55 |
| 909 Driftwood Ln | 0.40mi | 3/2.0 (-1) | 1,840 (+12%) | 5mo | $384,891 | $209 | 53 |
| 505 Plum Dr | 0.55mi | 4/2.0 | 1,891 (+15%) | 3mo | $265,000 | $140 | 48 |
| 511 Magnolia Dr | 0.72mi | 3/2.0 (-1) | 1,526 (-8%) | 2mo | $219,900 | $144 | 47 |
| 302 Wagon Wheel Dr | 0.68mi | 3/2.0 (-1) | 1,450 (-12%) | 4mo | $254,000 | $175 | 40 |
| 1319 Lowhill Dr | 0.67mi | 3/2.0 (-1) | 1,457 (-12%) | 7mo | $238,000 | $163 | 39 |
Match score weights: distance 35% · size 25% · config 20% · recency 20%. Top-matched comps best support the ARV.
Projected returns pro-forma
10.0% appreciation · 3.0% rent growth · sell at horizon
- IRR
- 20.7%
- Equity multiple
- 2.68×
- Total profit
- $128,044
- Equity at exit
- $245,931
- IRR
- 18.8%
- Equity multiple
- 6.15×
- Total profit
- $393,457
- Equity at exit
- $530,360
Cash invested: $76,437 (down + closing). Projections, not guarantees.
Landlord ↔ Tenant lean methodology
- Overall (STATE)
- 87 Strongly Landlord-Friendly
- State Texas
- 87 Strongly Landlord-Friendly · R+5
- County
- — inherits STATE
- City
- — inherits STATE
ZIP-level market 75173
- Home prices YoY
- 3.1%
- Active inventory
- 421
- Price-to-rent
- 11.2×
Monthly cashflow live
- Estimated rent
- $2,035 high interval (Pro) →
- Mortgage (P&I)
- −$1,432
- Tax est. 1.5%
- −$341 /mo · $4,095/yr
- Insurance
- −$114
- HOA
- −$46
- Vacancy / Maint / Mgmt
- −$427
- Net cashflow
- $-325
Break-even live
Sensitivity live
| Price | -10% $-136 | -5% $-231 | +0% $-325 | +5% $-419 | +10% $-514 |
|---|---|---|---|---|---|
| Rent | -10% $-486 | -5% $-405 | +0% $-325 | +5% $-245 | +10% $-164 |
| Rate | -1.0pp $-187 | -0.5pp $-255 | base $-325 | +0.5pp $-396 | +1.0pp $-468 |
UW: 25.0% down · 7.5% · 30yr · 1.5% tax · 5.0% vac · 8.0% maint · 8.0% mgmt
Financing live
Cash to close
- Down payment
- $68,248
- Closing costs
- $8,190
- Reserves months
- —
- Total cash needed
- —
Loan-product check · same deal, 3 products live
Conventional
25% down · 7.5% · 30yr
- Down + closing
- —
- Monthly P&I
- —
- Monthly cashflow
- —
- DSCR
- —
- Eligible?
- —
Personal DTI + credit; lowest rate.
DSCR
20% down · 8.5% · 30yr
- Down + closing
- —
- Monthly P&I
- —
- Monthly cashflow
- —
- DSCR
- —
- Eligible?
- —
No personal income docs; deal must DSCR.
Hard money
10% down · 12.0% · 12mo
- Down + closing
- —
- Monthly P&I
- —
- Monthly cashflow
- —
- DSCR
- —
- Eligible?
- —
Short-term bridge; refi at stabilization.
Rent comps 32 comps
| Address | Beds | Baths | Sqft | Rent | $/sqft | DOM | Units | Dist |
|---|---|---|---|---|---|---|---|---|
| 214 Crooked Field Dr Royse City, TX | 3.0 | 2.0 | 1398 | $1,900 | $1.36 | 26d | 1 | 0.12mi |
| 503 Saddle Blanket Dr Nevada, TX | 4.0 | 3.0 | 2077 | $2,190 | $1.05 | 45d | 1 | 0.16mi |
| 504 Saddle Blanket Dr Nevada, TX | 4.0 | 2.0 | 1649 | $1,925 | $1.17 | 8d | 1 | 0.19mi |
| 504 Saddle Blanket Dr Nevada, TX | 4.0 | 2.0 | 1649 | $1,949 | $1.18 | 17d | 1 | 0.19mi |
| 319 Plum Dr Nevada, TX | 4.0 | 2.0 | 1587 | $1,899 | $1.20 | 12d | 1 | 0.55mi |
| 1307 Community Way Royse City, TX | 4.0 | 2.0 | 2104 | $2,100 | $1.00 | 45d | 1 | 0.57mi |
| 305 Silo Cir Royse City, TX | 4.0 | 2.0 | 2074 | $2,100 | $1.01 | 26d | 1 | 0.62mi |
| 311 Milo Way Royse City, TX | 4.0 | 2.0 | 2074 | $2,200 | $1.06 | 8d | 1 | 0.68mi |
| 802 Turnbuckle Ct Royse City, TX | 4.0 | 2.0 | 1577 | $1,849 | $1.17 | 45d | 1 | 0.78mi |
| 503 Cistern Way Royse City, TX | 3.0 | 2.0 | 1294 | $1,795 | $1.39 | 3d | 1 | 0.83mi |
| 508 Windrow Dr Royse City, TX | 3.0 | 2.0 | 1533 | $1,875 | $1.22 | 26d | 1 | 0.84mi |
| 508 Windrow Dr Royse City, TX | 3.0 | 2.0 | 1533 | $1,900 | $1.24 | 45d | 1 | 0.84mi |
| 1004 Cotton Gin Ct Royse City, TX | 4.0 | 2.0 | 1875 | $1,850 | $0.99 | 14d | 1 | 0.86mi |
| 1503 Cotton Gin Ct Royse City, TX | 3.0 | 2.0 | 1566 | $2,200 | $1.40 | 45d | 1 | 0.86mi |
| 1007 Cotton Gin Ct Royse City, TX | 3.0 | 2.0 | 1611 | $2,050 | $1.27 | 45d | 1 | 0.86mi |
| 801 Meadow Creek Ln Josephine, TX | 4.0 | 2.0 | 1757 | $2,500 | $1.42 | 6d | 1 | 0.88mi |
| 722 Windmill St Josephine, TX | 4.0 | 2.0 | 1568 | $2,190 | $1.40 | 3d | 1 | 0.90mi |
| 800 Windmill St Josephine, TX | 4.0 | 2.0 | 1843 | $2,100 | $1.14 | 9d | 1 | 0.90mi |
| 800 Windmill St Josephine, TX | 4.0 | 2.0 | 1843 | $2,100 | $1.14 | 1d | 1 | 0.90mi |
| 1501 Bridle Dr Josephine, TX | 4.0 | 2.0 | 2081 | $1,975 | $0.95 | 45d | 1 | 0.91mi |
| 315 Pine Hollow Way Josephine, TX | 4.0 | 3.0 | 2212 | $2,300 | $1.04 | 9d | 1 | 0.95mi |
| 1210 Honeysuckle Dr Josephine, TX | 5.0 | 2.0 | 1995 | $2,100 | $1.05 | 14d | 1 | 0.96mi |
| 711 Cistern Way Royse City, TX | 4.0 | 2.0 | 2081 | $1,975 | $0.95 | 9d | 1 | 1.05mi |
| 1208 Fieldstone Ct Royse City, TX | 4.0 | 2.0 | 1835 | $2,000 | $1.09 | 45d | 1 | 1.05mi |
| 717 Cottonwood WAY Josephine, TX | 4.0 | 3.0 | 2073 | $2,125 | $1.03 | 0d | 1 | 1.06mi |
| 306 E Cook St Josephine, TX | 3.0 | 2.0 | 1817 | $2,100 | $1.16 | 0d | 1 | 1.09mi |
| 1413 Thunder Canyon Way Josephine, TX | 5.0 | 2.0 | 2006 | $2,500 | $1.25 | 45d | 1 | 1.10mi |
| 1910 Bailer Way Royse City, TX | 3.0 | 2.0 | 1592 | $1,995 | $1.25 | 26d | 1 | 1.31mi |
| 2000 Bailer Way Royse City, TX | 3.0 | 2.5 | 1947 | $2,500 | $1.28 | 4d | 1 | 1.32mi |
| 2008 Bailer Way Royse City, TX | 3.0 | 2.0 | 1509 | $1,975 | $1.31 | 20d | 1 | 1.33mi |
| 816 Country Rd Royse City, TX | 4.0 | 2.5 | 2080 | $2,550 | $1.23 | 0d | 1 | 1.38mi |
| 903 Shear Dr Royse City, TX | 3.0 | 2.5 | 1898 | $2,000 | $1.05 | 4d | 1 | 1.39mi |
HOA detail
- Monthly dues
- $46 · $552/yr
- Likely covers
- security
Listing history 17 events
-
2026-06-21days on market $272,990 Active 47 DOM
-
2026-06-18days on market $272,990 Active 44 DOM
-
2026-06-17days on market $272,990 Active 43 DOM
-
2026-06-16days on market $272,990 Active 42 DOM
-
2026-06-15days on market $272,990 Active 41 DOM
-
2026-06-13days on market $272,990 Active 39 DOM
-
2026-06-13days on market $272,990 Active 38 DOM
-
2026-06-09days on market $272,990 Active 35 DOM
-
2026-06-08days on market $272,990 Active 34 DOM
-
2026-06-07days on market $272,990 Active 33 DOM
-
2026-06-04days on market $272,990 Active 30 DOM
-
2026-06-03days on market $272,990 Active 29 DOM
-
2026-06-02days on market $272,990 Active 28 DOM
-
2026-06-01days on market $272,990 Active 27 DOM
-
2026-05-31days on market $272,990 Active 26 DOM
-
2026-05-11price $302,990 580-char remark
-
2026-05-05$300,990 Active 580-char remark
ⓘ Source: listings_history table (triggers on properties + properties_extension) + one-shot
backfill from property_details.listing_events for pre-trigger history.
Nearby sold comps map
Loading sold comps map…
Walkable amenities ~0.75 mi
Loading nearby amenities…
Taxation est. · year 1
- Rental income
- $24,420
- − Mortgage interest
- −$15,292
- − Property taxes
- −$4,095
- − Insurance
- −$1,365
- − Repairs & maintenance
- −$1,954
- − Management
- −$1,954
- − HOA
- −$552
- − Depreciation
- −$7,942
- Taxable loss
- −$8,732
- Est. tax savings @ 24.0%
- +$2,096
- After-tax cash flow
- $-1,803/yr
For passive investors: Depreciation is non-cash, so a rental often shows a tax loss while cash-flowing — sheltering income. Rental losses are passive: they offset passive income freely, and up to $25,000/yr can offset ordinary (W-2) income if you actively participate and your MAGI is under $100k (phasing out to $0 by $150k); unused losses carry forward. On sale, claimed depreciation is recaptured at up to 25%, and gains may owe capital-gains tax (a 1031 exchange can defer both). Figures are a year-1 estimate at your 24.0% rate — not tax advice; consult a CPA.
Schools (NCES district)
- District
- Community ISD
- NCES district ID
- 4814850
- Math proficiency
- 30% ▼ -23.00%
- Reading proficiency
- 38% ▼ -11.00%
- Median HH income
- $71,841
- Composite
- 31.58/100
- National rank
- #5951
- State rank
- #479 of 826 in TX
Livability — Josephine
- Score
- 60/100
- State rank
- #1076
- US rank
- #19105
Category grades
Schools grade is shown separately in the Schools card above.
Census & demographics
- Population (ZIP)
- 9,284
Population outlook (Collin County) Hauer SSP2
- Today (2025)
- 1,210,074 people
- By 2030
- 1,358,201 · +12.2%
- By 2040
- 1,654,061 · +36.7%
- By 2050
- 1,937,359 · +60.1%
- By 2075
- 2,567,039 · +112.1%
- By 2100
- 2,952,048 · +144.0%
Race, ethnicity, and origin ACS 2023
- Neighborhood character
- Majority White (65%)
- Race & ethnicity
- White 65% Hispanic / Latino 28% Two or more races 15% Black 2% Native American 1%
- Hispanic origin (detail)
- Mexican 26%
- Common ancestry
- Slovak 2% Serbian 1% Iranian 1%
- Foreign-born
- 17% · Canada, Jamaica
- Languages at home
- 74% English-only · Spanish 24% Arabic 1%
Political lean MEDSL · Collin
- 2024 margin
- R (+11.1) · D 43.1% · R 54.3% · Other 2.6%
- 2008→2024 swing
- +14.4pp toward D · 2008: -25.6pp · 2024: -11.1pp
- All cycles
- 2024: R+11.1 2020: R+4.3 2016: R+17.0 2012: R+31.6 2008: R+25.6
Not yet ingested
- Civics
- —
Market trends
- HPI YoY
- ▲ 10.09%
- Current HPI
- 331.12
- Rent YoY
- —
- Metro
- —
- State GDP YoY
- ▲ 3.95%
- F500 in state
- 110
Industry mix (Fortune 500 HQ in TX)
| Industry | F500 HQs | Revenue |
|---|---|---|
| Energy | 16 | $1,198B |
|
||
| Technology | 5 | $198B |
|
||
| Engineering / Construction | 4 | $72B |
|
||
| Energy Services | 3 | $60B |
|
||
| Utilities | 3 | $41B |
|
||
| Healthcare | 2 | $330B |
|
||
Price history
-9.3% since first listed5 events — show timeline
- 2026-05-29 Price Changed $272,990 Zillow
- 2026-05-28 Price Changed $272,990 NTREIS
- 2026-05-28 Listed $302,990 Zillow
- 2026-05-11 Price Changed $302,990 NTREIS
- 2026-05-05 Listed $300,990 NTREIS
Cash-flow waterfall
monthlySold comps — $/sqft
last 12 mo · ≤1 miLoading sold comps…