93 Pine Cone Dr #93 · Cheswold, DE
Flood risk 1/10 · Minimal
- FEMA flood zone
- X (unshaded)
- Chance of flooding over 30 yrs
- 0.0%
- Est. flood insurance / yr
- $473 – $860
Fire risk 1/10 · Minimal
- Est. fire insurance / yr
- $476 – $884
Heat risk 8/10 · Major
- Hot days now (above 102°F)
- 7 days/yr
- Hot days in 30 yrs
- 16 days/yr
Wind risk 6/10 · Moderate
- Chance of severe wind over 30 yrs
- 74.0%
Air-quality risk 2/10 · Minimal
- Unhealthy air days now
- 1 days/yr
- Unhealthy air days in 30 yrs
- 2 days/yr
Risk factors via First Street. Map © Google.
Why this score? — see what drove the B+ grade
The composite is a weighted blend of 9 inputs, each scored 0–100. Each bar is that input's sub-score; the figure is the points it added to the 100-point composite (weight × sub-score).
- Cash flow +30.0/30.0
- ARV discount +15.0/15.0
- 1% rule +10.0/10.0
- DSCR +10.0/10.0
- Livability +3.1/5.0
- Rent growth +3.0/5.0
- Schools +2.0/10.0
- Condition / age +2.0/5.0
- Appreciation +0.0/10.0
$80,000
🖨 Deal sheet 📄 Offer letter ✓ Due diligence
Key facts
- 2 parking spots
- Built 1998
- Listed 38 days
Property features AI
Finance
- Financial info: Improvement assessed at $21,800
- HOA & community: Land lease of $720 per month; 99 years remaining on land lease; Property manager present
Exterior
- Parking: Driveway parking; Driveway fits 2 vehicles; Total of 2 garage/parking spaces
- Utilities: Electric power; Public sewer; Private water; Electric hot water
- Home design: Manufactured property; Single wide mobile home; Metal roof; Vinyl siding
- Construction: Vinyl siding construction; Metal roof; Manufactured structure
- Exterior features: Private water source; Public sewer; Municipal trash not provided; Above grade and below grade other structures
Interior
- Bedrooms: 3 bedrooms on the main level
- Bathrooms: 2 full bathrooms on the main level
- Heating & cooling: Heat pump(s) heating; Central air conditioning; Electric heating and cooling; Electric hot water
- Interior features: No basement; Living area per assessor
Neighborhood map
What this means for you Summary
Snapshot
- This is a 3-bed/2.0-bath single-family listed at $80k. Condition is rated fair.
Deal economics
- At list price, monthly cash flow is $1k ($12k/yr) — positive.
- The deal already cash-flows at list — no discount required.
- Meets the 1% rule at list price ($2k rent vs $80k).
- Recommended offer: $78k (3.0% below list) — sets the bar for market timing.
- Cap rate 21.7% vs local median 3.1% in Cheswold — top-decile yield for the area; either an underpriced asset or a hidden risk that comps aren't pricing in. Stress-test before assuming the spread holds.
Location & tenants
- Location reads 62/100 on livability (#62 in DE) — a middle-class / working-renter tenant base. Strengths: cost of living A+, housing A+, crime B; Watch: employment D, schools F, amenities F.
- Capital School District (urban): math 14% / reading 31% proficiency, ranked #24 of 26 in DE (top 92%) — low school quality limits family demand, transient renter base, plan for 1-2y turnover.
- Market conditions: Rents rising (+2.0%/yr); 184 active listings in the ZIP; 1,201 units permitted in Kent County in 2024 (116 in 5+ unit buildings).
- This rent runs 36% of the median local income ($66k/yr) — at the standard rent-burdened threshold; future hikes will face affordability resistance.
Forward outlook
- Local home prices are declining (-3.0%/yr); year-one equity from $553 of loan paydown is wiped out by about $2k of value loss. Plan a longer hold.
- Kent County population projected at +22% by 2050 — long-run rental-demand tailwind backs the buy-and-hold thesis.
- At projected returns (-3.0% appreciation + 2.0% rent growth), your $22k cash investment doubles in ~3 years — after that, you're playing with house money.
Negotiation context
- It's been on market 38 days — a 3% lower offer ($78k) is reasonable based on typical stale-listing flexibility.
Risks & watch-outs
- Climate carrying-cost: major wind risk, 74% chance of damaging wind over 30y; extreme-heat days projected 7→16/yr by 2055 (HVAC capex compounding) — expect insurance premiums to compound above CPI over the hold.
Questions for the listing agent
- It's been on market 38 days. Have you received any prior offers? Is the seller open to a 3% concession, seller financing, or rate buy-down credit?
- Have any recent inspections been done? Can we get a copy of the seller's disclosures and any deferred-maintenance estimates?
- Is there a deadline driving the sale (1031 exchange, divorce, estate, relocation)? That informs how much negotiation room exists.
- Schools are F-rated, which usually means shorter tenancies and higher turnover. Who's the typical renter profile here, and what's been the actual vacancy rate?
- What's the average days-on-market for RENTAL listings here right now (not sales)? A rising rental-DOM trend means longer vacancies and softer asking-rent achievability than the comps imply.
- What's the recent tenant-quality profile in this submarket — average credit score on applications, eviction rate, late-payment / NSF rate, and stable-employment percentage? A property-management company in the area should have these aggregated.
- How much new for-sale + rental construction is in the pipeline within 1–3 miles? Heavy new supply typically softens prices + rents 12–24 months out; constrained supply supports both.
Investment metrics
- 1% rule
- 2.50% ✓
- Cap rate
- 21.69%
- Cash-on-cash
- 54.98%
- DSCR
- 3.45
- GRM
- 3.3
CMA / ARV
- ARV (median comp)
- $99,498
- List price
- $80,000
- Delta
- -19.60%
- Verdict
- UNDERPRICED
- Comps
- 20 within 1.0 mi
Show comp detail 10 sales within ~0.75 mi
| Address | Dist | Beds/Ba | Sqft | Sold | Price | $/sf | Match |
|---|---|---|---|---|---|---|---|
| 108 S Dayflower Ct #57 | 0.39mi | 3/2.0 | 1,064 (0%) | 2mo | $55,000 | $52 | 80 |
| 36 Pinewood Acres Ave #36 | 0.05mi | 2/2.0 (-1) | 1,064 (0%) | 19mo | $67,400 | $63 | 77 |
| 345 Norway Dr #345 | 0.09mi | 3/2.0 | 1,216 (+14%) | 3mo | $86,500 | $71 | 69 |
| 46 Pinewood Acres Ave | 0.08mi | 2/2.0 (-1) | 980 (-8%) | 20mo | $55,000 | $56 | 61 |
| 127 Pine Cone Dr #127 | 0.13mi | 3/2.0 | 1,176 (+10%) | 21mo | $111,000 | $94 | 59 |
| 458 Evelyndale Dr | 0.67mi | 3/2.0 | 1,127 (+6%) | 3mo | $285,000 | $253 | 56 |
| 86 Piedmont Dr | 0.67mi | 3/2.0 | 1,056 (-1%) | 15mo | $98,000 | $93 | 55 |
| 196 Main St | 0.71mi | 3/2.0 | 1,104 (+4%) | 10mo | $260,000 | $236 | 53 |
| 174 Humpsman Dr #150 | 0.47mi | 3/2.0 | 1,216 (+14%) | 6mo | $85,000 | $70 | 50 |
| 278 Evelyndale Dr | 0.65mi | 3/2.5 | 1,186 (+12%) | 18mo | $360,000 | $304 | 34 |
Match score weights: distance 35% · size 25% · config 20% · recency 20%. Top-matched comps best support the ARV.
Projected returns pro-forma
-3.0% appreciation · 2.03% rent growth · sell at horizon
- IRR
- 52.1%
- Equity multiple
- 3.25×
- Total profit
- $50,503
- Equity at exit
- $11,928
- IRR
- 57.0%
- Equity multiple
- 6.38×
- Total profit
- $120,497
- Equity at exit
- $6,917
Cash invested: $22,400 (down + closing). Projections, not guarantees.
Landlord ↔ Tenant lean methodology
- Overall (STATE)
- 70 Landlord-Friendly
- State Delaware
- 70 Landlord-Friendly · D+7
- County
- — inherits STATE
- City
- — inherits STATE
ZIP-level market 19901
- Rents YoY
- 2.0%
- Active inventory
- 184
- Price-to-rent
- 3.3×
Monthly cashflow live
- Estimated rent
- $1,999 medium interval (Pro) →
- Mortgage (P&I)
- −$420
- Tax est. 1.5%
- −$100 /mo · $1,200/yr
- Insurance
- −$33
- HOA
- −$0
- Vacancy / Maint / Mgmt
- −$420
- Net cashflow
- $1,026
Break-even live
UW: 25.0% down · 7.5% · 30yr · 1.5% tax · 5.0% vac · 8.0% maint · 8.0% mgmt
Financing live
Cash to close
- Down payment
- $20,000
- Closing costs
- $2,400
- Reserves months
- —
- Total cash needed
- —
Loan-product check · same deal, 3 products live
Conventional
25% down · 7.5% · 30yr
- Down + closing
- —
- Monthly P&I
- —
- Monthly cashflow
- —
- DSCR
- —
- Eligible?
- —
Personal DTI + credit; lowest rate.
DSCR
20% down · 8.5% · 30yr
- Down + closing
- —
- Monthly P&I
- —
- Monthly cashflow
- —
- DSCR
- —
- Eligible?
- —
No personal income docs; deal must DSCR.
Hard money
10% down · 12.0% · 12mo
- Down + closing
- —
- Monthly P&I
- —
- Monthly cashflow
- —
- DSCR
- —
- Eligible?
- —
Short-term bridge; refi at stabilization.
Listing history 7 events
-
2026-06-07statusdays on market $80,000 Pending 38 DOM
-
2026-06-02days on market $80,000 Active 33 DOM
-
2026-06-01days on market $80,000 Active 32 DOM
-
2026-05-31days on market $80,000 Active 31 DOM
-
2026-05-30days on market $80,000 Active 30 DOM
-
2026-05-01$80,000 Active
-
2026-04-29historical $80,000
ⓘ Source: listings_history table (triggers on properties + properties_extension) + one-shot
backfill from property_details.listing_events for pre-trigger history.
Climate risk First Street
- Flood 1/10 Low FEMA zone X (unshaded) · 0% chance over 30 yrs
- Wildfire 1/10 Low
- Heat 8/10 Severe 7 d/yr ≥102°F today · 16 d/yr by 30 yrs out
- Wind 6/10 Major 74% chance of damaging wind over 30 yrs
- Air quality 2/10 Low 1 unhealthy d/yr today · 2 by 30 yrs out
Nearby sold comps map
Loading sold comps map…
Walkable amenities ~0.75 mi
Loading nearby amenities…
Taxation est. · year 1
- Rental income
- $23,988
- − Mortgage interest
- −$4,481
- − Property taxes
- −$1,200
- − Insurance
- −$400
- − Repairs & maintenance
- −$1,919
- − Management
- −$1,919
- − Depreciation
- −$2,327
- Taxable income
- $11,742
- Est. tax owed @ 24.0%
- −$2,818
- After-tax cash flow
- $9,498/yr
For passive investors: Depreciation is non-cash, so a rental often shows a tax loss while cash-flowing — sheltering income. Rental losses are passive: they offset passive income freely, and up to $25,000/yr can offset ordinary (W-2) income if you actively participate and your MAGI is under $100k (phasing out to $0 by $150k); unused losses carry forward. On sale, claimed depreciation is recaptured at up to 25%, and gains may owe capital-gains tax (a 1031 exchange can defer both). Figures are a year-1 estimate at your 24.0% rate — not tax advice; consult a CPA.
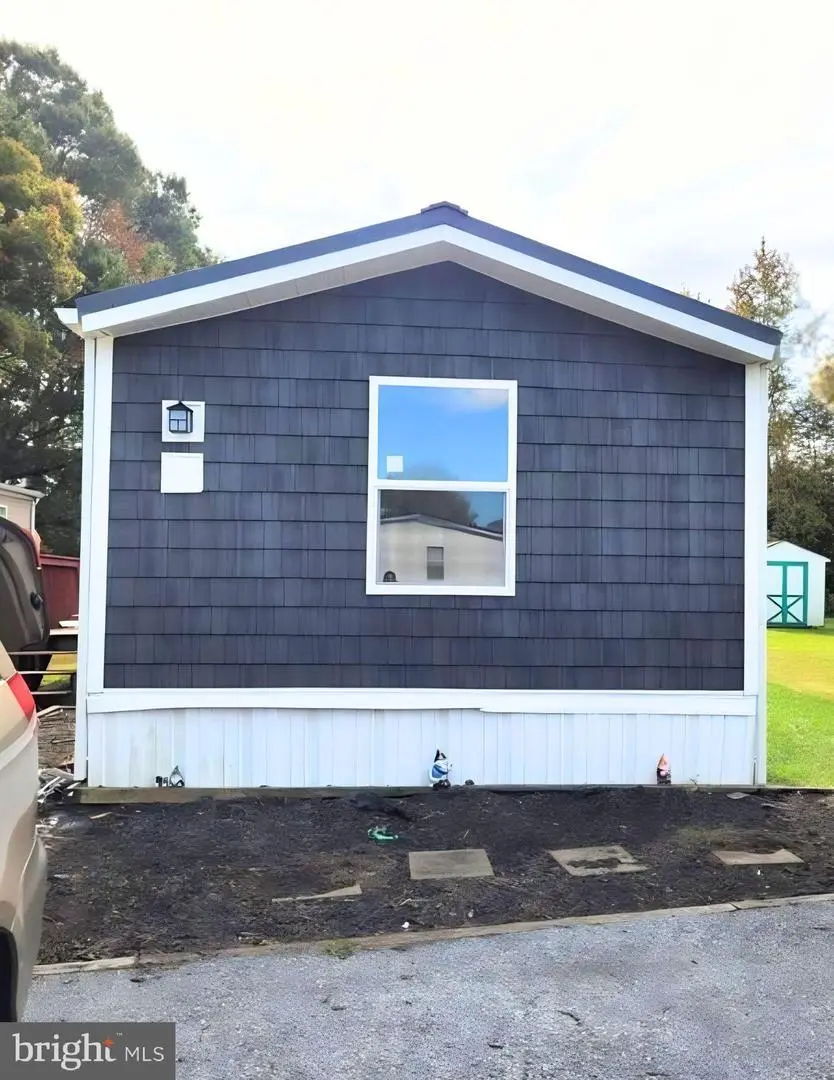
Condition & rehab AI · 3 photos
This mobile home requires significant repairs and updates to its exterior, interior, and systems, which will significantly increase its value.
Repairs flagged
- Major siding — Significant wear and tear
- Major roof — Siding condition suggests underlying issues
- Major flooring — No visible flooring, but overall condition suggests need for replacement
- Major interior walls/paint — No visible interior, but siding condition suggests need for repainting
- Major systems — No visible systems, but overall condition suggests need for updates
Value-add opportunities
- Both painting — Fresh paint can improve curb appeal and interior aesthetics
- Both roof replacement — A new roof will significantly increase the home's value and reduce maintenance costs
- Both flooring replacement — New flooring will enhance the home's appearance and increase its marketability
- Both interior painting — Fresh paint can improve the home's interior and make it more appealing to potential buyers
- Both system maintenance — Up-to-date systems will ensure the home is in good working condition and reduce future maintenance costs
Renovation cost estimate screening
| Repair item | Severity | Est. cost |
|---|---|---|
| siding · Significant wear and tear | Major | $15,000–50,000 |
| roof · Siding condition suggests underlying issues | Major | $15,000–50,000 |
| flooring · No visible flooring, but overall condition suggests need for replacement | Major | $15,000–50,000 |
| interior walls/paint · No visible interior, but siding condition suggests need for repainting | Major | $15,000–50,000 |
| systems · No visible systems, but overall condition suggests need for updates | Major | $15,000–50,000 |
| Total estimated repair cost · 5 items | $75,000–250,000 |
Value-add ROI direction
- Both painting — Fresh paint can improve curb appeal and interior aesthetics ↑
- Both roof replacement — A new roof will significantly increase the home's value and reduce maintenance costs ↑
- Both flooring replacement — New flooring will enhance the home's appearance and increase its marketability ↑
- Both interior painting — Fresh paint can improve the home's interior and make it more appealing to potential buyers ↑
- Both system maintenance — Up-to-date systems will ensure the home is in good working condition and reduce future maintenance costs ↑
ⓘ Cost ranges are severity-bucket heuristics (US national rule-of-thumb). Get contractor quotes + a written scope before underwriting a rehab budget.
Schools (NCES district)
- District
- Capital School District
- NCES district ID
- 1000190
- Math proficiency
- 14% ▼ -17.00%
- Reading proficiency
- 31% ▼ -12.00%
- Median HH income
- $48,499
- Composite
- 19.78/100
- National rank
- #8703
- State rank
- #24 of 26 in DE
Livability — Cheswold
- Score
- 62/100
- State rank
- #62
- US rank
- #16254
Category grades
Schools grade is shown separately in the Schools card above.
Census & demographics
- County
- Kent County · 82,184 people
- City population
- 176
- Metro
- Dover, DE
- Population (ZIP)
- 37,763
- Household income
- $66,388
- Rent vs Own
- Severe rent burden
- 1320.0
Population outlook (Kent County) Hauer SSP2
- Today (2025)
- 194,477 people
- By 2030
- 204,351 · +5.1%
- By 2040
- 222,135 · +14.2%
- By 2050
- 236,483 · +21.6%
- By 2075
- 266,327 · +36.9%
- By 2100
- 275,335 · +41.6%
Race, ethnicity, and origin ACS 2023
- Neighborhood character
- Diverse neighborhood (Simpson 0.68)
- Race & ethnicity
- White 44% Black 34% Hispanic / Latino 13% Two or more races 11% Asian 2%
- Hispanic origin (detail)
- Mexican 3% Puerto Rican 6%
- Common ancestry
- Romanian 2% Hispanic 1% Lithuanian 1%
- Foreign-born
- 7% · Canada, South Korea
- Languages at home
- 88% English-only · Spanish 7% French/Haitian/Cajun 1% Other Asian/Pacific 1%
Political lean MEDSL · Kent
- 2024 margin
- Toss-up / Even · D 50.2% · R 48.2% · Other 1.7%
- 2008→2024 swing
- -7.8pp toward R · 2008: 9.8pp · 2024: 2.0pp
- All cycles
- 2024: D+2.0 2020: D+4.1 2016: R+4.9 2012: D+4.9 2008: D+9.8
Not yet ingested
- Civics
- —
Market trends
- HPI YoY
- ▼ -113.29%
- Current HPI
- 199.5132
- Rent YoY
- ▲ 2.03%
- Metro
- Dover, DE
- State GDP YoY
- —
- F500 in state
- 0
Price history
+0.0% since first listed3 events — show timeline
- 2026-06-07 Pending — BRIGHT MLS
- 2026-05-01 Listed $80,000 BRIGHT MLS
- 2026-04-29 Coming Soon $80,000 BRIGHT MLS
Cash-flow waterfall
monthlySold comps — $/sqft
last 12 mo · ≤1 miLoading sold comps…