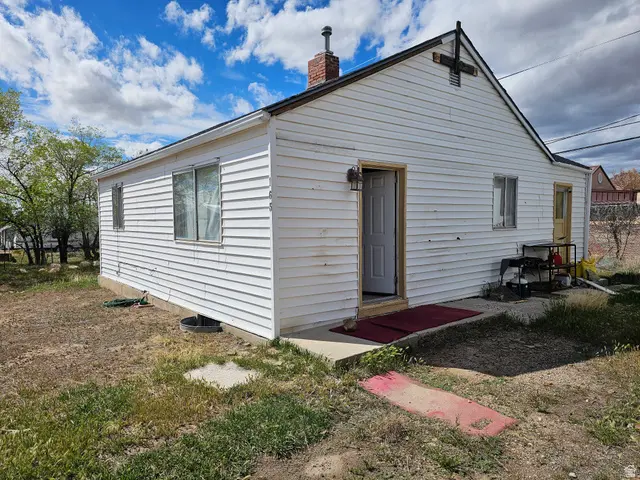
163 Carson Ave · East Carbon, UT
Flood risk 1/10 · Minimal
- FEMA flood zone
- X (unshaded)
- Chance of flooding over 30 yrs
- 0.0%
- Est. flood insurance / yr
- $473 – $860
Fire risk 7/10 · Major
- Est. fire insurance / yr
- $453 – $841
Heat risk 3/10 · Minor
- Hot days now (above threshold)
- —
- Hot days in 30 yrs
- —
Wind risk 1/10 · Minimal
- Chance of severe wind over 30 yrs
- —
Air-quality risk 2/10 · Minimal
- Unhealthy air days now
- 1 days/yr
- Unhealthy air days in 30 yrs
- 2 days/yr
Risk factors via First Street. Map © Google.
Why this score? — see what drove the B- grade
The composite is a weighted blend of 9 inputs, each scored 0–100. Each bar is that input's sub-score; the figure is the points it added to the 100-point composite (weight × sub-score).
- Cash flow +26.9/30.0
- DSCR +9.3/10.0
- ARV discount +7.5/15.0
- 1% rule +6.5/10.0
- Appreciation +5.0/10.0
- Schools +3.4/10.0
- Rent growth +2.5/5.0
- Livability +2.5/5.0
- Condition / age +2.5/5.0
$90,000
🖨 Deal sheet (PDF) 📄 Offer letter ✓ Due diligence
Listing remarks MLS
Handyman special with great potential in East Carbon! This 2-bedroom, 1-bath home is the perfect opportunity to finish remodeling and build instant equity. Major updates have already been started, including new plumbing and a new 220-amp electrical service. With a little TLC and your finishing touches, this property could truly shine. Ideal for investors or buyers looking to customize a home to their own style-all at an attractive price point. Don't miss your chance to turn this into a great investment or cozy residence!
Key facts
- 5,662 sq ft lot
- Built 1942
- Listed 63 days
Neighborhood map
What this means for you Summary
Snapshot
- This is a 2-bed/1.0-bath other listed at $90k.
Deal economics
- At list price, monthly cash flow is $248 ($3k/yr) — positive.
- The deal already cash-flows at list — no discount required.
- Meets the 1% rule at list price ($1k rent vs $90k).
- Recommended offer: $85k (6.0% below list) — sets the bar for market timing.
Location & tenants
- Location reads: area grade B — affects rentability + tenant quality, not the cash-flow math above.
- Carbon District (town): math 36% / reading 43% proficiency, ranked #53 of 80 in UT (top 66%) — families likely to look elsewhere, expect single-tenant / working-renter base with shorter leases.
- Zoned schools: Bruin Point School (math 24% / reading 24%, grade F, #474 of 585 statewide, top 83%, 97 students, 76% FRL); Mont Harmon Middle (math 36% / reading 44%, grade F, #72 of 138 statewide, top 53%, 601 students, 45% FRL); Carbon High (math 17% / reading 42%, grade F, #124 of 171 statewide, top 74%, 1,023 students, 34% FRL).
- Market conditions: 29 active listings in the ZIP; 196 units permitted in Carbon County in 2024 (168 in 5+ unit buildings).
Forward outlook
- In year one you build about $3k of equity ($622 loan paydown + $3k appreciation (3.0% local appreciation)).
- Carbon County population projected at -22% by 2050 — secular population decline; favor cash flow + early exit over multi-decade hold.
- At projected returns (3.0% appreciation + 3.0% rent growth), your $25k cash investment doubles in ~4 years — after that, you're playing with house money.
- By year 10, paydown + projected appreciation supports a ~$32k cash-out refi (75% LTV) — recoverable capital for the next deal without selling this one.
Negotiation context
- It's been on market 63 days — a 6% lower offer ($85k) is reasonable based on typical stale-listing flexibility.
- 2 sale attempts since 4y ago with the ask held roughly flat each time — persistent listings suggest the price (not the market) is what's stuck; bring a comps-based counter.
Risks & watch-outs
- Watch-outs: built in 1942 — expect roof / HVAC / electrical / plumbing capex.
- Climate carrying-cost: major wildfire risk — expect insurance premiums to compound above CPI over the hold.
Questions for the listing agent
- It's been on market 63 days. Have you received any prior offers? Is the seller open to a 6% concession, seller financing, or rate buy-down credit?
- Built in 1942 — when were the roof, HVAC, electrical panel, plumbing, and water heater last replaced?
- Why hasn't it sold? Are there any deal-killer items the seller is aware of (foundation, flood, title, zoning, code violations)?
- Is there a deadline driving the sale (1031 exchange, divorce, estate, relocation)? That informs how much negotiation room exists.
- What's the average days-on-market for RENTAL listings here right now (not sales)? A rising rental-DOM trend means longer vacancies and softer asking-rent achievability than the comps imply.
- What's the recent tenant-quality profile in this submarket — average credit score on applications, eviction rate, late-payment / NSF rate, and stable-employment percentage? A property-management company in the area should have these aggregated.
- How much new for-sale + rental construction is in the pipeline within 1–3 miles? Heavy new supply typically softens prices + rents 12–24 months out; constrained supply supports both.
Investment metrics
- 1% rule
- 1.15% ✓
- Cap rate
- 9.60%
- Cash-on-cash
- 11.82%
- DSCR
- 1.53
- GRM
- 7.2
CMA / ARV
No comps found within radius.
Projected returns pro-forma
3.0% appreciation · 3.0% rent growth · sell at horizon
- IRR
- 18.6%
- Equity multiple
- 2.06×
- Total profit
- $26,641
- Equity at exit
- $40,468
- IRR
- 19.9%
- Equity multiple
- 3.88×
- Total profit
- $72,666
- Equity at exit
- $62,366
Cash invested: $25,200 (down + closing). Projections, not guarantees.
Landlord ↔ Tenant lean methodology
- Overall (STATE)
- 86 Strongly Landlord-Friendly
- State Utah
- 86 Strongly Landlord-Friendly · R+15
- County
- — inherits STATE
- City
- — inherits STATE
ZIP-level market 84520
- Active inventory
- 29
- Price-to-rent
- 7.2×
Monthly cashflow live
- Estimated rent
- $1,036 medium interval (Pro) →
- Mortgage (P&I)
- −$472
- Tax from tax record
- −$60 /mo · $724/yr
- Insurance
- −$38
- HOA
- −$0
- Vacancy / Maint / Mgmt
- −$217
- Net cashflow
- $248
Break-even live
Sensitivity live
| Price | -10% $299 | -5% $274 | +0% $248 | +5% $223 | +10% $197 |
|---|---|---|---|---|---|
| Rent | -10% $167 | -5% $207 | +0% $248 | +5% $289 | +10% $330 |
| Rate | -1.0pp $294 | -0.5pp $271 | base $248 | +0.5pp $225 | +1.0pp $201 |
UW: 25.0% down · 7.5% · 30yr · 1.5% tax · 5.0% vac · 8.0% maint · 8.0% mgmt
Financing live
Cash to close
- Down payment
- $22,500
- Closing costs
- $2,700
- Reserves months
- —
- Total cash needed
- —
Loan-product check · same deal, 3 products live
Conventional
25% down · 7.5% · 30yr
- Down + closing
- —
- Monthly P&I
- —
- Monthly cashflow
- —
- DSCR
- —
- Eligible?
- —
Personal DTI + credit; lowest rate.
DSCR
20% down · 8.5% · 30yr
- Down + closing
- —
- Monthly P&I
- —
- Monthly cashflow
- —
- DSCR
- —
- Eligible?
- —
No personal income docs; deal must DSCR.
Hard money
10% down · 12.0% · 12mo
- Down + closing
- —
- Monthly P&I
- —
- Monthly cashflow
- —
- DSCR
- —
- Eligible?
- —
Short-term bridge; refi at stabilization.
Listing history 21 events
-
2026-06-18days on market $90,000 Active 63 DOM
-
2026-06-17days on market $90,000 Active 62 DOM
-
2026-06-16days on market $90,000 Active 61 DOM
-
2026-06-15days on market $90,000 Active 60 DOM
-
2026-06-14days on market $90,000 Active 58 DOM
-
2026-06-10days on market $90,000 Active 55 DOM
-
2026-06-09days on market $90,000 Active 54 DOM
-
2026-06-08days on market $90,000 Active 53 DOM
-
2026-06-07days on market $90,000 Active 52 DOM
-
2026-06-03days on market $90,000 Active 48 DOM
-
2026-06-02days on market $90,000 Active 47 DOM
-
2026-06-01days on market $90,000 Active 46 DOM
-
2026-05-31days on market $90,000 Active 45 DOM
-
2026-05-31days on market $90,000 Active 44 DOM
-
2026-04-16$90,000 Active 526-char remark
Show marketing remark (526 chars)
Handyman special with great potential in East Carbon! This 2-bedroom, 1-bath home is the perfect opportunity to finish remodeling and build instant equity. Major updates have already been started, including new plumbing and a new 220-amp electrical service. With a little TLC and your finishing touches, this property could truly shine. Ideal for investors or buyers looking to customize a home to their own style-all at an attractive price point. Don't miss your chance to turn this into a great investment or cozy residence!
-
2022-12-02soldstatus Closed 31-char remark
Show marketing remark (31 chars)
There are no remarks available.
-
2022-12-02soldstatus
Show marketing remark (31 chars)
There are no remarks available.
-
2022-11-08historical Backup 31-char remark
Show marketing remark (31 chars)
There are no remarks available.
-
2022-10-18price $110,000 31-char remark
Show marketing remark (31 chars)
There are no remarks available.
-
2022-09-07price $120,000 31-char remark
Show marketing remark (31 chars)
There are no remarks available.
-
2022-07-30$130,000 Active 31-char remark
Show marketing remark (31 chars)
There are no remarks available.
ⓘ Source: listings_history table (triggers on properties + properties_extension) + one-shot
backfill from property_details.listing_events for pre-trigger history.
Tax reassessment forecast UT · Resets to sale price
- Current annual tax
- $724 · $60/mo
- Projected year-2 tax
- $724 · $60/mo
- Expected delta
- $0/yr ($0/mo · 0.0%)
ⓘ Screening estimate from a state-policy table — verify with the county assessor before closing.
Climate risk First Street
- Flood 1/10 Low FEMA zone X (unshaded) · 0% chance over 30 yrs
- Wildfire 7/10 Severe
- Heat 3/10 Moderate
- Wind 1/10 Low
- Air quality 2/10 Low 1 unhealthy d/yr today · 2 by 30 yrs out
Nearby sold comps map
Loading sold comps map…
Walkable amenities ~0.75 mi
Loading nearby amenities…
Taxation est. · year 1
- Rental income
- $12,427
- − Mortgage interest
- −$5,041
- − Property taxes
- −$724
- − Insurance
- −$450
- − Repairs & maintenance
- −$994
- − Management
- −$994
- − Depreciation
- −$2,618
- Taxable income
- $1,605
- Est. tax owed @ 24.0%
- −$385
- After-tax cash flow
- $2,595/yr
For passive investors: Depreciation is non-cash, so a rental often shows a tax loss while cash-flowing — sheltering income. Rental losses are passive: they offset passive income freely, and up to $25,000/yr can offset ordinary (W-2) income if you actively participate and your MAGI is under $100k (phasing out to $0 by $150k); unused losses carry forward. On sale, claimed depreciation is recaptured at up to 25%, and gains may owe capital-gains tax (a 1031 exchange can defer both). Figures are a year-1 estimate at your 24.0% rate — not tax advice; consult a CPA.
Schools (NCES district)
- District
- Carbon District
- NCES district ID
- 4900150
- Math proficiency
- 36% ▼ -7.00%
- Reading proficiency
- 43% ▼ -4.00%
- Median HH income
- $45,189
- Composite
- 33.6/100
- National rank
- #5416
- State rank
- #53 of 80 in UT
Livability — East Carbon
No livability data for this city. (Only ~50 U.S. cities are tracked.)
Census & demographics
- Census place
- East Carbon, UT
- Population (ZIP)
- 991
Population outlook (Carbon County) Hauer SSP2
- Today (2025)
- 18,972 people
- By 2030
- 18,081 · -4.7%
- By 2040
- 16,260 · -14.3%
- By 2050
- 14,895 · -21.5%
- By 2075
- 13,123 · -30.8%
- By 2100
- 13,066 · -31.1%
Race, ethnicity, and origin ACS 2023
- Neighborhood character
- Predominantly White (81%)
- Race & ethnicity
- White 81% Hispanic / Latino 18% Two or more races 6% Native American 1%
- Hispanic origin (detail)
- Mexican 16%
- Common ancestry
- Italian 10% Lithuanian 3% Portuguese 2%
- Languages at home
- 99% English-only · Spanish 1%
Political lean MEDSL · Carbon
- 2024 margin
- Solid R (+44.4) · D 26.7% · R 71.1% · Other 2.1%
- 2008→2024 swing
- -36.4pp toward R · 2008: -8.0pp · 2024: -44.4pp
- All cycles
- 2024: R+44.4 2020: R+45.9 2016: R+44.6 2012: R+36.4 2008: R+8.0
Not yet ingested
- Civics
- —
Market trends
- HPI YoY
- —
- Current HPI
- —
- Rent YoY
- —
- Metro
- —
- State GDP YoY
- ▲ 3.54%
- F500 in state
- 2
Industry mix (Fortune 500 HQ in UT)
| Industry | F500 HQs | Revenue |
|---|---|---|
| Financial Services | 1 | $3B |
|
||
Price history
-30.8% since first listed7 events — show timeline
- 2026-04-16 Listed $90,000 WFRMLS
- 2022-12-02 Sold (Public Records) — Public Records
- 2022-12-02 Sold (MLS) — WFRMLS
- 2022-11-08 Contingent — WFRMLS
- 2022-10-18 Price Changed $110,000 WFRMLS
- 2022-09-07 Price Changed $120,000 WFRMLS
- 2022-07-30 Listed $130,000 WFRMLS
Property tax history
+8.4%/yrLatest (2025): $724 · +0.5% YoY. Source: county tax records.
Cash-flow waterfall
monthlySold comps — $/sqft
last 12 mo · ≤1 miLoading sold comps…