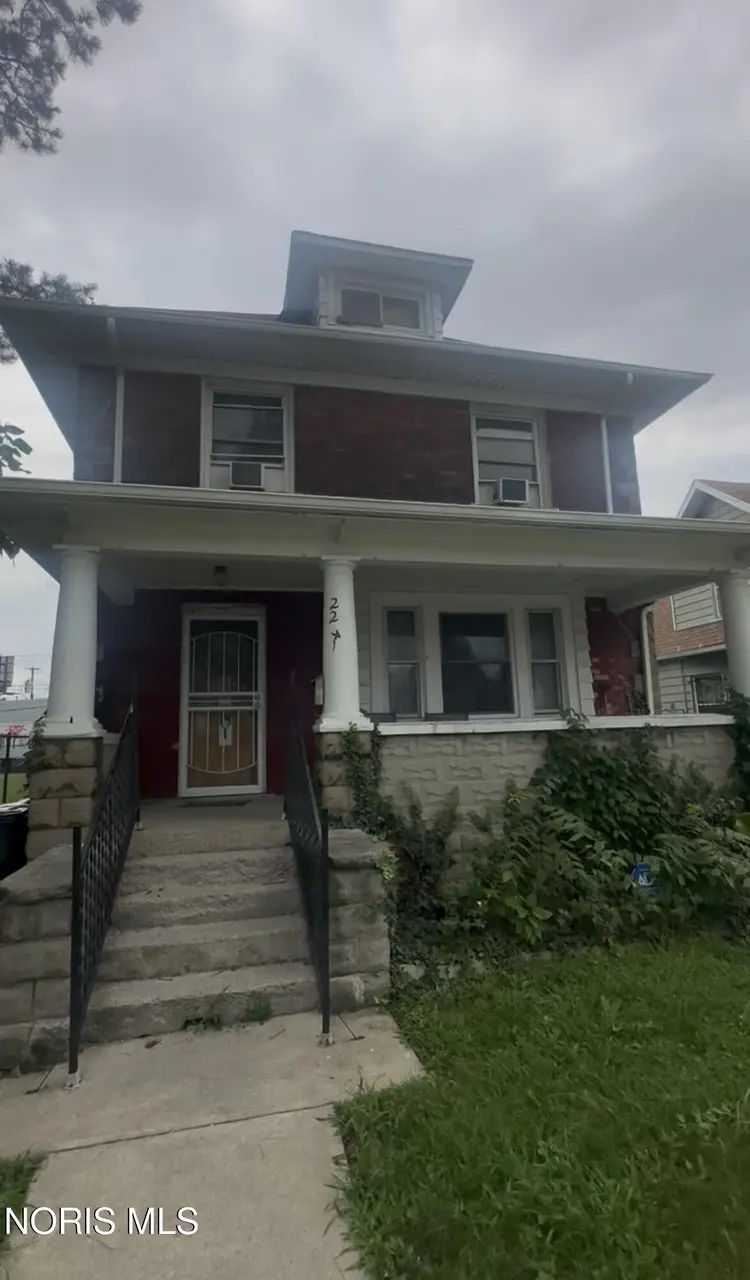
2241 Whitney Ave · Toledo, OH
Flood risk 1/10 · Minimal
- FEMA flood zone
- X (unshaded)
- Chance of flooding over 30 yrs
- 0.0%
- Est. flood insurance / yr
- $473 – $860
Fire risk 1/10 · Minimal
- Est. fire insurance / yr
- $713 – $1,323
Heat risk 3/10 · Minor
- Hot days now (above 101°F)
- 7 days/yr
- Hot days in 30 yrs
- 16 days/yr
Wind risk 2/10 · Minimal
- Chance of severe wind over 30 yrs
- —
Air-quality risk 2/10 · Minimal
- Unhealthy air days now
- 1 days/yr
- Unhealthy air days in 30 yrs
- 3 days/yr
Risk factors via First Street. Map © Google.
Why this score? — see what drove the B grade
The composite is a weighted blend of 9 inputs, each scored 0–100. Each bar is that input's sub-score; the figure is the points it added to the 100-point composite (weight × sub-score).
- Cash flow +30.0/30.0
- ARV discount +13.8/15.0
- 1% rule +10.0/10.0
- DSCR +10.0/10.0
- Livability +3.3/5.0
- Rent growth +3.1/5.0
- Condition / age +2.5/5.0
- Schools +1.6/10.0
- Appreciation +0.0/10.0
$85,000
🖨 Deal sheet (PDF) 📄 Offer letter ✓ Due diligence
Listing remarks
Solid single family, brick home with long term month to month tenant ($645/month). Features updated shower, new furnace 2022, new sewer line replacement to main 2025. Spacious yard for outdoor use located near Ottawa Park and the University of Toledo. Make it your home today or rent it out. Potential market rent up to $1,500 based on program guidelines.
Key facts
- Spacious yard
- New furnace
- Near ottawa park
Tags
Property features AI
Exterior
- Parking: On-street parking
- Utilities: Electricity connected; Natural gas connected; Public water; Public sewer; WiFi connected
- Home design: Single-family residence; Not attached to another unit; No common walls; Two and one half levels; 2 stories
- Construction: Asphalt and brick construction; Block foundation
- Exterior features: Shingle roof
Interior
- Kitchen: Kitchen on main level (15 x 13)
- Bedrooms: Bedroom 2 on upper level (12 x 10); Bedroom 3 on upper level (12 x 10); Bedroom 4 on upper level (12 x 10)
- Flooring: Other flooring
- Bathrooms: 1 full bathroom
- Heating & cooling: Forced air heating (natural gas); Window air conditioning units
- Interior features: Total of 7 rooms; Basement present; Other interior features
- Laundry & utility: Washer hookup; Gas dryer hookup
Neighborhood map
What this means for you Summary
Snapshot
- This is a 4-bed/1.0-bath single-family listed at $85k.
Deal economics
- At list price, monthly cash flow is $480 ($6k/yr) — positive.
- The deal already cash-flows at list — no discount required.
- Meets the 1% rule at list price ($1k rent vs $85k).
- Recommended offer: $84k (1.5% below list) — sets the bar for market timing.
- Cap rate 13.1% vs local median 7.7% in Toledo — top-decile yield for the area; either an underpriced asset or a hidden risk that comps aren't pricing in. Stress-test before assuming the spread holds.
Location & tenants
- Location reads 66/100 on livability (#645 in OH) — a middle-class / working-renter tenant base. Strengths: cost of living A+, housing A+, health & safety A+; Watch: amenities C-, crime F, commute F.
- Toledo City (urban): math 15% / reading 24% proficiency, ranked #634 of 656 in OH (top 97%) — low school quality limits family demand, transient renter base, plan for 1-2y turnover; 72% free/reduced lunch — lower-income household profile, screen leases tightly.
- Zoned schools: Glenwood Elementary School (math 2% / reading 12%, grade F, #1,527 of 1,584 statewide, top 98%, 300 students, 0% FRL); Jesup W. Scott High School (math 8% / reading 17%, grade F, #726 of 781 statewide, top 94%, 736 students, 0% FRL) — zoned schools average 0% FRL vs 72% district-wide (72 pts lower); this property's tenant base skews higher-income than the district average.
- Market conditions: Rents rising (+2.3%/yr); 95 active listings in the ZIP; 10 comparable units currently listed for rent nearby; rentals at typical pace (median 25d on market — plan ~3-4 weeks tenant-placement turnaround); 415 units permitted in Lucas County in 2024 (122 in 5+ unit buildings).
Forward outlook
- Local home prices are declining (-3.0%/yr); year-one equity from $588 of loan paydown is wiped out by about $3k of value loss. Plan a longer hold.
- Lucas County population projected at -16% by 2050 — secular population decline; favor cash flow + early exit over multi-decade hold.
- At projected returns (-3.0% appreciation + 2.3% rent growth), your $24k cash investment doubles in ~6 years — after that, you're playing with house money.
Negotiation context
- It's been on market 17 days — a 2% lower offer ($84k) is reasonable based on typical stale-listing flexibility.
- 5 sale attempts since 24y ago with the ask held roughly flat each time — persistent listings suggest the price (not the market) is what's stuck; bring a comps-based counter.
- Current owner paid $13k; list at $85k implies a 554% gain — meaningful room to come down on a strong offer.
Risks & watch-outs
- Watch-outs: built in 1899 — expect roof / HVAC / electrical / plumbing capex.
Questions for the listing agent
- Built in 1899 — when were the roof, HVAC, electrical panel, plumbing, and water heater last replaced?
- Is there a deadline driving the sale (1031 exchange, divorce, estate, relocation)? That informs how much negotiation room exists.
- Schools are D-rated, which usually means shorter tenancies and higher turnover. Who's the typical renter profile here, and what's been the actual vacancy rate?
- Crime grade is F in this area — have there been break-ins, vandalism, or insurance claims at this property in the last 3 years? What carrier currently insures it and at what premium?
- What's the average days-on-market for RENTAL listings here right now (not sales)? A rising rental-DOM trend means longer vacancies and softer asking-rent achievability than the comps imply.
- What's the recent tenant-quality profile in this submarket — average credit score on applications, eviction rate, late-payment / NSF rate, and stable-employment percentage? A property-management company in the area should have these aggregated.
- How much new for-sale + rental construction is in the pipeline within 1–3 miles? Heavy new supply typically softens prices + rents 12–24 months out; constrained supply supports both.
Investment metrics
- 1% rule
- 1.54% ✓
- Cap rate
- 13.07%
- Cash-on-cash
- 24.22%
- DSCR
- 2.08
- GRM
- 5.4
CMA / ARV
- ARV (on-the-fly)
- $98,820
- Comps found
- 12
Show comp detail 12 sales within ~0.75 mi
| Address | Dist | Beds/Ba | Sqft | Sold | Price | $/sf | Match |
|---|---|---|---|---|---|---|---|
| 842 Lincoln Ave | 0.57mi | 3/1.0 (-1) | 1,856 (+1%) | 3mo | $16,500 | $9 | 64 |
| 534 Acklin Ave | 0.64mi | 3/1.0 (-1) | 1,804 (-1%) | 11mo | $82,500 | $46 | 53 |
| 1322 Thatcher Dr | 0.68mi | 3/1.5 (-1) | 1,753 (-4%) | 6mo | $55,500 | $32 | 50 |
| 1061 Lincoln Ave | 0.54mi | 4/1.5 | 2,050 (+12%) | 11mo | $49,000 | $24 | 44 |
| 1104 Norwood Ave | 0.64mi | 3/2.0 (-1) | 1,764 (-4%) | 14mo | $115,000 | $65 | 43 |
| 2144 Hawthorne St | 0.63mi | 3/1.0 (-1) | 1,564 (-14%) | 3mo | $40,000 | $26 | 39 |
| 631 Islington St | 0.74mi | 4/1.0 | 1,957 (+7%) | 20mo | $62,000 | $32 | 37 |
| 1348 Palmetto Ave | 0.66mi | 3/1.0 (-1) | 1,609 (-12%) | 10mo | $95,000 | $59 | 35 |
| 645 Oakwood Ave | 0.74mi | 3/2.0 (-1) | 1,719 (-6%) | 17mo | $159,900 | $93 | 32 |
| 2717 Glenwood Ave | 0.74mi | 4/1.5 | 1,629 (-11%) | 21mo | $115,000 | $71 | 28 |
| 1333 Thatcher Dr | 0.67mi | 3/1.0 (-1) | 1,578 (-14%) | 16mo | $96,000 | $61 | 27 |
| 2615 Scottwood | 0.74mi | 4/1.0 | 2,094 (+14%) | 18mo | $112,100 | $54 | 26 |
Match score weights: distance 35% · size 25% · config 20% · recency 20%. Top-matched comps best support the ARV.
Projected returns pro-forma
-3.0% appreciation · 2.29% rent growth · sell at horizon
- IRR
- 16.7%
- Equity multiple
- 1.67×
- Total profit
- $15,891
- Equity at exit
- $12,674
- IRR
- 24.8%
- Equity multiple
- 3.08×
- Total profit
- $49,474
- Equity at exit
- $7,349
Cash invested: $23,800 (down + closing). Projections, not guarantees.
Landlord ↔ Tenant lean methodology
- Overall (STATE)
- 73 Landlord-Friendly
- State Ohio
- 73 Landlord-Friendly · R+6
- County
- — inherits STATE
- City
- — inherits STATE
ZIP-level market 43606
- Home prices YoY
- -15.5%
- Rents YoY
- 2.3%
- Active inventory
- 95
- Price-to-rent
- 5.4×
Monthly cashflow live
- Estimated rent
- $1,307 high interval (Pro) →
- Mortgage (P&I)
- −$446
- Tax from tax record
- −$71 /mo · $852/yr
- Insurance
- −$35
- HOA
- −$0
- Vacancy / Maint / Mgmt
- −$274
- Net cashflow
- $480
Break-even live
Sensitivity live
| Price | -10% $528 | -5% $504 | +0% $480 | +5% $456 | +10% $432 |
|---|---|---|---|---|---|
| Rent | -10% $377 | -5% $429 | +0% $480 | +5% $532 | +10% $584 |
| Rate | -1.0pp $523 | -0.5pp $502 | base $480 | +0.5pp $458 | +1.0pp $436 |
UW: 25.0% down · 7.5% · 30yr · 1.5% tax · 5.0% vac · 8.0% maint · 8.0% mgmt
Financing live
Cash to close
- Down payment
- $21,250
- Closing costs
- $2,550
- Reserves months
- —
- Total cash needed
- —
Loan-product check · same deal, 3 products live
Conventional
25% down · 7.5% · 30yr
- Down + closing
- —
- Monthly P&I
- —
- Monthly cashflow
- —
- DSCR
- —
- Eligible?
- —
Personal DTI + credit; lowest rate.
DSCR
20% down · 8.5% · 30yr
- Down + closing
- —
- Monthly P&I
- —
- Monthly cashflow
- —
- DSCR
- —
- Eligible?
- —
No personal income docs; deal must DSCR.
Hard money
10% down · 12.0% · 12mo
- Down + closing
- —
- Monthly P&I
- —
- Monthly cashflow
- —
- DSCR
- —
- Eligible?
- —
Short-term bridge; refi at stabilization.
Rent comps 10 comps
| Address | Beds | Baths | Sqft | Rent | $/sqft | DOM | Units | Dist |
|---|---|---|---|---|---|---|---|---|
| 1436 Palmetto Ave Toledo, OH | 3.0 | 1.0 | 1678 | $1,400 | $0.83 | 25d | 1 | 0.71mi |
| 1140 Palmwood Ave Toledo, OH | 3.0 | 1.0 | 1292 | $1,500 | $1.16 | 45d | 1 | 0.77mi |
| 2117 Clinton St Toledo, OH | 3.0 | 1.0 | 1256 | $1,115 | $0.89 | 45d | 1 | 0.82mi |
| 1122 Pinewood Ave Toledo, OH | 3.0 | 1.0 | 1559 | $1,150 | $0.74 | 15d | 1 | 0.95mi |
| 2907 Rockwood Pl Toledo, OH | 3.0 | 1.0 | 1494 | $1,100 | $0.74 | 15d | 1 | 0.97mi |
| 1573 Jermain Dr Toledo, OH | 3.0 | 1.0 | 1254 | $1,195 | $0.95 | 15d | 1 | 1.07mi |
| 119 Winthrop St Toledo, OH | 3.0 | 1.0 | 1734 | $1,350 | $0.78 | 25d | 1 | 1.11mi |
| 614 Cadillac Ct Toledo, OH | 3.0 | 1.0 | 1581 | $1,075 | $0.68 | 25d | 1 | 1.27mi |
| 610 Cadillac Ct Toledo, OH | 3.0 | 1.0 | 1409 | $1,050 | $0.75 | 25d | 1 | 1.27mi |
| 1420 Addington Rd Toledo, OH | 5.0 | 1.5 | 1728 | $1,500 | $0.87 | 45d | 1 | 1.39mi |
Listing history 12 events
-
2026-06-21days on market $85,000 Active 17 DOM
-
2026-06-18days on market $85,000 Active 14 DOM
-
2026-06-17days on market $85,000 Active 13 DOM
-
2026-06-16days on market $85,000 Active 12 DOM
-
2026-06-15days on market $85,000 Active 11 DOM
-
2026-06-14days on market $85,000 Active 9 DOM
-
2026-06-10days on market $85,000 Active 6 DOM
-
2026-06-09days on market $85,000 Active 5 DOM
-
2026-06-08days on market $85,000 Active 4 DOM
-
2026-06-07days on market $85,000 Active 3 DOM
-
2026-06-05remarks 355-char remark
-
2026-06-05$85,000 Active 1 DOM
ⓘ Source: listings_history table (triggers on properties + properties_extension) + one-shot
backfill from property_details.listing_events for pre-trigger history.
Tax reassessment forecast OH · Partial reset (capped growth)
- Current annual tax
- $852 · $71/mo
- Projected year-2 tax
- $1,089 · $91/mo
- Expected delta
- +$237/yr (+$20/mo · 27.8%)
ⓘ Screening estimate from a state-policy table — verify with the county assessor before closing.
Climate risk First Street
- Flood 1/10 Low FEMA zone X (unshaded) · 0% chance over 30 yrs
- Wildfire 1/10 Low
- Heat 3/10 Moderate 7 d/yr ≥101°F today · 16 d/yr by 30 yrs out
- Wind 2/10 Low
- Air quality 2/10 Low 1 unhealthy d/yr today · 3 by 30 yrs out
Nearby sold comps map
Loading sold comps map…
Walkable amenities ~0.75 mi
Loading nearby amenities…
Taxation est. · year 1
- Rental income
- $15,684
- − Mortgage interest
- −$4,761
- − Property taxes
- −$852
- − Insurance
- −$425
- − Repairs & maintenance
- −$1,255
- − Management
- −$1,255
- − Depreciation
- −$2,473
- Taxable income
- $4,663
- Est. tax owed @ 24.0%
- −$1,119
- After-tax cash flow
- $4,645/yr
For passive investors: Depreciation is non-cash, so a rental often shows a tax loss while cash-flowing — sheltering income. Rental losses are passive: they offset passive income freely, and up to $25,000/yr can offset ordinary (W-2) income if you actively participate and your MAGI is under $100k (phasing out to $0 by $150k); unused losses carry forward. On sale, claimed depreciation is recaptured at up to 25%, and gains may owe capital-gains tax (a 1031 exchange can defer both). Figures are a year-1 estimate at your 24.0% rate — not tax advice; consult a CPA.
Schools (NCES district)
- District
- Toledo City
- NCES district ID
- 3904490
- Math proficiency
- 15% ▼ -16.00%
- Reading proficiency
- 24% ▼ -13.00%
- Median HH income
- $32,137
- Composite
- 15.76/100
- National rank
- #9276
- State rank
- #634 of 656 in OH
Livability — Toledo
- Score
- 66/100
- State rank
- #645
- US rank
- #11442
Category grades
Schools grade is shown separately in the Schools card above.
Census & demographics
- Census place
- Toledo, OH
- County
- Lucas County · 380,724 people
- City population
- 280,811
- Metro
- Toledo, OH
- Population (ZIP)
- 24,898
- Household income
- $66,917
- Rent vs Own
- Severe rent burden
- 843.0
Population outlook (Lucas County) Hauer SSP2
- Today (2025)
- 420,751 people
- By 2030
- 410,187 · -2.5%
- By 2040
- 384,019 · -8.7%
- By 2050
- 355,125 · -15.6%
- By 2075
- 291,683 · -30.7%
- By 2100
- 233,670 · -44.5%
Race, ethnicity, and origin ACS 2023
- Neighborhood character
- Diverse neighborhood (Simpson 0.57)
- Race & ethnicity
- White 59% Black 29% Two or more races 7% Hispanic / Latino 4% Asian 3%
- Common ancestry
- Romanian 6% Italian 2% Lithuanian 1%
- Foreign-born
- 7% · Canada, China, South Korea
- Languages at home
- 92% English-only · Arabic 2% Other Indo-European 2% Spanish 1%
Political lean MEDSL · Lucas
- 2024 margin
- D (+12.6) · D 55.8% · R 43.2%
- 2008→2024 swing
- -18.9pp toward R · 2008: 31.4pp · 2024: 12.6pp
- All cycles
- 2024: D+12.6 2020: D+16.8 2016: D+17.4 2012: D+30.4 2008: D+31.4
Not yet ingested
- Civics
- —
Market trends
- HPI YoY
- ▼ -41.19%
- Current HPI
- 224.695
- Rent YoY
- ▲ 2.29%
- Metro
- Toledo, OH
- State GDP YoY
- ▲ 1.98%
- F500 in state
- 48
Industry mix (Fortune 500 HQ in OH)
| Industry | F500 HQs | Revenue |
|---|---|---|
| Insurance | 3 | $145B |
|
||
| Industrial Machinery | 3 | $49B |
|
||
| Financial Services | 3 | $24B |
|
||
| Consumer Goods | 2 | $93B |
|
||
| Aerospace / Defense | 2 | $47B |
|
||
| Utilities | 2 | $33B |
|
||
Price history
+327.1% since first listed13 events — show timeline
- 2026-06-04 Listed $85,000 NORIS
- 2026-01-30 Listing Removed — NORIS
- 2025-11-17 Listed $99,900 NORIS
- 2025-10-31 Listing Removed — NORIS
- 2025-10-14 Price Changed $13,000 NORIS
- 2025-10-04 Price Changed $109,000 NORIS
- 2025-09-10 Price Changed $115,900 NORIS
- 2025-07-22 Listed $119,900 NORIS
- 2025-07-22 Coming Soon — NORIS
- 2002-10-18 Sold (MLS) $13,000 NORIS
- 2002-10-09 Listing Removed — NORIS
- 2002-10-07 Listed $19,900 NORIS
- 2002-07-09 Listed $19,900 NORIS
Property tax history
-0.5%/yrLatest (2025): $852 · +1.7% YoY. Source: county tax records.
Cash-flow waterfall
monthlySold comps — $/sqft
last 12 mo · ≤1 miLoading sold comps…