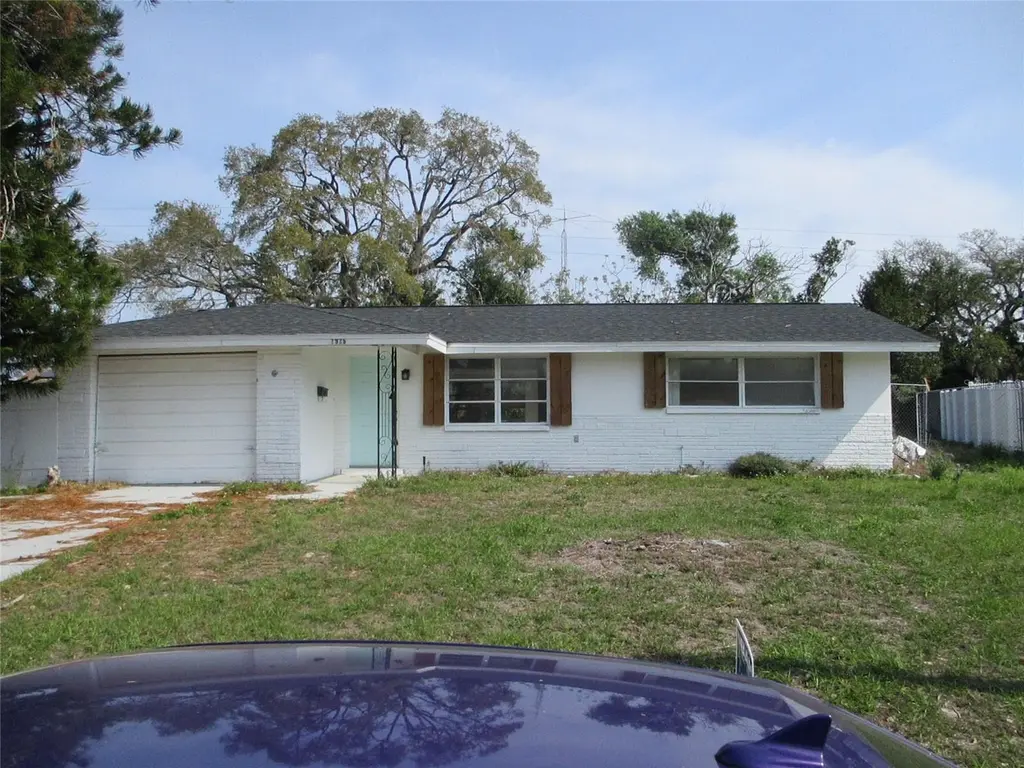
7925 Bracken Dr · Bayonet Point, FL
Flood risk 1/10 · Minimal
- FEMA flood zone
- X (unshaded)
- Chance of flooding over 30 yrs
- 0.0%
- Est. flood insurance / yr
- $507 – $1,088
Fire risk 3/10 · Minor
- Est. fire insurance / yr
- $947 – $1,759
Heat risk 10/10 · Severe
- Hot days now (above 109°F)
- 7 days/yr
- Hot days in 30 yrs
- 27 days/yr
Wind risk 10/10 · Severe
- Chance of severe wind over 30 yrs
- 99.0%
Air-quality risk 2/10 · Minimal
- Unhealthy air days now
- 1 days/yr
- Unhealthy air days in 30 yrs
- 3 days/yr
Risk factors via First Street. Map © Google.
Why this score? — see what drove the C- grade
The composite is a weighted blend of 9 inputs, each scored 0–100. Each bar is that input's sub-score; the figure is the points it added to the 100-point composite (weight × sub-score).
- Cash flow +16.4/30.0
- ARV discount +15.0/15.0
- DSCR +5.1/10.0
- 1% rule +4.6/10.0
- Schools +4.3/10.0
- Livability +3.5/5.0
- Rent growth +2.8/5.0
- Condition / age +2.5/5.0
- Appreciation +0.0/10.0
$175,000
🖨 Deal sheet 📄 Offer letter ✓ Due diligence
Listing remarks MLS
This fixer-upper with endless opportunities is perfect for first-time homebuyers or the savviest investor. It may need a complete overhaul but will surely rise in value that you can add to your portfolio. This is an AS-IS property. Don't miss out on this chance, schedule for a showing now.
Key facts
- 8,641 sq ft lot
- Garage
- Built 1970
Property features AI
Finance
- Other: Unfurnished
- Financial info: No lease restrictions indicated
- HOA & community: No association
Exterior
- Parking: Attached garage (1 car)
- Utilities: Public sewer; Cable available; Electricity available; No water source specified
- Home design: Single-family residence; 1 story; Multi/split levels; Faces west
- Construction: Block and stucco construction; Shingle roof; Slab foundation; Built on 0.2-acre lot
- Exterior features: Asphalt road access
Interior
- Kitchen: No appliances included
- Bedrooms: 3 bedrooms
- Flooring: Laminate flooring
- Bathrooms: 1 full bath; 1 half bath
- Heating & cooling: Electric heating; Central air conditioning
- Interior features: Other interior features
- Laundry & utility: Laundry: Other
Neighborhood map
What this means for you Summary
Snapshot
- This is a 2-bed/2.0-bath single-family listed at $175k.
Deal economics
- At list price, monthly cash flow is $98 ($1k/yr) — positive.
- The deal already cash-flows at list — no discount required.
- To meet the 1% rule (rent ≥ 1% of price), the offer needs to be $168k (3.9% below list).
- Recommended offer: $164k (6.0% below list) — sets the bar for market timing.
- Cap rate 7.0% vs local median 5.3% in Bayonet Point — top-decile yield for the area; either an underpriced asset or a hidden risk that comps aren't pricing in. Stress-test before assuming the spread holds.
Location & tenants
- Location reads 69/100 on livability (#485 in FL) — a middle-class / working-renter tenant base. Strengths: cost of living A+, housing A+, health & safety A+; Watch: crime D+, amenities D+, commute F.
- Pasco (suburban): math 50% / reading 52% proficiency, ranked #32 of 73 in FL (top 44%) — acceptable for families but not a draw, mixed tenant base, ~2y average lease.
- Zoned schools: Schrader Elementary School (math 38% / reading 35%, grade F, #1,656 of 2,144 statewide, top 78%, 601 students, 82% FRL); Fivay High School (math 20% / reading 28%, grade F, #529 of 667 statewide, top 80%, 1,610 students, 78% FRL) — zoned schools average 80% FRL vs 48% district-wide (32 pts higher); higher-poverty schools than district average — tighter screening recommended.
- Zoned-school proficiency averages 30% at this address vs 51% district-wide (-21 pts) — the specific schools serving this property underperform the Pasco average; the district grade overstates school quality for this exact location.
- Market conditions: Rents rising (+1.3%/yr); 577 active listings in the ZIP; 40 comparable units currently listed for rent nearby; rentals at typical pace (median 24d on market — plan ~3-4 weeks tenant-placement turnaround); 6,765 units permitted in Pasco County in 2024 (1,250 in 5+ unit buildings).
- This rent runs 43% of the median local income ($47k/yr) — at the standard rent-burdened threshold; future hikes will face affordability resistance.
Forward outlook
- Local home prices are declining (-3.0%/yr); year-one equity from $1k of loan paydown is wiped out by about $5k of value loss. Plan a longer hold.
- Pasco County population projected at +29% by 2050 — long-run rental-demand tailwind backs the buy-and-hold thesis.
Negotiation context
- It's been on market 67 days — a 6% lower offer ($164k) is reasonable based on typical stale-listing flexibility.
- 4 sale attempts since 4y ago with the ask held roughly flat each time — persistent listings suggest the price (not the market) is what's stuck; bring a comps-based counter.
- Current owner paid $137k; 28% above their basis — modest negotiation headroom, anchor on the comps not their cost.
Risks & watch-outs
- Climate carrying-cost: severe wind risk, 99% chance of damaging wind over 30y; extreme-heat days projected 7→27/yr by 2055 (HVAC capex compounding) — expect insurance premiums to compound above CPI over the hold.
Questions for the listing agent
- It's been on market 67 days. Have you received any prior offers? Is the seller open to a 6% concession, seller financing, or rate buy-down credit?
- Built in 1970 — when were the roof, HVAC, electrical panel, plumbing, and water heater last replaced?
- Why hasn't it sold? Are there any deal-killer items the seller is aware of (foundation, flood, title, zoning, code violations)?
- Is there a deadline driving the sale (1031 exchange, divorce, estate, relocation)? That informs how much negotiation room exists.
- Schools are F-rated, which usually means shorter tenancies and higher turnover. Who's the typical renter profile here, and what's been the actual vacancy rate?
- Crime grade is D in this area — have there been break-ins, vandalism, or insurance claims at this property in the last 3 years? What carrier currently insures it and at what premium?
- What's the average days-on-market for RENTAL listings here right now (not sales)? A rising rental-DOM trend means longer vacancies and softer asking-rent achievability than the comps imply.
- What's the recent tenant-quality profile in this submarket — average credit score on applications, eviction rate, late-payment / NSF rate, and stable-employment percentage? A property-management company in the area should have these aggregated.
- How much new for-sale + rental construction is in the pipeline within 1–3 miles? Heavy new supply typically softens prices + rents 12–24 months out; constrained supply supports both.
Investment metrics
- 1% rule
- 0.96% ✗
- Cap rate
- 6.96%
- Cash-on-cash
- 2.40%
- DSCR
- 1.11
- GRM
- 8.7
CMA / ARV
- ARV (on-the-fly)
- $223,669
- Comps found
- 12
Show comp detail 12 sales within ~0.75 mi
| Address | Dist | Beds/Ba | Sqft | Sold | Price | $/sf | Match |
|---|---|---|---|---|---|---|---|
| 10638 Oak Hill Dr | 0.18mi | 2/2.0 | 1,060 (+6%) | 1mo | $205,000 | $193 | 81 |
| 10528 Cymbid Dr | 0.28mi | 2/2.0 | 1,082 (+8%) | 2mo | $255,000 | $236 | 73 |
| 7521 Coventry Dr | 0.41mi | 2/1.0 | 1,032 (+3%) | 1mo | $230,000 | $223 | 71 |
| 10433 Laburnum Dr | 0.26mi | 2/2.0 | 1,118 (+12%) | 0mo | $275,000 | $246 | 68 |
| 10320 County Lake Dr | 0.48mi | 3/2.0 (+1) | 1,032 (+3%) | 0mo | $238,400 | $231 | 68 |
| 11230 Rhonda Ave | 0.55mi | 2/2.0 | 1,046 (+4%) | 1mo | $130,000 | $124 | 66 |
| 7835 Lotus Dr | 0.32mi | 3/2.0 (+1) | 1,087 (+8%) | 1mo | $269,900 | $248 | 65 |
| 11341 Winwood Pl | 0.66mi | 2/2.0 | 1,107 (+10%) | 1mo | $189,000 | $171 | 51 |
| 8018 Valmy Ln | 0.68mi | 2/2.0 | 1,106 (+10%) | 2mo | $237,500 | $215 | 49 |
| 7322 Orange Blossom Ave | 0.65mi | 2/2.0 | 1,135 (+13%) | 2mo | $245,000 | $216 | 46 |
| 10126 Hoop Ct | 0.68mi | 2/2.0 | 1,135 (+13%) | 1mo | $274,000 | $241 | 46 |
| 10609 Raffia Dr | 0.71mi | 2/1.0 | 900 (-10%) | 1mo | $185,000 | $206 | 45 |
Match score weights: distance 35% · size 25% · config 20% · recency 20%. Top-matched comps best support the ARV.
Projected returns pro-forma
-3.0% appreciation · 1.28% rent growth · sell at horizon
- IRR
- -14.5%
- Equity multiple
- 0.49×
- Total profit
- $-24,951
- Equity at exit
- $26,093
- IRR
- -8.9%
- Equity multiple
- 0.49×
- Total profit
- $-24,893
- Equity at exit
- $15,131
Cash invested: $49,000 (down + closing). Projections, not guarantees.
Landlord ↔ Tenant lean methodology
- Overall (STATE)
- 87 Strongly Landlord-Friendly
- State Florida
- 87 Strongly Landlord-Friendly · R+3
- County
- — inherits STATE
- City
- — inherits STATE
ZIP-level market 34668
- Home prices YoY
- -17.4%
- Rents YoY
- 1.3%
- Active inventory
- 577
- Price-to-rent
- 8.7×
Monthly cashflow live
- Estimated rent
- $1,682 high interval (Pro) →
- Mortgage (P&I)
- −$918
- Tax from tax record
- −$241 /mo · $2,887/yr
- Insurance
- −$73
- HOA
- −$0
- Vacancy / Maint / Mgmt
- −$353
- Net cashflow
- $98
Break-even live
UW: 25.0% down · 7.5% · 30yr · 1.5% tax · 5.0% vac · 8.0% maint · 8.0% mgmt
Financing live
Cash to close
- Down payment
- $43,750
- Closing costs
- $5,250
- Reserves months
- —
- Total cash needed
- —
Loan-product check · same deal, 3 products live
Conventional
25% down · 7.5% · 30yr
- Down + closing
- —
- Monthly P&I
- —
- Monthly cashflow
- —
- DSCR
- —
- Eligible?
- —
Personal DTI + credit; lowest rate.
DSCR
20% down · 8.5% · 30yr
- Down + closing
- —
- Monthly P&I
- —
- Monthly cashflow
- —
- DSCR
- —
- Eligible?
- —
No personal income docs; deal must DSCR.
Hard money
10% down · 12.0% · 12mo
- Down + closing
- —
- Monthly P&I
- —
- Monthly cashflow
- —
- DSCR
- —
- Eligible?
- —
Short-term bridge; refi at stabilization.
Rent comps 40 comps
| Address | Beds | Baths | Sqft | Rent | $/sqft | DOM | Units | Dist |
|---|---|---|---|---|---|---|---|---|
| 10802 Laburnum Dr Port Richey, FL | 2.0 | 2.0 | 1002 | $1,545 | $1.54 | 24d | 1 | 0.02mi |
| 10632 Laburnum Dr Port Richey, FL | 2.0 | 2.0 | 1193 | $1,583 | $1.33 | 24d | 1 | 0.05mi |
| 8024 Las Cruces Ct Port Richey, FL | 2.0 | 2.0 | 1371 | $1,900 | $1.39 | 24d | 1 | 0.10mi |
| 10816 Piccadilly Rd Port Richey, FL | 3.0 | 2.0 | 1408 | $1,550 | $1.10 | 12d | 1 | 0.11mi |
| 10801 Oldham Rd Port Richey, FL | 2.0 | 2.0 | 1182 | $1,500 | $1.27 | 2d | 1 | 0.14mi |
| 7808 Talisman Dr Port Richey, FL | 3.0 | 2.0 | 1063 | $2,100 | $1.98 | 24d | 1 | 0.20mi |
| 7839 Canna Dr Port Richey, FL | 2.0 | 2.0 | 1095 | $1,450 | $1.32 | 11d | 1 | 0.21mi |
| 10502 Laburnum Dr Port Richey, FL | 2.0 | 2.0 | 1002 | $1,545 | $1.54 | 24d | 1 | 0.23mi |
| 10629 Cymbid Dr Port Richey, FL | 3.0 | 2.0 | 1400 | $1,700 | $1.21 | 24d | 1 | 0.28mi |
| 10905 Kingsbridge Rd Port Richey, FL | 3.0 | 2.0 | 1176 | $1,566 | $1.33 | 5d | 1 | 0.36mi |
| 10303 Gardenia Ln Port Richey, FL | 3.0 | 2.0 | 1054 | $1,950 | $1.85 | 24d | 1 | 0.46mi |
| 11138 Yellowwood Ln Unit NA Port Richey, FL | 3.0 | 1.0 | 1000 | $1,800 | $1.80 | 24d | 1 | 0.46mi |
| 7705 Ilex Dr Port Richey, FL | 3.0 | 2.0 | 1349 | $2,000 | $1.48 | 24d | 1 | 0.48mi |
| 7438 Coventry Dr Port Richey, FL | 2.0 | 1.0 | 985 | $1,600 | $1.62 | 12d | 1 | 0.50mi |
| 10225 Gardenia Ln Port Richey, FL | 3.0 | 1.0 | 1042 | $1,495 | $1.43 | 15d | 1 | 0.51mi |
| 10803 Hyssop St Port Richey, FL | 3.0 | 1.0 | 1120 | $1,500 | $1.34 | 11d | 1 | 0.53mi |
| 8431 Duval Dr Port Richey, FL | 3.0 | 2.0 | 1408 | $1,731 | $1.23 | 5d | 1 | 0.55mi |
| 7416 Star Dust Dr Port Richey, FL | 3.0 | 2.0 | 1300 | $1,650 | $1.27 | 22d | 1 | 0.56mi |
| 10401 Oleander Dr Port Richey, FL | 2.0 | 1.0 | 887 | $1,250 | $1.41 | 24d | 1 | 0.58mi |
| 7540 Venice Dr Port Richey, FL | 3.0 | 2.0 | 1394 | $1,775 | $1.27 | 5d | 1 | 0.59mi |
| 11241 Yewtree Ave Port Richey, FL | 3.0 | 2.0 | 1306 | $1,950 | $1.49 | 24d | 1 | 0.61mi |
| 10331 Flagship Ave Port Richey, FL | 3.0 | 2.0 | 1400 | $2,000 | $1.43 | 24d | 1 | 0.61mi |
| 8161 Braddock Cir #1 Port Richey, FL | 2.0 | 2.0 | 1000 | $1,595 | $1.59 | 18d | 1 | 0.66mi |
| 8019 Portage Dr Port Richey, FL | 2.0 | 2.0 | 1078 | $2,000 | $1.86 | 17d | 1 | 0.70mi |
| 7531 Greybirch Ter Port Richey, FL | 3.0 | 2.0 | 1400 | $2,000 | $1.43 | 24d | 1 | 0.75mi |
| 11103 Harding Dr Unit 2 Port Richey, FL | 2.0 | 1.0 | 760 | $1,450 | $1.91 | 20d | 1 | 0.75mi |
| 7520 Hawthorn Dr Unit NA Port Richey, FL | 2.0 | 2.0 | 1303 | $1,900 | $1.46 | 24d | 1 | 0.77mi |
| 7520 Hawthorn Dr Port Richey, FL | 2.0 | 2.0 | 1303 | $1,800 | $1.38 | 24d | 1 | 0.77mi |
| 7804 Topay Ln Port Richey, FL | 3.0 | 2.0 | 1125 | $1,811 | $1.61 | 5d | 1 | 0.79mi |
| 7202 Palisade Dr Port Richey, FL | 2.0 | 2.0 | 1310 | $1,100 | $0.84 | 24d | 1 | 0.80mi |
| 7530 Judith Cres Port Richey, FL | 2.0 | 2.0 | 1446 | $1,695 | $1.17 | 20d | 1 | 0.83mi |
| 7530 Judith Cres Port Richey, FL | 2.0 | 2.0 | 1446 | $2,200 | $1.52 | 24d | 1 | 0.83mi |
| 7715 Sue Ellen Dr Port Richey, FL | 2.0 | 2.0 | 1080 | $1,495 | $1.38 | 3d | 1 | 0.87mi |
| 7213 Seward Dr Port Richey, FL | 2.0 | 1.0 | 700 | $1,500 | $2.14 | 24d | 1 | 0.88mi |
| 7608 Sue Ellen Dr Port Richey, FL | 3.0 | 2.0 | 1310 | $2,400 | $1.83 | 24d | 1 | 0.89mi |
| 9820 Rainbow Ln Port Richey, FL | 2.0 | 1.0 | 1300 | $1,325 | $1.02 | 15d | 1 | 0.89mi |
| 11610 Meadow Dr Port Richey, FL | 2.0 | 2.0 | 1128 | $1,570 | $1.39 | 12d | 1 | 0.90mi |
| 11611 Constance Dr Port Richey, FL | 3.0 | 1.0 | 984 | $1,540 | $1.57 | 11d | 1 | 0.90mi |
| 11611 Constance Dr Port Richey, FL | 3.0 | 1.0 | 984 | $1,540 | $1.57 | 24d | 1 | 0.90mi |
| 11031 Hassle Ave Port Richey, FL | 3.0 | 1.0 | 1006 | $1,595 | $1.59 | 24d | 1 | 0.90mi |
Listing history 17 events
-
2026-06-08statusdays on market $175,000 Pending 67 DOM
-
2026-06-07days on market $175,000 Active 66 DOM
-
2026-06-04days on market $175,000 Active 63 DOM
-
2026-06-03days on market $175,000 Active 62 DOM
-
2026-06-02days on market $175,000 Active 61 DOM
-
2026-06-01days on market $175,000 Active 60 DOM
-
2026-05-31days on market $175,000 Active 59 DOM
-
2026-05-20status Active
-
2026-05-19status Pending
-
2026-04-27status Active
-
2026-04-20status Pending
-
2026-03-25$175,000 Active
-
2022-10-24soldstatus $137,000 Closed 290-char remark
Show marketing remark (290 chars)
This fixer-upper with endless opportunities is perfect for first-time homebuyers or the savviest investor. It may need a complete overhaul but will surely rise in value that you can add to your portfolio. This is an AS-IS property. Don't miss out on this chance, schedule for a showing now.
-
2022-10-05status Pending 290-char remark
Show marketing remark (290 chars)
This fixer-upper with endless opportunities is perfect for first-time homebuyers or the savviest investor. It may need a complete overhaul but will surely rise in value that you can add to your portfolio. This is an AS-IS property. Don't miss out on this chance, schedule for a showing now.
-
2022-09-23price $150,000 290-char remark
Show marketing remark (290 chars)
This fixer-upper with endless opportunities is perfect for first-time homebuyers or the savviest investor. It may need a complete overhaul but will surely rise in value that you can add to your portfolio. This is an AS-IS property. Don't miss out on this chance, schedule for a showing now.
-
2022-09-06$165,000 Active 290-char remark
Show marketing remark (290 chars)
This fixer-upper with endless opportunities is perfect for first-time homebuyers or the savviest investor. It may need a complete overhaul but will surely rise in value that you can add to your portfolio. This is an AS-IS property. Don't miss out on this chance, schedule for a showing now.
-
2022-08-17soldstatus $110,000
ⓘ Source: listings_history table (triggers on properties + properties_extension) + one-shot
backfill from property_details.listing_events for pre-trigger history.
Tax reassessment forecast FL · Resets to sale price
- Current annual tax
- $2,887 · $241/mo
- Projected year-2 tax
- $2,887 · $241/mo
- Expected delta
- $0/yr ($0/mo · 0.0%)
ⓘ Screening estimate from a state-policy table — verify with the county assessor before closing.
Climate risk First Street
- Flood 1/10 Low FEMA zone X (unshaded) · 0% chance over 30 yrs
- Wildfire 3/10 Moderate
- Heat 10/10 Extreme 7 d/yr ≥109°F today · 27 d/yr by 30 yrs out
- Wind 10/10 Extreme 99% chance of damaging wind over 30 yrs
- Air quality 2/10 Low 1 unhealthy d/yr today · 3 by 30 yrs out
Nearby sold comps map
Loading sold comps map…
Walkable amenities ~0.75 mi
Loading nearby amenities…
Taxation est. · year 1
- Rental income
- $20,188
- − Mortgage interest
- −$9,803
- − Property taxes
- −$2,887
- − Insurance
- −$875
- − Repairs & maintenance
- −$1,615
- − Management
- −$1,615
- − Depreciation
- −$5,091
- Taxable loss
- −$1,698
- Est. tax savings @ 24.0%
- +$407
- After-tax cash flow
- $1,581/yr
For passive investors: Depreciation is non-cash, so a rental often shows a tax loss while cash-flowing — sheltering income. Rental losses are passive: they offset passive income freely, and up to $25,000/yr can offset ordinary (W-2) income if you actively participate and your MAGI is under $100k (phasing out to $0 by $150k); unused losses carry forward. On sale, claimed depreciation is recaptured at up to 25%, and gains may owe capital-gains tax (a 1031 exchange can defer both). Figures are a year-1 estimate at your 24.0% rate — not tax advice; consult a CPA.
Schools (NCES district)
- District
- Pasco
- NCES district ID
- 1201530
- Math proficiency
- 50% ▼ -10.00%
- Reading proficiency
- 52% ▼ -5.00%
- Median HH income
- $45,039
- Composite
- 43.14/100
- National rank
- #3074
- State rank
- #32 of 73 in FL
Livability — Bayonet Point
- Score
- 69/100
- State rank
- #485
- US rank
- #8934
Category grades
Schools grade is shown separately in the Schools card above.
Census & demographics
- Census place
- Bayonet Point, FL
- County
- Pasco County · 524,098 people
- Metro
- Tampa-St. Petersburg-Clearwater, FL
- Population (ZIP)
- 49,442
- Household income
- $47,401
- Rent vs Own
- Severe rent burden
- 2699.0
Population outlook (Pasco County) Hauer SSP2
- Today (2025)
- 570,045 people
- By 2030
- 605,844 · +6.3%
- By 2040
- 674,806 · +18.4%
- By 2050
- 736,022 · +29.1%
- By 2075
- 862,900 · +51.4%
- By 2100
- 906,364 · +59.0%
Race, ethnicity, and origin ACS 2023
- Neighborhood character
- Predominantly White (70%)
- Race & ethnicity
- White 70% Hispanic / Latino 23% Two or more races 14% Black 4%
- Hispanic origin (detail)
- Mexican 3% Puerto Rican 10% Cuban 5% Dominican 1%
- Common ancestry
- Romanian 3% Lithuanian 3% Slovak 2%
- Foreign-born
- 11% · Canada, Jamaica
- Languages at home
- 82% English-only · Spanish 14% Other Indo-European 1% French/Haitian/Cajun 1%
Political lean MEDSL · Pasco
- 2024 margin
- Strong R (+25.2) · D 36.9% · R 62.1% · Other 1.0%
- 2008→2024 swing
- -21.6pp toward R · 2008: -3.6pp · 2024: -25.2pp
- All cycles
- 2024: R+25.2 2020: R+20.1 2016: R+21.6 2012: R+6.7 2008: R+3.6
Not yet ingested
- Civics
- —
Market trends
- HPI YoY
- ▼ -75.64%
- Current HPI
- 359.7163
- Rent YoY
- ▲ 1.28%
- Metro
- Tampa-St. Petersburg-Clearwater, FL
- State GDP YoY
- ▲ 3.28%
- F500 in state
- 36
Industry mix (Fortune 500 HQ in FL)
| Industry | F500 HQs | Revenue |
|---|---|---|
| Industrial Technology | 2 | $29B |
|
||
| Insurance | 2 | $17B |
|
||
| Retail | 1 | $60B |
|
||
| Technology Distribution | 1 | $58B |
|
||
| Homebuilding | 1 | $35B |
|
||
| Technology Manufacturing | 1 | $35B |
|
||
Price history
+59.1% since first listed10 events — show timeline
- 2026-05-20 Relisted — Stellar MLS as Distributed by MLS Grid
- 2026-05-19 Pending — Stellar MLS as Distributed by MLS Grid
- 2026-04-27 Relisted — Stellar MLS as Distributed by MLS Grid
- 2026-04-20 Pending — Stellar MLS as Distributed by MLS Grid
- 2026-03-25 Listed $175,000 Stellar MLS as Distributed by MLS Grid
- 2022-10-24 Sold (MLS) $137,000 Stellar MLS as Distributed by MLS Grid
- 2022-10-05 Pending — Stellar MLS as Distributed by MLS Grid
- 2022-09-23 Price Changed $150,000 Stellar MLS as Distributed by MLS Grid
- 2022-09-06 Listed $165,000 Stellar MLS as Distributed by MLS Grid
- 2022-08-17 Sold (Public Records) $110,000 Public Records
Property tax history
+16.3%/yrLatest (2025): $2,887 · -4.0% YoY. Source: county tax records.
Cash-flow waterfall
monthlySold comps — $/sqft
last 12 mo · ≤1 miLoading sold comps…