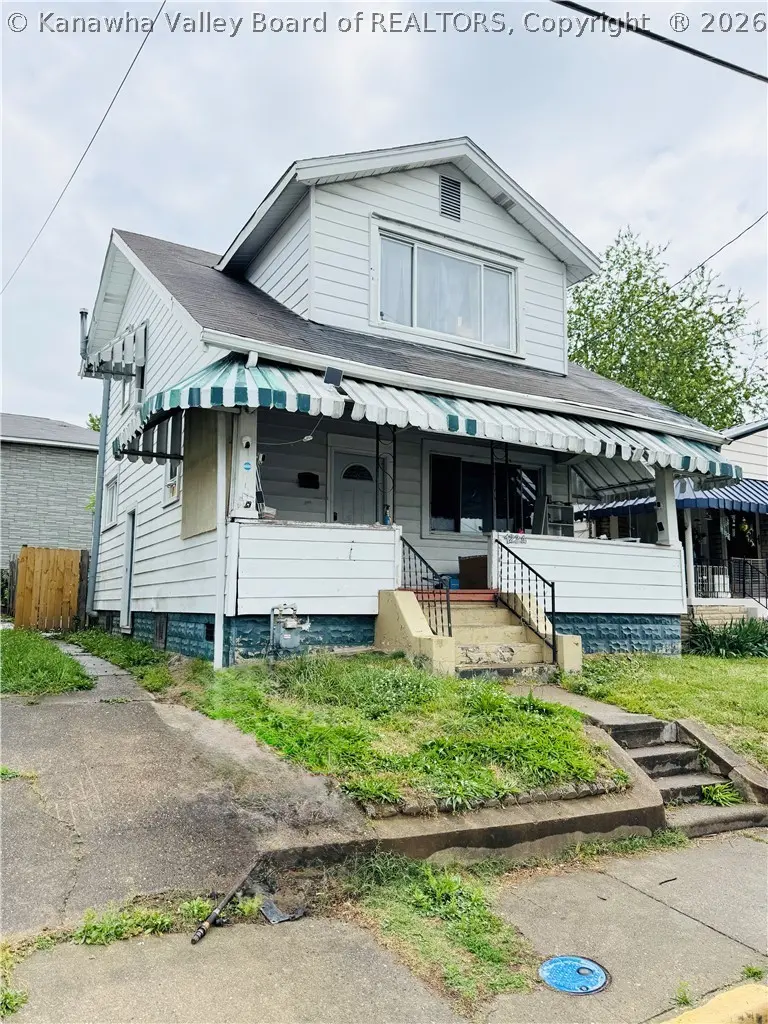
1234 Frame St · Charleston, WV
Flood risk 1/10 · Minimal
- FEMA flood zone
- X (unshaded)
- Chance of flooding over 30 yrs
- 0.0%
- Est. flood insurance / yr
- $473 – $860
Fire risk 4/10 · Minor
- Est. fire insurance / yr
- $787 – $1,461
Heat risk 5/10 · Moderate
- Hot days now (above 101°F)
- 7 days/yr
- Hot days in 30 yrs
- 20 days/yr
Wind risk 2/10 · Minimal
- Chance of severe wind over 30 yrs
- 1.0%
Air-quality risk 1/10 · Minimal
- Unhealthy air days now
- 0 days/yr
- Unhealthy air days in 30 yrs
- 0 days/yr
Risk factors via First Street. Map © Google.
Why this score? — see what drove the B+ grade
The composite is a weighted blend of 9 inputs, each scored 0–100. Each bar is that input's sub-score; the figure is the points it added to the 100-point composite (weight × sub-score).
- Cash flow +30.0/30.0
- ARV discount +14.9/15.0
- 1% rule +10.0/10.0
- DSCR +10.0/10.0
- Livability +4.2/5.0
- Schools +2.9/10.0
- Rent growth +2.5/5.0
- Condition / age +2.5/5.0
- Appreciation +0.0/10.0
$59,900
🖨 Deal sheet 📄 Offer letter ✓ Due diligence
Listing remarks
Investor Special! Tenant in place. Keep tenant or move in yourself. 3 beds, 1 1/2 baths. Great investment opportunity to start or expand your real estate portfolio. Tenant occupied please cash or rehab loans only.
Key facts
- 2,178 sq ft lot
- Built 1930
- Listed 47 days
Property features AI
Exterior
- Security: Smoke detector(s)
- Utilities: Public water; Public sewer
- Home design: Single-family residence; Two-story
- Construction: Aluminum siding; Block construction; Composition/shingle roof
- Exterior features: Front porch; Fenced yard
Interior
- Bedrooms: 6 total rooms (includes bedrooms and living spaces)
- Flooring: Carpet; Tile
- Bathrooms: 1 full bathroom; 1 half bathroom
- Heating & cooling: Forced air heating; Central air; Window unit(s)
- Interior features: Insulated windows; Full basement
Neighborhood map
What this means for you Summary
Snapshot
- This is a 3-bed/1.0-bath single-family listed at $60k.
Deal economics
- At list price, monthly cash flow is $632 ($8k/yr) — positive.
- The deal already cash-flows at list — no discount required.
- Meets the 1% rule at list price ($1k rent vs $60k).
- Recommended offer: $58k (3.0% below list) — sets the bar for market timing.
Location & tenants
- Location reads 85/100 on livability (#3 in WV, #524 nationally) — a professional / high-income tenant draw. Strengths: amenities A+, commute A+, cost of living A+; Watch: crime F.
- Kanawha County Schools (suburban): math 29% / reading 40% proficiency, ranked #17 of 55 in WV (top 31%) — families likely to look elsewhere, expect single-tenant / working-renter base with shorter leases.
- Zoned schools: Mary C. Snow West Side Elementary (math 12% / reading 12%, grade F, #375 of 377 statewide, top 99%, 353 students, 0% FRL); West Side Middle School (math 7% / reading 18%, grade F, #109 of 109 statewide, top 100%, 377 students, 0% FRL); Capital High School (math 22% / reading 52%, grade F, #32 of 110 statewide, top 34%, 1,086 students, 0% FRL) — zoned schools average 0% FRL vs 46% district-wide (46 pts lower); this property's tenant base skews higher-income than the district average.
- Zoned-school proficiency averages 20% at this address vs 34% district-wide (-14 pts) — the specific schools serving this property underperform the Kanawha County Schools average; the district grade overstates school quality for this exact location.
- Market conditions: 99 active listings in the ZIP; 103 units permitted in Kanawha County in 2024 (0 in 5+ unit buildings).
Forward outlook
- Local home prices are declining (-3.0%/yr); year-one equity from $414 of loan paydown is wiped out by about $2k of value loss. Plan a longer hold.
- Kanawha County population projected at -17% by 2050 — secular population decline; favor cash flow + early exit over multi-decade hold.
- At projected returns (-3.0% appreciation + 3.0% rent growth), your $17k cash investment doubles in ~3 years — after that, you're playing with house money.
Negotiation context
- It's been on market 47 days — a 3% lower offer ($58k) is reasonable based on typical stale-listing flexibility.
- 7 sale attempts since 11y ago; this cycle's ask has dropped $5k (8%) from the opening price — seller is motivated, your offer sets the floor, not the list.
- Current owner paid $50k; 20% above their basis — modest negotiation headroom, anchor on the comps not their cost.
Risks & watch-outs
- Watch-outs: built in 1930 — expect roof / HVAC / electrical / plumbing capex.
- Climate carrying-cost: extreme-heat days projected 7→20/yr by 2055 (HVAC capex compounding) — expect insurance premiums to compound above CPI over the hold.
Questions for the listing agent
- It's been on market 47 days. Have you received any prior offers? Is the seller open to a 3% concession, seller financing, or rate buy-down credit?
- Built in 1930 — when were the roof, HVAC, electrical panel, plumbing, and water heater last replaced?
- Is there a deadline driving the sale (1031 exchange, divorce, estate, relocation)? That informs how much negotiation room exists.
- Schools are A-rated — typically a magnet for longer-tenancy family renters. What's the average tenant stay here, and is there a school-zone premium baked into asking?
- Crime grade is F in this area — have there been break-ins, vandalism, or insurance claims at this property in the last 3 years? What carrier currently insures it and at what premium?
- What's the average days-on-market for RENTAL listings here right now (not sales)? A rising rental-DOM trend means longer vacancies and softer asking-rent achievability than the comps imply.
- What's the recent tenant-quality profile in this submarket — average credit score on applications, eviction rate, late-payment / NSF rate, and stable-employment percentage? A property-management company in the area should have these aggregated.
- How much new for-sale + rental construction is in the pipeline within 1–3 miles? Heavy new supply typically softens prices + rents 12–24 months out; constrained supply supports both.
Investment metrics
- 1% rule
- 2.23% ✓
- Cap rate
- 18.95%
- Cash-on-cash
- 45.22%
- DSCR
- 3.01
- GRM
- 3.7
CMA / ARV
- ARV (on-the-fly)
- $71,740
- Comps found
- 12
Show comp detail 12 sales within ~0.75 mi
| Address | Dist | Beds/Ba | Sqft | Sold | Price | $/sf | Match |
|---|---|---|---|---|---|---|---|
| 1205 Hunt Ave | 0.17mi | 3/1.0 | 1,065 (+1%) | 20mo | $72,000 | $68 | 74 |
| 802 Red Oak & 1105 Park Ave | 0.38mi | 2/1.0 (-1) | 1,055 (0%) | 8mo | $129,000 | $122 | 70 |
| 721 Garvin Ave | 0.22mi | 3/1.0 | 954 (-10%) | 5mo | $60,000 | $63 | 70 |
| 811 7th St | 0.43mi | 3/1.0 | 954 (-10%) | 3mo | $84,000 | $88 | 62 |
| 920 Hendrix Ave | 0.23mi | 2/1.0 (-1) | 980 (-7%) | 20mo | $26,500 | $27 | 56 |
| 1406 First Ave | 0.54mi | 2/1.0 (-1) | 1,020 (-3%) | 11mo | $104,900 | $103 | 55 |
| 1002 Grant St | 0.48mi | 2/1.0 (-1) | 1,128 (+7%) | 7mo | $130,000 | $115 | 55 |
| 112 Park Dr | 0.74mi | 3/1.0 | 1,120 (+6%) | 7mo | $19,500 | $17 | 50 |
| 1207 Park Ave | 0.38mi | 2/1.0 (-1) | 940 (-11%) | 13mo | $86,000 | $91 | 48 |
| 1504 Frame St | 0.26mi | 3/1.5 | 1,202 (+14%) | 18mo | $79,200 | $66 | 48 |
| 201 Russell St | 0.51mi | 2/1.0 (-1) | 976 (-8%) | 14mo | $37,000 | $38 | 47 |
| 916 Michael Ave | 0.49mi | 3/1.5 | 1,200 (+14%) | 12mo | $45,000 | $38 | 42 |
Match score weights: distance 35% · size 25% · config 20% · recency 20%. Top-matched comps best support the ARV.
Projected returns pro-forma
-3.0% appreciation · 3.0% rent growth · sell at horizon
- IRR
- 42.3%
- Equity multiple
- 2.82×
- Total profit
- $30,569
- Equity at exit
- $8,931
- IRR
- 48.5%
- Equity multiple
- 5.68×
- Total profit
- $78,547
- Equity at exit
- $5,179
Cash invested: $16,772 (down + closing). Projections, not guarantees.
Landlord ↔ Tenant lean methodology
- Overall (STATE)
- 83 Strongly Landlord-Friendly
- State West Virginia
- 83 Strongly Landlord-Friendly · R+22
- County
- — inherits STATE
- City
- — inherits STATE
ZIP-level market 25302
- Home prices YoY
- -21.8%
- Active inventory
- 99
- Price-to-rent
- 3.7×
Monthly cashflow live
- Estimated rent
- $1,333 medium interval (Pro) →
- Mortgage (P&I)
- −$314
- Tax from tax record
- −$82 /mo · $987/yr
- Insurance
- −$25
- HOA
- −$0
- Vacancy / Maint / Mgmt
- −$280
- Net cashflow
- $632
Break-even live
UW: 25.0% down · 7.5% · 30yr · 1.5% tax · 5.0% vac · 8.0% maint · 8.0% mgmt
Financing live
Cash to close
- Down payment
- $14,975
- Closing costs
- $1,797
- Reserves months
- —
- Total cash needed
- —
Loan-product check · same deal, 3 products live
Conventional
25% down · 7.5% · 30yr
- Down + closing
- —
- Monthly P&I
- —
- Monthly cashflow
- —
- DSCR
- —
- Eligible?
- —
Personal DTI + credit; lowest rate.
DSCR
20% down · 8.5% · 30yr
- Down + closing
- —
- Monthly P&I
- —
- Monthly cashflow
- —
- DSCR
- —
- Eligible?
- —
No personal income docs; deal must DSCR.
Hard money
10% down · 12.0% · 12mo
- Down + closing
- —
- Monthly P&I
- —
- Monthly cashflow
- —
- DSCR
- —
- Eligible?
- —
Short-term bridge; refi at stabilization.
Listing history 24 events
-
2026-06-19days on market $59,900 Active 47 DOM
-
2026-06-18days on market $59,900 Active 46 DOM
-
2026-06-17days on market $59,900 Active 45 DOM
-
2026-06-16days on market $59,900 Active 44 DOM
-
2026-06-15days on market $59,900 Active 43 DOM
-
2026-06-14days on market $59,900 Active 41 DOM
-
2026-06-12days on market $59,900 Active 40 DOM
-
2026-06-09days on market $59,900 Active 37 DOM
-
2026-06-08days on market $59,900 Active 36 DOM
-
2026-06-07days on market $59,900 Active 35 DOM
-
2026-06-05days on market $59,900 Active 32 DOM
-
2026-06-03days on market $59,900 Active 31 DOM
-
2026-06-02pricedays on market $59,900 Active 30 DOM
-
2026-06-01days on market $65,000 Active 29 DOM
-
2026-05-31days on market $65,000 Active 28 DOM
-
2026-05-30days on market $65,000 Active 27 DOM
-
2026-05-01$65,000 Active
-
2022-07-20soldstatus $50,000
-
2022-06-15$54,900
-
2020-05-22$45,000
-
2017-02-24$44,900
-
2016-09-09$44,900
-
2016-01-19$44,900
-
2015-01-28$29,900
ⓘ Source: listings_history table (triggers on properties + properties_extension) + one-shot
backfill from property_details.listing_events for pre-trigger history.
Tax reassessment forecast WV · Resets to sale price
- Current annual tax
- $987 · $82/mo
- Projected year-2 tax
- $987 · $82/mo
- Expected delta
- $0/yr ($0/mo · 0.0%)
ⓘ Screening estimate from a state-policy table — verify with the county assessor before closing.
Climate risk First Street
- Flood 1/10 Low FEMA zone X (unshaded) · 0% chance over 30 yrs
- Wildfire 4/10 Moderate
- Heat 5/10 Major 7 d/yr ≥101°F today · 20 d/yr by 30 yrs out
- Wind 2/10 Low 100% chance of damaging wind over 30 yrs
- Air quality 1/10 Low 0 unhealthy d/yr today · 0 by 30 yrs out
Nearby sold comps map
Loading sold comps map…
Walkable amenities ~0.75 mi
Loading nearby amenities…
Taxation est. · year 1
- Rental income
- $15,999
- − Mortgage interest
- −$3,355
- − Property taxes
- −$987
- − Insurance
- −$300
- − Repairs & maintenance
- −$1,280
- − Management
- −$1,280
- − Depreciation
- −$1,743
- Taxable income
- $7,055
- Est. tax owed @ 24.0%
- −$1,693
- After-tax cash flow
- $5,890/yr
For passive investors: Depreciation is non-cash, so a rental often shows a tax loss while cash-flowing — sheltering income. Rental losses are passive: they offset passive income freely, and up to $25,000/yr can offset ordinary (W-2) income if you actively participate and your MAGI is under $100k (phasing out to $0 by $150k); unused losses carry forward. On sale, claimed depreciation is recaptured at up to 25%, and gains may owe capital-gains tax (a 1031 exchange can defer both). Figures are a year-1 estimate at your 24.0% rate — not tax advice; consult a CPA.
Schools (NCES district)
- District
- Kanawha County Schools
- NCES district ID
- 5400600
- Math proficiency
- 29% ▼ -13.00%
- Reading proficiency
- 40% ▼ -7.00%
- Median HH income
- $44,329
- Composite
- 29.35/100
- National rank
- #6540
- State rank
- #17 of 55 in WV
Livability — Charleston
- Score
- 85/100
- State rank
- #3
- US rank
- #524
Category grades
Schools grade is shown separately in the Schools card above.
Census & demographics
- Census place
- Charleston, WV
- County
- Kanawha County · 33,502 people
- City population
- 33,502
- Metro
- Charleston, WV
- Population (ZIP)
- 13,204
- Household income
- $55,210
- Rent vs Own
- Severe rent burden
- 679.0
Population outlook (Kanawha County) Hauer SSP2
- Today (2025)
- 178,946 people
- By 2030
- 172,906 · -3.4%
- By 2040
- 159,874 · -10.7%
- By 2050
- 148,148 · -17.2%
- By 2075
- 123,257 · -31.1%
- By 2100
- 96,454 · -46.1%
Race, ethnicity, and origin ACS 2023
- Neighborhood character
- Predominantly White (75%)
- Race & ethnicity
- White 75% Black 14% Two or more races 8% Hispanic / Latino 3% Asian 1%
- Common ancestry
- Italian 2% Slovak 2% Iranian 1%
- Foreign-born
- 1% · South Korea
Political lean MEDSL · Kanawha
- 2024 margin
- R (+17.4) · D 40.2% · R 57.6% · Other 2.2%
- 2008→2024 swing
- -17.0pp toward R · 2008: -0.4pp · 2024: -17.4pp
- All cycles
- 2024: R+17.4 2020: R+14.7 2016: R+20.6 2012: R+11.9 2008: R+0.4
Not yet ingested
- Civics
- —
Market trends
- HPI YoY
- ▼ -44.83%
- Current HPI
- 160.7081
- Rent YoY
- —
- Metro
- Charleston, WV
- State GDP YoY
- —
- F500 in state
- 0
Price history
+117.4% since first listed8 events — show timeline
- 2026-05-01 Listed $65,000 KVBOR
- 2022-07-20 Sold (MLS) $50,000 KVBOR
- 2022-06-15 Listed $54,900 KVBOR
- 2020-05-22 Listed $45,000 KVBOR
- 2017-02-24 Listed $44,900 KVBOR
- 2016-09-09 Listed $44,900 KVBOR
- 2016-01-19 Listed $44,900 KVBOR
- 2015-01-28 Listed $29,900 KVBOR
Property tax history
+8.1%/yrLatest (2025): $987 · +0.0% YoY. Source: county tax records.
Cash-flow waterfall
monthlySold comps — $/sqft
last 12 mo · ≤1 miLoading sold comps…