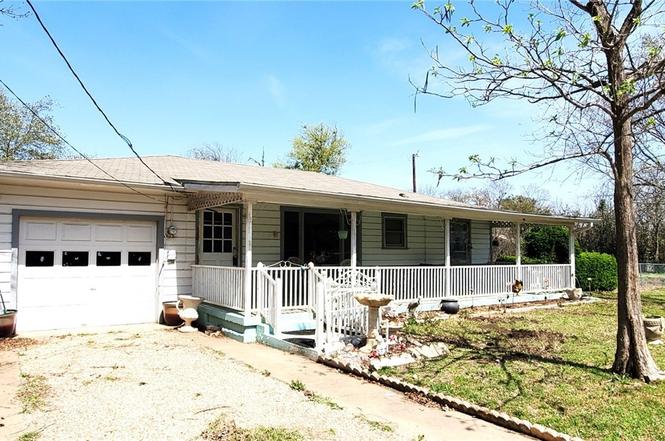
112 College Ave · Oglesby, TX
Flood risk 1/10 · Minimal
- FEMA flood zone
- X (unshaded)
- Chance of flooding over 30 yrs
- 0.0%
- Est. flood insurance / yr
- $507 – $1,088
Fire risk 5/10 · Moderate
- Est. fire insurance / yr
- $1,222 – $2,270
Heat risk 7/10 · Major
- Hot days now (above 109°F)
- 6 days/yr
- Hot days in 30 yrs
- 19 days/yr
Wind risk 6/10 · Moderate
- Chance of severe wind over 30 yrs
- 62.0%
Air-quality risk 1/10 · Minimal
- Unhealthy air days now
- 0 days/yr
- Unhealthy air days in 30 yrs
- 0 days/yr
Risk factors via First Street. Map © Google.
Why this score? — see what drove the C- grade
The composite is a weighted blend of 9 inputs, each scored 0–100. Each bar is that input's sub-score; the figure is the points it added to the 100-point composite (weight × sub-score).
- ARV discount +15.0/15.0
- Cash flow +11.1/30.0
- Appreciation +6.9/10.0
- 1% rule +3.2/10.0
- DSCR +3.2/10.0
- Livability +3.0/5.0
- Schools +2.9/10.0
- Rent growth +2.5/5.0
- Condition / age +2.5/5.0
$119,500
🖨 Deal sheet (PDF) 📄 Offer letter ✓ Due diligence
Listing remarks
Calling all INVESTORS- This property has an extra lot w/ electric, water & gas access; check with city ordinances/restrictions if you want to move in a mobile/manufactured/tiny home for inlaws or build a home. Curb appeal abounds for this lovely little cottage w/ a great 9 x 35 concrete front porch. 2/1/1 home, 4 sheds, completely fenced AND an extra . 33 AC adjacent lot is included in this sale! It's messy inside right now but look beyond that & the sticky paper on the refrigerator, walls & other areas! Picture how you will decorate & what kind of dream home you can turn this affordable gem in to! Spacious LV, ornate fans and crown molding. Home has hardwood floors,
Key facts
- 0.49 acre lot
- Garage
- Built 1945
Neighborhood map
What this means for you Summary
Snapshot
- This is a 2-bed/1.0-bath townhouse listed at $120k.
Deal economics
- At list price, monthly cash flow is $-48 ($-572/yr) — negative.
- To cash-flow at today's rent, offer at most $113k (5.8% below list).
- To meet the 1% rule (rent ≥ 1% of price), the offer needs to be $98k (17.6% below list).
- Recommended offer: $98k (17.6% below list) — sets the bar for 1% rule.
Location & tenants
- Location reads 60/100 on livability (#1,057 in TX) — a middle-class / working-renter tenant base. Strengths: cost of living A+, housing A+; Watch: schools F, crime F, amenities F.
- Oglesby ISD (rural): math 30% / reading 30% proficiency, ranked #992 of 1,141 in TX (top 87%) — families likely to look elsewhere, expect single-tenant / working-renter base with shorter leases.
- Market conditions: 40 active listings in the ZIP; 386 units permitted in Coryell County in 2024 (0 in 5+ unit buildings).
Forward outlook
- In year one you build about $5k of equity ($826 loan paydown + $4k appreciation (3.7% local appreciation)).
- At projected returns (3.7% appreciation + 3.0% rent growth), your $33k cash investment doubles in ~6 years — after that, you're playing with house money.
- By year 7, paydown + projected appreciation supports a ~$34k cash-out refi (75% LTV) — recoverable capital for the next deal without selling this one.
Negotiation context
- It's been on market 360 days — a 12% lower offer ($105k) is reasonable based on typical stale-listing flexibility.
- 8 sale attempts; this cycle's ask has dropped $16k (11%) from the opening price — seller is motivated, your offer sets the floor, not the list.
Risks & watch-outs
- Watch-outs: built in 1945 — expect roof / HVAC / electrical / plumbing capex.
- Climate carrying-cost: major wind risk, 62% chance of damaging wind over 30y; moderate wildfire risk; extreme-heat days projected 6→19/yr by 2055 (HVAC capex compounding) — expect insurance premiums to compound above CPI over the hold.
Questions for the listing agent
- What do current leases actually rent for vs. the listed asking? Can we see a recent rent roll and the last 12 months of T-12 income?
- It's been on market 360 days. Have you received any prior offers? Is the seller open to a 18% concession, seller financing, or rate buy-down credit?
- Built in 1945 — when were the roof, HVAC, electrical panel, plumbing, and water heater last replaced?
- Why hasn't it sold? Are there any deal-killer items the seller is aware of (foundation, flood, title, zoning, code violations)?
- Is there a deadline driving the sale (1031 exchange, divorce, estate, relocation)? That informs how much negotiation room exists.
- Schools are F-rated, which usually means shorter tenancies and higher turnover. Who's the typical renter profile here, and what's been the actual vacancy rate?
- Crime grade is F in this area — have there been break-ins, vandalism, or insurance claims at this property in the last 3 years? What carrier currently insures it and at what premium?
- What's the average days-on-market for RENTAL listings here right now (not sales)? A rising rental-DOM trend means longer vacancies and softer asking-rent achievability than the comps imply.
- What's the recent tenant-quality profile in this submarket — average credit score on applications, eviction rate, late-payment / NSF rate, and stable-employment percentage? A property-management company in the area should have these aggregated.
- How much new for-sale + rental construction is in the pipeline within 1–3 miles? Heavy new supply typically softens prices + rents 12–24 months out; constrained supply supports both.
Investment metrics
- 1% rule
- 0.82% ✗
- Cap rate
- 5.81%
- Cash-on-cash
- -1.71%
- DSCR
- 0.92
- GRM
- 10.1
CMA / ARV
- ARV (median comp)
- $216,317
- List price
- $119,500
- Delta
- -44.76%
- Verdict
- UNDERPRICED
- Comps
- 2 within 1.0 mi
Projected returns pro-forma
3.74% appreciation · 3.0% rent growth · sell at horizon
- IRR
- 8.0%
- Equity multiple
- 1.48×
- Total profit
- $16,109
- Equity at exit
- $58,772
- IRR
- 10.3%
- Equity multiple
- 2.67×
- Total profit
- $55,964
- Equity at exit
- $94,705
Cash invested: $33,460 (down + closing). Projections, not guarantees.
Landlord ↔ Tenant lean methodology
- Overall (STATE)
- 87 Strongly Landlord-Friendly
- State Texas
- 87 Strongly Landlord-Friendly · R+5
- County
- — inherits STATE
- City
- — inherits STATE
ZIP-level market 76561
- Home prices YoY
- 1.7%
- Active inventory
- 40
- Price-to-rent
- 10.1×
Monthly cashflow live
- Estimated rent
- $985 medium interval (Pro) →
- Mortgage (P&I)
- −$627
- Tax est. 1.5%
- −$149 /mo · $1,792/yr
- Insurance
- −$50
- HOA
- −$0
- Vacancy / Maint / Mgmt
- −$207
- Net cashflow
- $-48
Break-even live
Sensitivity live
| Price | -10% $35 | -5% $-6 | +0% $-48 | +5% $-89 | +10% $-130 |
|---|---|---|---|---|---|
| Rent | -10% $-126 | -5% $-87 | +0% $-48 | +5% $-9 | +10% $30 |
| Rate | -1.0pp $12 | -0.5pp $-17 | base $-48 | +0.5pp $-79 | +1.0pp $-110 |
UW: 25.0% down · 7.5% · 30yr · 1.5% tax · 5.0% vac · 8.0% maint · 8.0% mgmt
Financing live
Cash to close
- Down payment
- $29,875
- Closing costs
- $3,585
- Reserves months
- —
- Total cash needed
- —
Loan-product check · same deal, 3 products live
Conventional
25% down · 7.5% · 30yr
- Down + closing
- —
- Monthly P&I
- —
- Monthly cashflow
- —
- DSCR
- —
- Eligible?
- —
Personal DTI + credit; lowest rate.
DSCR
20% down · 8.5% · 30yr
- Down + closing
- —
- Monthly P&I
- —
- Monthly cashflow
- —
- DSCR
- —
- Eligible?
- —
No personal income docs; deal must DSCR.
Hard money
10% down · 12.0% · 12mo
- Down + closing
- —
- Monthly P&I
- —
- Monthly cashflow
- —
- DSCR
- —
- Eligible?
- —
Short-term bridge; refi at stabilization.
Listing history 25 events
-
2026-06-21days on market $119,500 Active 360 DOM
-
2026-06-18days on market $119,500 Active 357 DOM
-
2026-06-17days on market $119,500 Active 356 DOM
-
2026-06-16days on market $119,500 Active 355 DOM
-
2026-06-15days on market $119,500 Active 354 DOM
-
2026-06-14days on market $119,500 Active 352 DOM
-
2026-06-10days on market $119,500 Active 349 DOM
-
2026-06-09days on market $119,500 Active 348 DOM
-
2026-06-08days on market $119,500 Active 347 DOM
-
2026-06-07statusdays on market $119,500 Active 346 DOM
-
2026-04-20status Active
-
2026-03-14status Active
-
2026-02-05status Active
-
2025-07-29price
-
2025-07-29price $119,500
-
2025-05-26price $125,000
-
2025-05-10price $125,000
-
2025-05-10price
-
2025-04-07status Active
-
2025-03-12status Active
-
2025-03-12historical
-
2025-03-07$135,000 Active
-
2025-03-07historical
-
2025-03-07$135,000 Active
-
2025-03-07Active
ⓘ Source: listings_history table (triggers on properties + properties_extension) + one-shot
backfill from property_details.listing_events for pre-trigger history.
Climate risk First Street
- Flood 1/10 Low FEMA zone X (unshaded) · 0% chance over 30 yrs
- Wildfire 5/10 Major
- Heat 7/10 Severe 6 d/yr ≥109°F today · 19 d/yr by 30 yrs out
- Wind 6/10 Major 62% chance of damaging wind over 30 yrs
- Air quality 1/10 Low 0 unhealthy d/yr today · 0 by 30 yrs out
Nearby sold comps map
Loading sold comps map…
Walkable amenities ~0.75 mi
Loading nearby amenities…
Taxation est. · year 1
- Rental income
- $11,820
- − Mortgage interest
- −$6,694
- − Property taxes
- −$1,792
- − Insurance
- −$598
- − Repairs & maintenance
- −$946
- − Management
- −$946
- − Depreciation
- −$3,476
- Taxable loss
- −$2,632
- Est. tax savings @ 24.0%
- +$632
- After-tax cash flow
- $59/yr
For passive investors: Depreciation is non-cash, so a rental often shows a tax loss while cash-flowing — sheltering income. Rental losses are passive: they offset passive income freely, and up to $25,000/yr can offset ordinary (W-2) income if you actively participate and your MAGI is under $100k (phasing out to $0 by $150k); unused losses carry forward. On sale, claimed depreciation is recaptured at up to 25%, and gains may owe capital-gains tax (a 1031 exchange can defer both). Figures are a year-1 estimate at your 24.0% rate — not tax advice; consult a CPA.
Schools (NCES district)
- District
- Oglesby ISD
- NCES district ID
- 4833420
- Math proficiency
- 30% ▲ 10.00%
- Reading proficiency
- 30% ▼ -5.00%
- Median HH income
- $50,236
- Composite
- 29.06/100
- National rank
- #11906
- State rank
- #992 of 1141 in TX
Livability — Oglesby
- Score
- 60/100
- State rank
- #1057
- US rank
- #18753
Category grades
Schools grade is shown separately in the Schools card above.
Census & demographics
- Census place
- Oglesby, TX
- Population (ZIP)
- 1,070
Population outlook (Coryell County) Hauer SSP2
- Today (2025)
- 75,485 people
- By 2030
- 75,627 · +0.2%
- By 2040
- 74,898 · -0.8%
- By 2050
- 74,221 · -1.7%
- By 2075
- 72,688 · -3.7%
- By 2100
- 66,862 · -11.4%
Race, ethnicity, and origin ACS 2023
- Neighborhood character
- Predominantly White (74%)
- Race & ethnicity
- White 74% Hispanic / Latino 19% Two or more races 10%
- Hispanic origin (detail)
- Mexican 18%
- Common ancestry
- Italian 6% Serbian 1% Iranian 1%
- Foreign-born
- 5% · Canada
- Languages at home
- 90% English-only · Spanish 8% German/W. Germanic 2%
Political lean MEDSL · Coryell
- 2024 margin
- Solid R (+40.7) · D 29.1% · R 69.8% · Other 1.1%
- 2008→2024 swing
- -13.8pp toward R · 2008: -26.9pp · 2024: -40.7pp
- All cycles
- 2024: R+40.7 2020: R+33.5 2016: R+39.5 2012: R+36.6 2008: R+26.9
Not yet ingested
- Civics
- —
Market trends
- HPI YoY
- ▲ 3.74%
- Current HPI
- 220.6691
- Rent YoY
- —
- Metro
- —
- State GDP YoY
- ▲ 3.95%
- F500 in state
- 110
Industry mix (Fortune 500 HQ in TX)
| Industry | F500 HQs | Revenue |
|---|---|---|
| Energy | 16 | $1,198B |
|
||
| Technology | 5 | $198B |
|
||
| Engineering / Construction | 4 | $72B |
|
||
| Energy Services | 3 | $60B |
|
||
| Utilities | 3 | $41B |
|
||
| Healthcare | 2 | $330B |
|
||
Price history
-11.5% since first listed15 events — show timeline
- 2026-04-20 Relisted — CTXMLS
- 2026-03-14 Relisted — CTXMLS
- 2026-02-05 Relisted — CTXMLS
- 2025-07-29 Price Changed — Unlock MLS
- 2025-07-29 Price Changed $119,500 CTXMLS
- 2025-05-26 Price Changed $125,000 NTREIS
- 2025-05-10 Price Changed $125,000 CTXMLS
- 2025-05-10 Price Changed — Unlock MLS
- 2025-04-07 Relisted — CTXMLS
- 2025-03-12 Relisted — CTXMLS
- 2025-03-12 Listing Removed — CTXMLS
- 2025-03-07 Listed $135,000 CTXMLS
- 2025-03-07 Listed — Unlock MLS
- 2025-03-07 Listed $135,000 NTREIS
- 2025-03-07 Listing Removed — CTXMLS
Property tax history
+9.6%/yrLatest (2025): $214 · +29.7% YoY. Source: county tax records.
Cash-flow waterfall
monthlySold comps — $/sqft
last 12 mo · ≤1 miLoading sold comps…