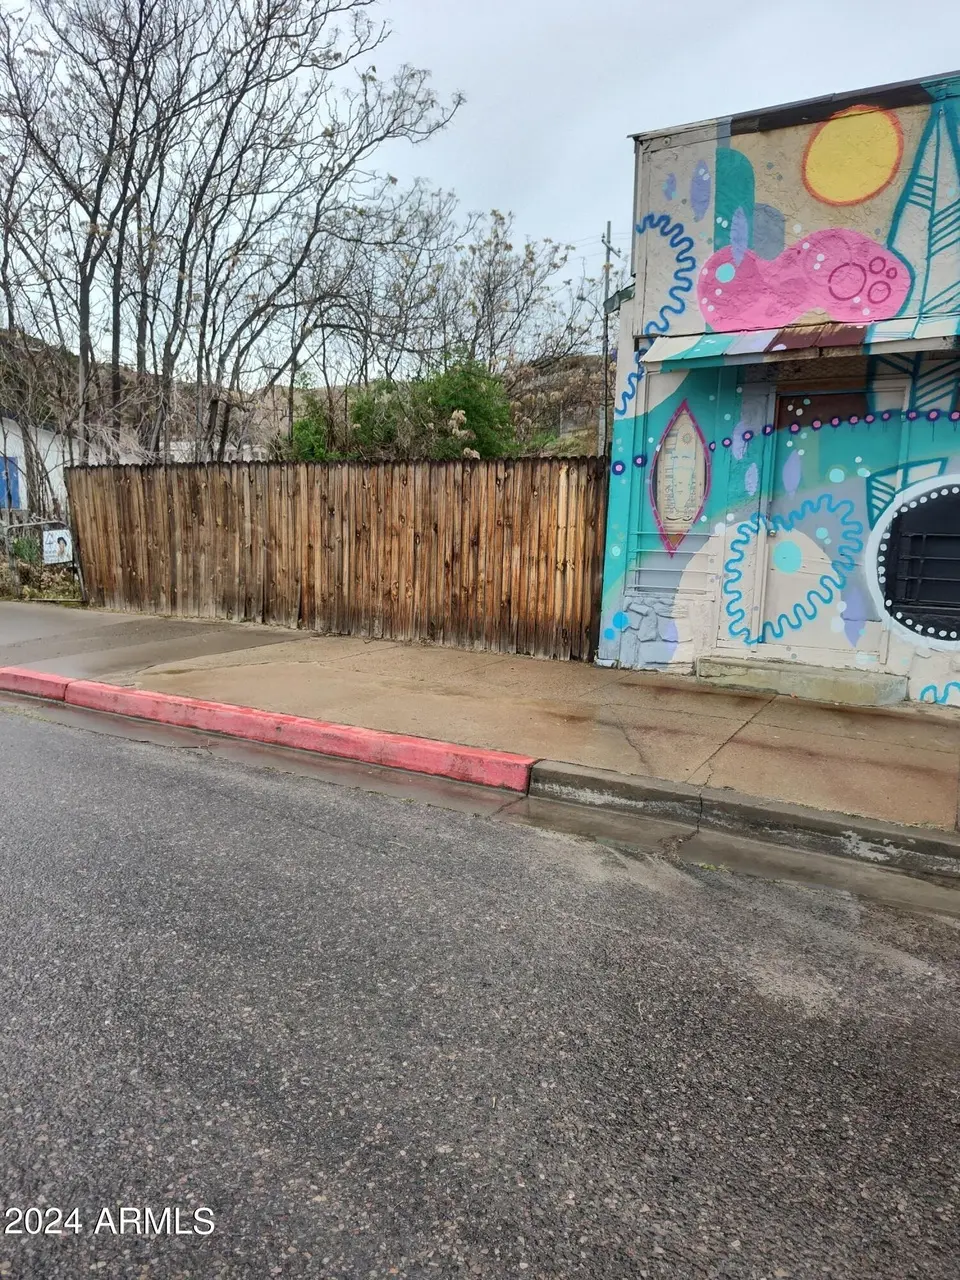
728 W Sullivan St · Miami, AZ
Flood risk No data
- FEMA flood zone
- —
- Chance of flooding over 30 yrs
- —
- Est. flood insurance / yr
- —
Fire risk No data
- Est. fire insurance / yr
- —
Heat risk No data
- Hot days now (above threshold)
- —
- Hot days in 30 yrs
- —
Wind risk No data
- Chance of severe wind over 30 yrs
- —
Air-quality risk No data
- Unhealthy air days now
- —
- Unhealthy air days in 30 yrs
- —
Risk factors via First Street. Map © Google.
Why this score? — see what drove the B grade
The composite is a weighted blend of 9 inputs, each scored 0–100. Each bar is that input's sub-score; the figure is the points it added to the 100-point composite (weight × sub-score).
- Cash flow +29.1/30.0
- ARV discount +15.0/15.0
- DSCR +10.0/10.0
- 1% rule +8.1/10.0
- Appreciation +3.5/10.0
- Livability +2.7/5.0
- Rent growth +2.5/5.0
- Condition / age +2.5/5.0
- Schools +1.1/10.0
$99,000
🖨 Deal sheet (PDF) 📄 Offer letter ✓ Due diligence
Listing remarks MLS
Great starter property in the downtown area of Miami. This property has a large lot and tons of potential for the future.
Key facts
- 4,348 sq ft lot
- 3 parking spots
- Built 1950
Neighborhood map
What this means for you Summary
Snapshot
- This is a 2-bed/1.0-bath single-family listed at $99k.
Deal economics
- At list price, monthly cash flow is $343 ($4k/yr) — positive.
- The deal already cash-flows at list — no discount required.
- Meets the 1% rule at list price ($1k rent vs $99k).
- Recommended offer: $87k (12.0% below list) — sets the bar for market timing.
Location & tenants
- Location reads 53/100 on livability (#289 in AZ) — a working-class tenant base; expect higher turnover. Strengths: cost of living A+, housing A, crime B+; Watch: amenities F, commute F, employment F.
- Miami Unified District (4211) (rural): math 8% / reading 19% proficiency, ranked #221 of 249 in AZ (top 89%) — low school quality limits family demand, transient renter base, plan for 1-2y turnover.
- Zoned schools: Dr. Charles A. Bejarano Elementary School (238 students, 66% FRL); Lee Kornegay Intermediate School (math 8% / reading 23%, grade F, #864 of 1,109 statewide, top 78%, 200 students, 62% FRL); Miami Junior Senior High School (math 7% / reading 8%, grade F, #358 of 381 statewide, top 94%, 495 students, 49% FRL).
- Market conditions: 31 active listings in the ZIP; 1 comparable units currently listed for rent nearby; 217 units permitted in Gila County in 2024 (0 in 5+ unit buildings).
Forward outlook
- Local home prices are declining (-2.9%/yr); year-one equity from $684 of loan paydown is wiped out by about $3k of value loss. Plan a longer hold.
- Gila County population projected at -18% by 2050 — secular population decline; favor cash flow + early exit over multi-decade hold.
- At projected returns (-2.9% appreciation + 3.0% rent growth), your $28k cash investment doubles in ~8 years — after that, you're playing with house money.
Negotiation context
- It's been on market 150 days — a 12% lower offer ($87k) is reasonable based on typical stale-listing flexibility.
- 3 sale attempts since 2y ago with the ask held roughly flat each time — persistent listings suggest the price (not the market) is what's stuck; bring a comps-based counter.
- Current owner paid $60k; list at $99k implies a 65% gain — meaningful room to come down on a strong offer.
Risks & watch-outs
- Watch-outs: built in 1950 — expect roof / HVAC / electrical / plumbing capex.
Questions for the listing agent
- It's been on market 150 days. Have you received any prior offers? Is the seller open to a 12% concession, seller financing, or rate buy-down credit?
- Built in 1950 — when were the roof, HVAC, electrical panel, plumbing, and water heater last replaced?
- Why hasn't it sold? Are there any deal-killer items the seller is aware of (foundation, flood, title, zoning, code violations)?
- Is there a deadline driving the sale (1031 exchange, divorce, estate, relocation)? That informs how much negotiation room exists.
- Schools are F-rated, which usually means shorter tenancies and higher turnover. Who's the typical renter profile here, and what's been the actual vacancy rate?
- What's the average days-on-market for RENTAL listings here right now (not sales)? A rising rental-DOM trend means longer vacancies and softer asking-rent achievability than the comps imply.
- What's the recent tenant-quality profile in this submarket — average credit score on applications, eviction rate, late-payment / NSF rate, and stable-employment percentage? A property-management company in the area should have these aggregated.
- How much new for-sale + rental construction is in the pipeline within 1–3 miles? Heavy new supply typically softens prices + rents 12–24 months out; constrained supply supports both.
Investment metrics
- 1% rule
- 1.31% ✓
- Cap rate
- 10.45%
- Cash-on-cash
- 14.84%
- DSCR
- 1.66
- GRM
- 6.3
CMA / ARV
- ARV (median comp)
- $187,425
- List price
- $99,000
- Delta
- -47.18%
- Verdict
- UNDERPRICED
- Comps
- 7 within 1.0 mi
Projected returns pro-forma
-2.92% appreciation · 3.0% rent growth · sell at horizon
- IRR
- 5.7%
- Equity multiple
- 1.22×
- Total profit
- $6,127
- Equity at exit
- $15,096
- IRR
- 14.9%
- Equity multiple
- 2.22×
- Total profit
- $33,799
- Equity at exit
- $9,135
Cash invested: $27,720 (down + closing). Projections, not guarantees.
Landlord ↔ Tenant lean methodology
- Overall (STATE)
- 87 Strongly Landlord-Friendly
- State Arizona
- 87 Strongly Landlord-Friendly · R+3
- County
- — inherits STATE
- City
- — inherits STATE
ZIP-level market 85539
- Home prices YoY
- -1.4%
- Active inventory
- 31
- Price-to-rent
- 6.3×
Monthly cashflow live
- Estimated rent
- $1,300 medium interval (Pro) →
- Mortgage (P&I)
- −$519
- Tax est. 1.5%
- −$124 /mo · $1,485/yr
- Insurance
- −$41
- HOA
- −$0
- Vacancy / Maint / Mgmt
- −$273
- Net cashflow
- $343
Break-even live
Sensitivity live
| Price | -10% $411 | -5% $377 | +0% $343 | +5% $309 | +10% $274 |
|---|---|---|---|---|---|
| Rent | -10% $240 | -5% $291 | +0% $343 | +5% $394 | +10% $446 |
| Rate | -1.0pp $393 | -0.5pp $368 | base $343 | +0.5pp $317 | +1.0pp $291 |
UW: 25.0% down · 7.5% · 30yr · 1.5% tax · 5.0% vac · 8.0% maint · 8.0% mgmt
Financing live
Cash to close
- Down payment
- $24,750
- Closing costs
- $2,970
- Reserves months
- —
- Total cash needed
- —
Loan-product check · same deal, 3 products live
Conventional
25% down · 7.5% · 30yr
- Down + closing
- —
- Monthly P&I
- —
- Monthly cashflow
- —
- DSCR
- —
- Eligible?
- —
Personal DTI + credit; lowest rate.
DSCR
20% down · 8.5% · 30yr
- Down + closing
- —
- Monthly P&I
- —
- Monthly cashflow
- —
- DSCR
- —
- Eligible?
- —
No personal income docs; deal must DSCR.
Hard money
10% down · 12.0% · 12mo
- Down + closing
- —
- Monthly P&I
- —
- Monthly cashflow
- —
- DSCR
- —
- Eligible?
- —
Short-term bridge; refi at stabilization.
Rent comps 1 comps
| Address | Beds | Baths | Sqft | Rent | $/sqft | DOM | Units | Dist |
|---|---|---|---|---|---|---|---|---|
| 1122 Bird St Unit A Miami, AZ | 2.0 | 1.0 | 1100 | $1,300 | $1.18 | 45d | 1 | 0.36mi |
Listing history 25 events
-
2026-06-21days on market $99,000 Active 150 DOM
-
2026-06-19days on market $99,000 Active 148 DOM
-
2026-06-18days on market $99,000 Active 147 DOM
-
2026-06-17days on market $99,000 Active 146 DOM
-
2026-06-16days on market $99,000 Active 145 DOM
-
2026-06-15days on market $99,000 Active 144 DOM
-
2026-06-14days on market $99,000 Active 142 DOM
-
2026-06-12days on market $99,000 Active 141 DOM
-
2026-06-09days on market $99,000 Active 138 DOM
-
2026-06-08days on market $99,000 Active 137 DOM
-
2026-06-07days on market $99,000 Active 136 DOM
-
2026-06-07days on market $99,000 Active 135 DOM
-
2026-06-04days on market $99,000 Active 132 DOM
-
2026-06-02days on market $99,000 Active 131 DOM
-
2026-06-01days on market $99,000 Active 130 DOM
-
2026-05-31days on market $99,000 Active 129 DOM
-
2026-05-31days on market $99,000 Active 128 DOM
-
2026-01-22$99,000 Active 121-char remark
Show marketing remark (121 chars)
Great starter property in the downtown area of Miami. This property has a large lot and tons of potential for the future.
-
2024-07-03soldstatus $60,000
-
2024-07-02soldstatus $60,000 Closed 121-char remark
Show marketing remark (121 chars)
Great starter property in the downtown area of Miami. This property has a large lot and tons of potential for the future.
-
2024-06-25status Pending 121-char remark
Show marketing remark (121 chars)
Great starter property in the downtown area of Miami. This property has a large lot and tons of potential for the future.
-
2024-06-25$99,000 Active 121-char remark
Show marketing remark (121 chars)
Great starter property in the downtown area of Miami. This property has a large lot and tons of potential for the future.
-
2024-06-24soldstatus $60,000 Closed 121-char remark
Show marketing remark (121 chars)
Great starter property in the downtown area of Miami. This property has a large lot and tons of potential for the future.
-
2024-05-14status Pending 121-char remark
Show marketing remark (121 chars)
Great starter property in the downtown area of Miami. This property has a large lot and tons of potential for the future.
-
2024-03-21$99,000 Active 121-char remark
Show marketing remark (121 chars)
Great starter property in the downtown area of Miami. This property has a large lot and tons of potential for the future.
ⓘ Source: listings_history table (triggers on properties + properties_extension) + one-shot
backfill from property_details.listing_events for pre-trigger history.
Nearby sold comps map
Loading sold comps map…
Walkable amenities ~0.75 mi
Loading nearby amenities…
Taxation est. · year 1
- Rental income
- $15,600
- − Mortgage interest
- −$5,546
- − Property taxes
- −$1,485
- − Insurance
- −$495
- − Repairs & maintenance
- −$1,248
- − Management
- −$1,248
- − Depreciation
- −$2,880
- Taxable income
- $2,698
- Est. tax owed @ 24.0%
- −$648
- After-tax cash flow
- $3,466/yr
For passive investors: Depreciation is non-cash, so a rental often shows a tax loss while cash-flowing — sheltering income. Rental losses are passive: they offset passive income freely, and up to $25,000/yr can offset ordinary (W-2) income if you actively participate and your MAGI is under $100k (phasing out to $0 by $150k); unused losses carry forward. On sale, claimed depreciation is recaptured at up to 25%, and gains may owe capital-gains tax (a 1031 exchange can defer both). Figures are a year-1 estimate at your 24.0% rate — not tax advice; consult a CPA.
Schools (NCES district)
- District
- Miami Unified District (4211)
- NCES district ID
- 0405030
- Math proficiency
- 8% ▼ -17.00%
- Reading proficiency
- 19% ▼ -5.00%
- Median HH income
- $33,063
- Composite
- 10.86/100
- National rank
- #9760
- State rank
- #221 of 249 in AZ
Livability — Miami
- Score
- 53/100
- State rank
- #289
- US rank
- #24461
Category grades
Schools grade is shown separately in the Schools card above.
Census & demographics
- Census place
- Miami, AZ
- Population (ZIP)
- 3,066
Population outlook (Gila County) Hauer SSP2
- Today (2025)
- 50,229 people
- By 2030
- 48,202 · -4.0%
- By 2040
- 44,101 · -12.2%
- By 2050
- 41,041 · -18.3%
- By 2075
- 37,536 · -25.3%
- By 2100
- 32,485 · -35.3%
Race, ethnicity, and origin ACS 2023
- Neighborhood character
- Diverse neighborhood (Simpson 0.63)
- Race & ethnicity
- Hispanic / Latino 47% White 39% Two or more races 33% Native American 5%
- Hispanic origin (detail)
- Mexican 44%
- Common ancestry
- Slovak 6% Italian 2% Romanian 2%
- Foreign-born
- 4% · Canada
- Languages at home
- 85% English-only · Spanish 12%
Political lean MEDSL · Gila
- 2024 margin
- Solid R (+37.6) · D 30.8% · R 68.4%
- 2008→2024 swing
- -9.8pp toward R · 2008: -27.8pp · 2024: -37.6pp
- All cycles
- 2024: R+37.6 2020: R+34.1 2016: R+32.4 2012: R+26.4 2008: R+27.8
Not yet ingested
- Civics
- —
Market trends
- HPI YoY
- ▼ -2.92%
- Current HPI
- 207.4672
- Rent YoY
- —
- Metro
- —
- State GDP YoY
- ▲ 4.54%
- F500 in state
- 20
Industry mix (Fortune 500 HQ in AZ)
| Industry | F500 HQs | Revenue |
|---|---|---|
| Technology | 2 | $13B |
|
||
| Mining / Metals | 1 | $23B |
|
||
| Environmental Services | 1 | $16B |
|
||
| Metals / Steel | 1 | $14B |
|
||
| Technology Distribution | 1 | $9B |
|
||
| Homebuilding | 1 | $8B |
|
||
Price history
+0.0% since first listed8 events — show timeline
- 2026-01-22 Listed $99,000 ARMLS
- 2024-07-03 Sold (Public Records) $60,000 Public Records
- 2024-07-02 Sold (MLS) $60,000 ARMLS
- 2024-06-25 Pending — ARMLS
- 2024-06-25 Listed $99,000 ARMLS
- 2024-06-24 Sold (MLS) $60,000 ARMLS
- 2024-05-14 Pending — ARMLS
- 2024-03-21 Listed $99,000 ARMLS
Property tax history
+1.7%/yrLatest (2025): $183 · +5.3% YoY. Source: county tax records.
Cash-flow waterfall
monthlySold comps — $/sqft
last 12 mo · ≤1 miLoading sold comps…