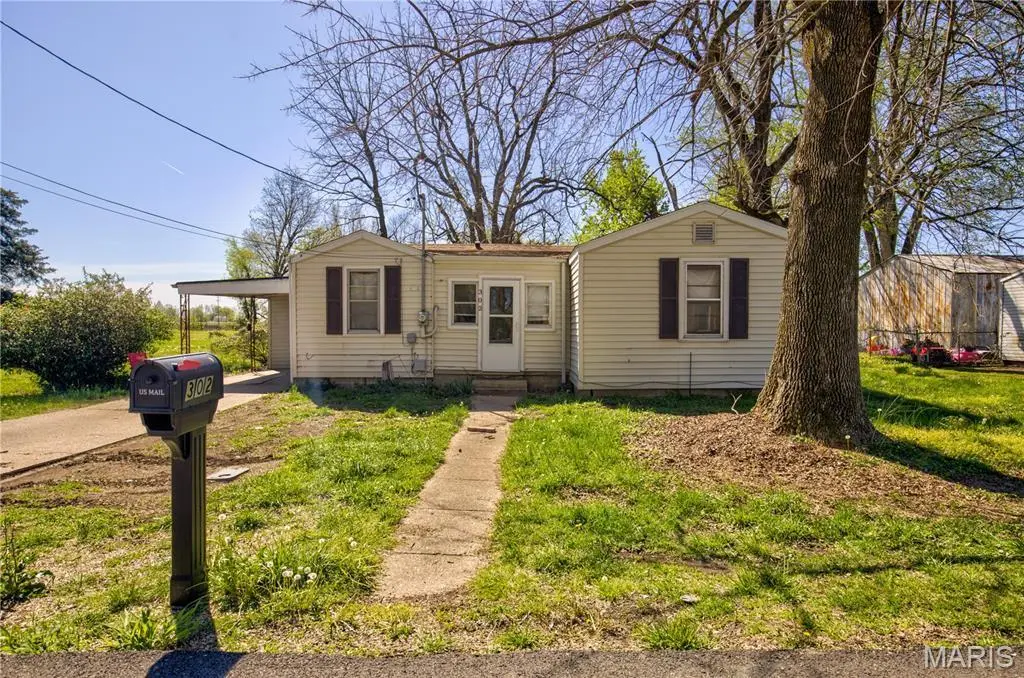
302 Marshall · Morehouse, MO
Flood risk 4/10 · Minor
- FEMA flood zone
- X
- Chance of flooding over 30 yrs
- 0.24%
- Est. flood insurance / yr
- $507 – $1,088
Fire risk 1/10 · Minimal
- Est. fire insurance / yr
- $1,054 – $1,958
Heat risk 6/10 · Moderate
- Hot days now (above 109°F)
- 7 days/yr
- Hot days in 30 yrs
- 21 days/yr
Wind risk 3/10 · Minor
- Chance of severe wind over 30 yrs
- 5.0%
Air-quality risk 2/10 · Minimal
- Unhealthy air days now
- 0 days/yr
- Unhealthy air days in 30 yrs
- 1 days/yr
Risk factors via First Street. Map © Google.
Why this score? — see what drove the C grade
The composite is a weighted blend of 9 inputs, each scored 0–100. Each bar is that input's sub-score; the figure is the points it added to the 100-point composite (weight × sub-score).
- Cash flow +27.4/30.0
- DSCR +9.6/10.0
- 1% rule +6.4/10.0
- Schools +2.8/10.0
- Livability +2.8/5.0
- Rent growth +2.5/5.0
- Condition / age +2.5/5.0
- ARV discount +1.5/15.0
- Appreciation +0.0/10.0
$89,500
🖨 Deal sheet 📄 Offer letter ✓ Due diligence
Listing remarks MLS
Welcome to this cozy 2 bed, 1 bath home on a desirable corner lot! Featuring a new heating unit, this property offers comfort and peace of mind. Whether you're a first-time buyer, looking to downsize, or searching for your next investment property, this home checks all the boxes. Affordable, manageable, and full of potential!
Key facts
- 8,276 sq ft lot
- Parking
- Built 1955
Neighborhood map
What this means for you Summary
Snapshot
- This is a 2-bed/1.0-bath other listed at $90k.
Deal economics
- At list price, monthly cash flow is $262 ($3k/yr) — positive.
- The deal already cash-flows at list — no discount required.
- Meets the 1% rule at list price ($1k rent vs $90k).
- Recommended offer: $84k (6.0% below list) — sets the bar for market timing.
Location & tenants
- Location reads 55/100 on livability (#736 in MO) — a working-class tenant base; expect higher turnover. Strengths: cost of living A+, housing A+; Watch: health & safety C-, schools F, crime F.
- Sikeston R-6 (town): math 33% / reading 34% proficiency, ranked #243 of 324 in MO (top 75%) — families likely to look elsewhere, expect single-tenant / working-renter base with shorter leases; 61% free/reduced lunch — lower-income household profile, screen leases tightly.
- Market conditions: 168 active listings in the ZIP; 11 units permitted in New Madrid County in 2024 (0 in 5+ unit buildings).
Forward outlook
- Local home prices are declining (-3.0%/yr); year-one equity from $619 of loan paydown is wiped out by about $3k of value loss. Plan a longer hold.
- New Madrid County population projected at -25% by 2050 — secular population decline; favor cash flow + early exit over multi-decade hold.
- At projected returns (-3.0% appreciation + 3.0% rent growth), your $25k cash investment doubles in ~10 years — after that, you're playing with house money.
Negotiation context
- It's been on market 73 days — a 6% lower offer ($84k) is reasonable based on typical stale-listing flexibility.
- 3 sale attempts since 3y ago; this cycle's ask has dropped $6k (6%) from the opening price — seller is motivated, your offer sets the floor, not the list.
Risks & watch-outs
- Watch-outs: built in 1955 — expect roof / HVAC / electrical / plumbing capex.
- Climate carrying-cost: extreme-heat days projected 7→21/yr by 2055 (HVAC capex compounding) — expect insurance premiums to compound above CPI over the hold.
Questions for the listing agent
- It's been on market 73 days. Have you received any prior offers? Is the seller open to a 6% concession, seller financing, or rate buy-down credit?
- Built in 1955 — when were the roof, HVAC, electrical panel, plumbing, and water heater last replaced?
- Why hasn't it sold? Are there any deal-killer items the seller is aware of (foundation, flood, title, zoning, code violations)?
- Is there a deadline driving the sale (1031 exchange, divorce, estate, relocation)? That informs how much negotiation room exists.
- Schools are F-rated, which usually means shorter tenancies and higher turnover. Who's the typical renter profile here, and what's been the actual vacancy rate?
- Crime grade is F in this area — have there been break-ins, vandalism, or insurance claims at this property in the last 3 years? What carrier currently insures it and at what premium?
- What's the average days-on-market for RENTAL listings here right now (not sales)? A rising rental-DOM trend means longer vacancies and softer asking-rent achievability than the comps imply.
- What's the recent tenant-quality profile in this submarket — average credit score on applications, eviction rate, late-payment / NSF rate, and stable-employment percentage? A property-management company in the area should have these aggregated.
- How much new for-sale + rental construction is in the pipeline within 1–3 miles? Heavy new supply typically softens prices + rents 12–24 months out; constrained supply supports both.
Investment metrics
- 1% rule
- 1.14% ✓
- Cap rate
- 9.81%
- Cash-on-cash
- 12.56%
- DSCR
- 1.56
- GRM
- 7.3
CMA / ARV
- ARV (median comp)
- $79,032
- List price
- $89,500
- Delta
- 13.24%
- Verdict
- OVERPRICED
- Comps
- 14 within 1.0 mi
Projected returns pro-forma
-3.0% appreciation · 3.0% rent growth · sell at horizon
- IRR
- 2.3%
- Equity multiple
- 1.09×
- Total profit
- $2,171
- Equity at exit
- $13,345
- IRR
- 11.8%
- Equity multiple
- 1.93×
- Total profit
- $23,276
- Equity at exit
- $7,738
Cash invested: $25,060 (down + closing). Projections, not guarantees.
Landlord ↔ Tenant lean methodology
- Overall (STATE)
- 81 Strongly Landlord-Friendly
- State Missouri
- 81 Strongly Landlord-Friendly · R+10
- County
- — inherits STATE
- City
- — inherits STATE
ZIP-level market 63801
- Home prices YoY
- -11.6%
- Active inventory
- 168
- Price-to-rent
- 7.3×
Monthly cashflow live
- Estimated rent
- $1,020 medium interval (Pro) →
- Mortgage (P&I)
- −$469
- Tax from tax record
- −$37 /mo · $441/yr
- Insurance
- −$37
- HOA
- −$0
- Vacancy / Maint / Mgmt
- −$214
- Net cashflow
- $262
Break-even live
UW: 25.0% down · 7.5% · 30yr · 1.5% tax · 5.0% vac · 8.0% maint · 8.0% mgmt
Financing live
Cash to close
- Down payment
- $22,375
- Closing costs
- $2,685
- Reserves months
- —
- Total cash needed
- —
Loan-product check · same deal, 3 products live
Conventional
25% down · 7.5% · 30yr
- Down + closing
- —
- Monthly P&I
- —
- Monthly cashflow
- —
- DSCR
- —
- Eligible?
- —
Personal DTI + credit; lowest rate.
DSCR
20% down · 8.5% · 30yr
- Down + closing
- —
- Monthly P&I
- —
- Monthly cashflow
- —
- DSCR
- —
- Eligible?
- —
No personal income docs; deal must DSCR.
Hard money
10% down · 12.0% · 12mo
- Down + closing
- —
- Monthly P&I
- —
- Monthly cashflow
- —
- DSCR
- —
- Eligible?
- —
Short-term bridge; refi at stabilization.
Listing history 22 events
-
2026-06-19days on market $89,500 Active 73 DOM
-
2026-06-18days on market $89,500 Active 72 DOM
-
2026-06-17days on market $89,500 Active 71 DOM
-
2026-06-16days on market $89,500 Active 70 DOM
-
2026-06-15days on market $89,500 Active 69 DOM
-
2026-06-14days on market $89,500 Active 67 DOM
-
2026-06-13days on market $89,500 Active 66 DOM
-
2026-06-10days on market $89,500 Active 64 DOM
-
2026-06-09days on market $89,500 Active 63 DOM
-
2026-06-08days on market $89,500 Active 62 DOM
-
2026-06-07days on market $89,500 Active 61 DOM
-
2026-06-05days on market $89,500 Active 58 DOM
-
2026-06-03days on market $89,500 Active 57 DOM
-
2026-06-02days on market $89,500 Active 56 DOM
-
2026-06-01days on market $89,500 Active 55 DOM
-
2026-05-31days on market $89,500 Active 54 DOM
-
2026-05-30days on market $89,500 Active 53 DOM
-
2026-04-07$95,000 Active 327-char remark
Show marketing remark (327 chars)
Welcome to this cozy 2 bed, 1 bath home on a desirable corner lot! Featuring a new heating unit, this property offers comfort and peace of mind. Whether you're a first-time buyer, looking to downsize, or searching for your next investment property, this home checks all the boxes. Affordable, manageable, and full of potential!
-
2024-12-08$94,900 Active
-
2023-12-29historical
-
2023-09-26soldstatus
-
2023-08-05$49,900 Active
ⓘ Source: listings_history table (triggers on properties + properties_extension) + one-shot
backfill from property_details.listing_events for pre-trigger history.
Tax reassessment forecast MO · Resets to sale price
- Current annual tax
- $441 · $37/mo
- Projected year-2 tax
- $868 · $72/mo
- Expected delta
- +$427/yr (+$36/mo · 96.9%)
ⓘ Screening estimate from a state-policy table — verify with the county assessor before closing.
Climate risk First Street
- Flood 4/10 Moderate FEMA zone X · 24% chance over 30 yrs
- Wildfire 1/10 Low
- Heat 6/10 Major 7 d/yr ≥109°F today · 21 d/yr by 30 yrs out
- Wind 3/10 Moderate 5% chance of damaging wind over 30 yrs
- Air quality 2/10 Low 0 unhealthy d/yr today · 1 by 30 yrs out
Nearby sold comps map
Loading sold comps map…
Walkable amenities ~0.75 mi
Loading nearby amenities…
Taxation est. · year 1
- Rental income
- $12,238
- − Mortgage interest
- −$5,013
- − Property taxes
- −$441
- − Insurance
- −$448
- − Repairs & maintenance
- −$979
- − Management
- −$979
- − Depreciation
- −$2,604
- Taxable income
- $1,774
- Est. tax owed @ 24.0%
- −$426
- After-tax cash flow
- $2,722/yr
For passive investors: Depreciation is non-cash, so a rental often shows a tax loss while cash-flowing — sheltering income. Rental losses are passive: they offset passive income freely, and up to $25,000/yr can offset ordinary (W-2) income if you actively participate and your MAGI is under $100k (phasing out to $0 by $150k); unused losses carry forward. On sale, claimed depreciation is recaptured at up to 25%, and gains may owe capital-gains tax (a 1031 exchange can defer both). Figures are a year-1 estimate at your 24.0% rate — not tax advice; consult a CPA.
Schools (NCES district)
- District
- Sikeston R-6
- NCES district ID
- 2928260
- Math proficiency
- 33% ▼ -4.00%
- Reading proficiency
- 34% ▼ -2.00%
- Median HH income
- $36,800
- Composite
- 27.85/100
- National rank
- #6879
- State rank
- #243 of 324 in MO
Livability — Morehouse
- Score
- 55/100
- State rank
- #736
- US rank
- #23257
Category grades
Schools grade is shown separately in the Schools card above.
Census & demographics
- Census place
- Morehouse, MO
- City population
- 690
- Population (ZIP)
- 22,121
Population outlook (New Madrid County) Hauer SSP2
- Today (2025)
- 16,712 people
- By 2030
- 15,845 · -5.2%
- By 2040
- 14,152 · -15.3%
- By 2050
- 12,604 · -24.6%
- By 2075
- 9,478 · -43.3%
- By 2100
- 7,157 · -57.2%
Race, ethnicity, and origin ACS 2023
- Neighborhood character
- Predominantly White (73%)
- Race & ethnicity
- White 73% Black 19% Two or more races 6% Hispanic / Latino 2%
- Common ancestry
- Slovak 2% Lithuanian 1% Italian 1%
- Foreign-born
- 1% · Canada
- Languages at home
- 96% English-only · Spanish 2% Other Indo-European 1%
Political lean MEDSL · New Madrid
- 2024 margin
- Solid R (+53.5) · D 22.9% · R 76.4%
- 2008→2024 swing
- -38.4pp toward R · 2008: -15.1pp · 2024: -53.5pp
- All cycles
- 2024: R+53.5 2020: R+51.0 2016: R+45.4 2012: R+20.3 2008: R+15.1
Not yet ingested
- Civics
- —
Market trends
- HPI YoY
- ▼ -18.54%
- Current HPI
- 141.0868
- Rent YoY
- —
- Metro
- —
- State GDP YoY
- ▲ 1.84%
- F500 in state
- 20
Industry mix (Fortune 500 HQ in MO)
| Industry | F500 HQs | Revenue |
|---|---|---|
| Healthcare | 1 | $163B |
|
||
| Insurance | 1 | $21B |
|
||
| Industrial Technology | 1 | $17B |
|
||
| Retail | 1 | $16B |
|
||
| Industrial Distribution | 1 | $10B |
|
||
| Utilities | 1 | $9B |
|
||
Price history
+90.4% since first listed5 events — show timeline
- 2026-04-07 Listed $95,000 MARIS as Distributed by MLS Grid
- 2024-12-08 Listed $94,900 MARIS as Distributed by MLS Grid
- 2023-12-29 Delisted — MARIS as Distributed by MLS Grid
- 2023-09-26 Sold (Public Records) — Public Records
- 2023-08-05 Listed $49,900 MARIS as Distributed by MLS Grid
Property tax history
+7.7%/yrLatest (2025): $441 · +63.2% YoY. Source: county tax records.
Cash-flow waterfall
monthlySold comps — $/sqft
last 12 mo · ≤1 miLoading sold comps…