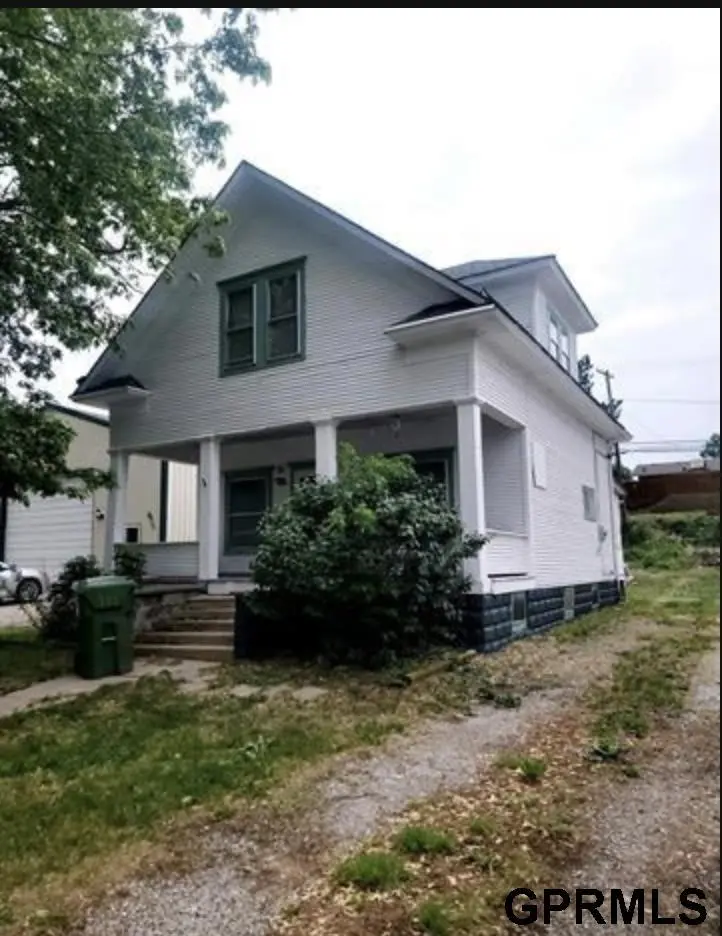
505 N Saunders St · Sutton, NE
Flood risk 9/10 · Severe
- FEMA flood zone
- A
- Chance of flooding over 30 yrs
- 0.99%
- Est. flood insurance / yr
- $946 – $6,584
Fire risk 3/10 · Minor
- Est. fire insurance / yr
- $1,161 – $2,155
Heat risk 3/10 · Minor
- Hot days now (above 103°F)
- 7 days/yr
- Hot days in 30 yrs
- 16 days/yr
Wind risk 2/10 · Minimal
- Chance of severe wind over 30 yrs
- —
Air-quality risk 1/10 · Minimal
- Unhealthy air days now
- 0 days/yr
- Unhealthy air days in 30 yrs
- 0 days/yr
Risk factors via First Street. Map © Google.
Why this score? — see what drove the B+ grade
The composite is a weighted blend of 9 inputs, each scored 0–100. Each bar is that input's sub-score; the figure is the points it added to the 100-point composite (weight × sub-score).
- Cash flow +30.0/30.0
- 1% rule +10.0/10.0
- DSCR +10.0/10.0
- Appreciation +7.7/10.0
- ARV discount +7.5/15.0
- Schools +4.9/10.0
- Livability +3.8/5.0
- Rent growth +2.5/5.0
- Condition / age +2.5/5.0
$70,000
🖨 Deal sheet 📄 Offer letter ✓ Due diligence
Listing remarks MLS
Close to everything! This property is within walking distance of down town and the park. Perfect seats for the parade await you. Open living, kitchen, dining area, appliances can stay. Home has been power washed and is being fully painted on the exterior. Three full bedrooms with walk in closets plus an office upstairs. Basement has a workbench area and laundry could be relocated downstairs as well. Cash and conventional financing only.
Key facts
- Workbench area
- 6,534 sq ft lot
- Built 1920
Tags
Neighborhood map
What this means for you Summary
Snapshot
- This is a 3-bed/1.0-bath single-family listed at $70k.
Deal economics
- At list price, monthly cash flow is $255 ($3k/yr) — positive.
- The deal already cash-flows at list — no discount required.
- Meets the 1% rule at list price ($1k rent vs $70k).
- Recommended offer: $62k (12.0% below list) — sets the bar for market timing.
Location & tenants
- Location reads 76/100 on livability (#82 in NE, #3,427 nationally) — a middle-class / working-renter tenant base. Strengths: crime A+, cost of living A+, housing A+; Watch: amenities F, commute F.
- Sutton Public Schools (rural): math 58% / reading 56% proficiency, ranked #27 of 111 in NE (top 24%) — acceptable for families but not a draw, mixed tenant base, ~2y average lease.
- Market conditions: 10 active listings in the ZIP; 6 units permitted in Clay County in 2024 (0 in 5+ unit buildings).
Forward outlook
- In year one you build about $4k of equity ($484 loan paydown + $4k appreciation (5.4% local appreciation)).
- Clay County population projected at -16% by 2050 — secular population decline; favor cash flow + early exit over multi-decade hold.
- At projected returns (5.4% appreciation + 3.0% rent growth), your $20k cash investment doubles in ~3 years — after that, you're playing with house money.
- By year 8, paydown + projected appreciation supports a ~$33k cash-out refi (75% LTV) — recoverable capital for the next deal without selling this one.
Negotiation context
- It's been on market 357 days — a 12% lower offer ($62k) is reasonable based on typical stale-listing flexibility.
- 3 sale attempts since 3y ago; this cycle's ask has dropped $10k (12%) from the opening price — seller is motivated, your offer sets the floor, not the list.
- Current owner paid $28k; list at $70k implies a 150% gain — meaningful room to come down on a strong offer.
Risks & watch-outs
- Watch-outs: flood insurance adds $314/mo; built in 1920 — expect roof / HVAC / electrical / plumbing capex.
- Climate carrying-cost: in FEMA flood zone A (mandatory federal flood insurance) — expect insurance premiums to compound above CPI over the hold.
Questions for the listing agent
- It's been on market 357 days. Have you received any prior offers? Is the seller open to a 12% concession, seller financing, or rate buy-down credit?
- Built in 1920 — when were the roof, HVAC, electrical panel, plumbing, and water heater last replaced?
- What's the actual annual flood-insurance premium (NFIP or private), and is the property in a SFHA with mandatory coverage?
- Why hasn't it sold? Are there any deal-killer items the seller is aware of (foundation, flood, title, zoning, code violations)?
- Is there a deadline driving the sale (1031 exchange, divorce, estate, relocation)? That informs how much negotiation room exists.
- What's the average days-on-market for RENTAL listings here right now (not sales)? A rising rental-DOM trend means longer vacancies and softer asking-rent achievability than the comps imply.
- What's the recent tenant-quality profile in this submarket — average credit score on applications, eviction rate, late-payment / NSF rate, and stable-employment percentage? A property-management company in the area should have these aggregated.
- How much new for-sale + rental construction is in the pipeline within 1–3 miles? Heavy new supply typically softens prices + rents 12–24 months out; constrained supply supports both.
Investment metrics
- 1% rule
- 1.85% ✓
- Cap rate
- 16.05%
- Cash-on-cash
- 34.84%
- DSCR
- 2.55
- GRM
- 4.5
CMA / ARV
- ARV (median comp)
- $165,305
- List price
- $70,000
- Delta
- -57.65%
- Verdict
- UNDERPRICED
- Comps
- 19 within 1.0 mi
Show comp detail 3 sales within ~0.75 mi
| Address | Dist | Beds/Ba | Sqft | Sold | Price | $/sf | Match |
|---|---|---|---|---|---|---|---|
| 410 N Clark Ave | 0.20mi | 3/2.0 | 1,465 (+9%) | 1mo | $235,000 | $160 | 71 |
| 109 N Way Ave | 0.30mi | 4/1.0 (+1) | 1,363 (+1%) | 13mo | $170,000 | $125 | 68 |
| 509 E Forrest St | 0.49mi | 3/2.0 | 1,412 (+5%) | 20mo | $162,000 | $115 | 48 |
Match score weights: distance 35% · size 25% · config 20% · recency 20%. Top-matched comps best support the ARV.
Projected returns pro-forma
5.41% appreciation · 3.0% rent growth · sell at horizon
- IRR
- 27.3%
- Equity multiple
- 2.75×
- Total profit
- $34,225
- Equity at exit
- $41,407
- IRR
- 26.1%
- Equity multiple
- 5.54×
- Total profit
- $89,057
- Equity at exit
- $72,944
Cash invested: $19,600 (down + closing). Projections, not guarantees.
Landlord ↔ Tenant lean methodology
- Overall (STATE)
- 83 Strongly Landlord-Friendly
- State Nebraska
- 83 Strongly Landlord-Friendly · R+13
- County
- — inherits STATE
- City
- — inherits STATE
ZIP-level market 68979
- Home prices YoY
- 2.7%
- Active inventory
- 10
- Price-to-rent
- 4.5×
Monthly cashflow live
- Estimated rent
- $1,294 medium interval (Pro) →
- Mortgage (P&I)
- −$367
- Tax from tax record
- −$57 /mo · $685/yr
- Insurance
- −$29
- Flood insurance flood zone
- −$314 /mo · $3,765/yr
- HOA
- −$0
- Vacancy / Maint / Mgmt
- −$272
- Net cashflow
- $255
Break-even live
UW: 25.0% down · 7.5% · 30yr · 1.5% tax · 5.0% vac · 8.0% maint · 8.0% mgmt
Financing live
Cash to close
- Down payment
- $17,500
- Closing costs
- $2,100
- Reserves months
- —
- Total cash needed
- —
Loan-product check · same deal, 3 products live
Conventional
25% down · 7.5% · 30yr
- Down + closing
- —
- Monthly P&I
- —
- Monthly cashflow
- —
- DSCR
- —
- Eligible?
- —
Personal DTI + credit; lowest rate.
DSCR
20% down · 8.5% · 30yr
- Down + closing
- —
- Monthly P&I
- —
- Monthly cashflow
- —
- DSCR
- —
- Eligible?
- —
No personal income docs; deal must DSCR.
Hard money
10% down · 12.0% · 12mo
- Down + closing
- —
- Monthly P&I
- —
- Monthly cashflow
- —
- DSCR
- —
- Eligible?
- —
Short-term bridge; refi at stabilization.
Listing history 21 events
-
2026-06-18days on market $70,000 Active 357 DOM
-
2026-06-17days on market $70,000 Active 356 DOM
-
2026-06-16days on market $70,000 Active 355 DOM
-
2026-06-15days on market $70,000 Active 354 DOM
-
2026-06-13days on market $70,000 Active 352 DOM
-
2026-06-12days on market $70,000 Active 351 DOM
-
2026-06-09days on market $70,000 Active 348 DOM
-
2026-06-08days on market $70,000 Active 347 DOM
-
2026-06-07days on market $70,000 Active 346 DOM
-
2026-06-05days on market $70,000 Active 344 DOM
-
2026-06-04days on market $70,000 Active 342 DOM
-
2026-06-02days on market $70,000 Active 341 DOM
-
2026-06-01days on market $70,000 Active 340 DOM
-
2026-05-31days on market $70,000 Active 339 DOM
-
2026-05-13price $70,000 440-char remark
Show marketing remark (440 chars)
Close to everything! This property is within walking distance of down town and the park. Perfect seats for the parade await you. Open living, kitchen, dining area, appliances can stay. Home has been power washed and is being fully painted on the exterior. Three full bedrooms with walk in closets plus an office upstairs. Basement has a workbench area and laundry could be relocated downstairs as well. Cash and conventional financing only.
-
2025-06-26$80,000 New 440-char remark
Show marketing remark (440 chars)
Close to everything! This property is within walking distance of down town and the park. Perfect seats for the parade await you. Open living, kitchen, dining area, appliances can stay. Home has been power washed and is being fully painted on the exterior. Three full bedrooms with walk in closets plus an office upstairs. Basement has a workbench area and laundry could be relocated downstairs as well. Cash and conventional financing only.
-
2025-06-16historical
-
2024-08-17$84,000 New
-
2024-06-16historical
-
2023-05-12$90,000 New
-
1999-04-01soldstatus $28,000
ⓘ Source: listings_history table (triggers on properties + properties_extension) + one-shot
backfill from property_details.listing_events for pre-trigger history.
Tax reassessment forecast NE · Resets to sale price
- Current annual tax
- $685 · $57/mo
- Projected year-2 tax
- $1,211 · $101/mo
- Expected delta
- +$526/yr (+$44/mo · 76.8%)
ⓘ Screening estimate from a state-policy table — verify with the county assessor before closing.
Climate risk First Street
- Flood 9/10 Extreme FEMA zone A · 99% chance over 30 yrs
- Wildfire 3/10 Moderate
- Heat 3/10 Moderate 7 d/yr ≥103°F today · 16 d/yr by 30 yrs out
- Wind 2/10 Low
- Air quality 1/10 Low 0 unhealthy d/yr today · 0 by 30 yrs out
Nearby sold comps map
Loading sold comps map…
Walkable amenities ~0.75 mi
Loading nearby amenities…
Taxation est. · year 1
- Rental income
- $15,531
- − Mortgage interest
- −$3,921
- − Property taxes
- −$685
- − Insurance
- −$4,115
- − Repairs & maintenance
- −$1,242
- − Management
- −$1,242
- − Depreciation
- −$2,036
- Taxable income
- $2,288
- Est. tax owed @ 24.0%
- −$549
- After-tax cash flow
- $2,515/yr
For passive investors: Depreciation is non-cash, so a rental often shows a tax loss while cash-flowing — sheltering income. Rental losses are passive: they offset passive income freely, and up to $25,000/yr can offset ordinary (W-2) income if you actively participate and your MAGI is under $100k (phasing out to $0 by $150k); unused losses carry forward. On sale, claimed depreciation is recaptured at up to 25%, and gains may owe capital-gains tax (a 1031 exchange can defer both). Figures are a year-1 estimate at your 24.0% rate — not tax advice; consult a CPA.
Schools (NCES district)
- District
- Sutton Public Schools
- NCES district ID
- 3177520
- Math proficiency
- 58% ▬ 0.00%
- Reading proficiency
- 56% ▲ 5.00%
- Median HH income
- $52,543
- Composite
- 48.85/100
- National rank
- #2085
- State rank
- #27 of 111 in NE
Livability — Sutton
- Score
- 76/100
- State rank
- #82
- US rank
- #3427
Category grades
Schools grade is shown separately in the Schools card above.
Census & demographics
- Census place
- Sutton, NE
- City population
- 1,645
- Population (ZIP)
- 1,645
Population outlook (Clay County) Hauer SSP2
- Today (2025)
- 6,057 people
- By 2030
- 5,873 · -3.0%
- By 2040
- 5,490 · -9.4%
- By 2050
- 5,113 · -15.6%
- By 2075
- 4,184 · -30.9%
- By 2100
- 2,972 · -50.9%
Race, ethnicity, and origin ACS 2023
- Neighborhood character
- Predominantly White (92%)
- Race & ethnicity
- White 92% Hispanic / Latino 7% Two or more races 2% Native American 1%
- Hispanic origin (detail)
- Mexican 4%
- Common ancestry
- Romanian 5% Lithuanian 3% Scotch-Irish 2%
- Foreign-born
- 1%
- Languages at home
- 94% English-only · Spanish 2% German/W. Germanic 2% French/Haitian/Cajun 1%
Political lean MEDSL · Clay
- 2024 margin
- Solid R (+63.5) · D 17.4% · R 80.9% · Other 1.7%
- 2008→2024 swing
- -17.4pp toward R · 2008: -46.1pp · 2024: -63.5pp
- All cycles
- 2024: R+63.5 2020: R+62.1 2016: R+64.0 2012: R+53.2 2008: R+46.1
Not yet ingested
- Civics
- —
Market trends
- HPI YoY
- ▲ 5.41%
- Current HPI
- 203.4593
- Rent YoY
- —
- Metro
- —
- State GDP YoY
- ▲ 0.68%
- F500 in state
- 2
Industry mix (Fortune 500 HQ in NE)
| Industry | F500 HQs | Revenue |
|---|---|---|
| Conglomerate | 1 | $371B |
|
||
Price history
+150.0% since first listed7 events — show timeline
- 2026-05-13 Price Changed $70,000 GPRMLS
- 2025-06-26 Listed $80,000 GPRMLS
- 2025-06-16 Listing Removed — GPRMLS
- 2024-08-17 Listed $84,000 GPRMLS
- 2024-06-16 Listing Removed — GPRMLS
- 2023-05-12 Listed $90,000 GPRMLS
- 1999-04-01 Sold (Public Records) $28,000 Public Records
Cash-flow waterfall
monthlySold comps — $/sqft
last 12 mo · ≤1 miLoading sold comps…