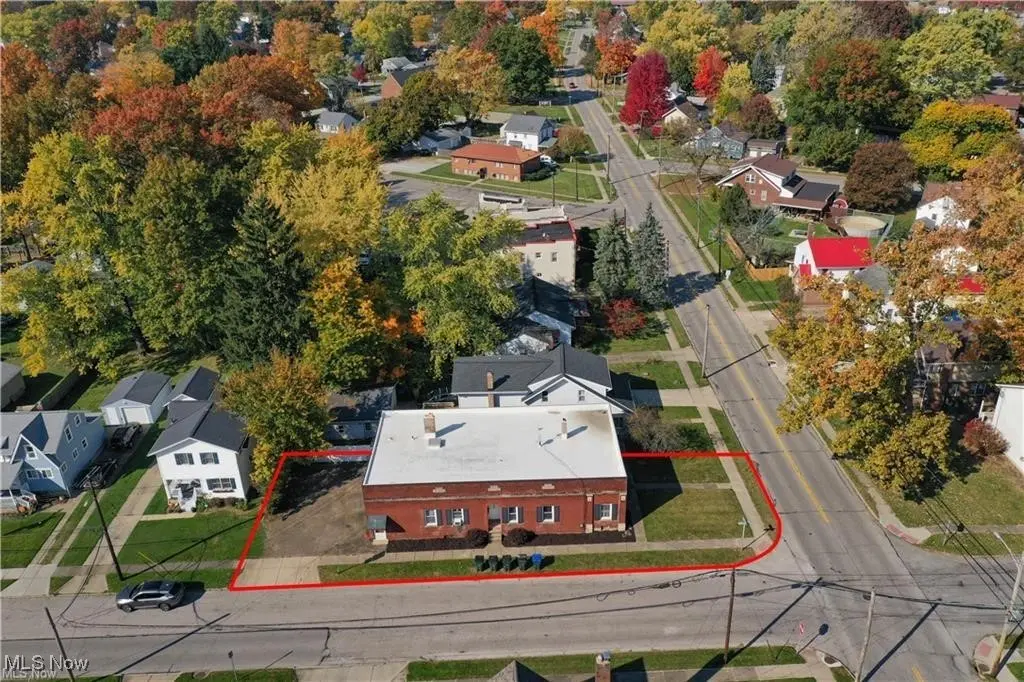
 Fourplex
2890 Bailey Rd · Cuyahoga Falls, OH
Flood risk 5/10 · Moderate
- FEMA flood zone
- X (unshaded)
- Chance of flooding over 30 yrs
- 0.65%
- Est. flood insurance / yr
- $507 – $1,088
Fire risk 1/10 · Minimal
- Est. fire insurance / yr
- $713 – $1,323
Heat risk 3/10 · Minor
- Hot days now (above 98°F)
- 7 days/yr
- Hot days in 30 yrs
- 17 days/yr
Wind risk 1/10 · Minimal
- Chance of severe wind over 30 yrs
- —
Air-quality risk 3/10 · Minor
- Unhealthy air days now
- 2 days/yr
- Unhealthy air days in 30 yrs
- 4 days/yr
Risk factors via First Street. Map © Google.
Why this score? — see what drove the D+ grade
The composite is a weighted blend of 9 inputs, each scored 0–100. Each bar is that input's sub-score; the figure is the points it added to the 100-point composite (weight × sub-score).
- Cash flow +21.6/30.0
- DSCR +6.9/10.0
- 1% rule +6.0/10.0
- Schools +4.5/10.0
- Rent growth +4.2/5.0
- Livability +4.2/5.0
- Condition / age +2.5/5.0
- ARV discount +0.0/15.0
- Appreciation +0.0/10.0
$379,000
🖨 Deal sheet (PDF) 📄 Offer letter ✓ Due diligence
Multi-family units
County records classify this as Multi-Family (5+ Unit). Listing-text estimate: 4 units. estimate disagrees with records
5+ unit building — per-unit beds/baths from public records are typically unavailable; the breakdown below (if shown) is an estimate from the listing text.
Listing remarks MLS
Fantastic opportunity to own this all brick 4 unit rental property with a new (2023) $40,000 roof and a fully waterproofed basement! Also One of the one bedroom units and shared space was just fully renovated with new floors, cabinets, counters, and paint throughout. Located on a prime residential corner in Cuyahoga falls this property is a great way to jumpstart your real estate investment goals or make an addition to your portfolio for under $95,000 per unit. Featuring three one bedroom units and one two bedroom unit these rentals will always be in high demand. All four units have newer kitchen appliances and hardwood floors. Each unit has its own exterior door and can be accessed through a common area hall way which also provides access to the basement with storage and laundry. Call today to make this one your next Investment!!
Key facts
- New floors
- New cabinets
- New counters
Tags
Neighborhood map
What this means for you Summary
Snapshot
- This is a 3×1bd/1ba + 1×2bd/1ba units multifamily listed at $379k.
Deal economics
- At list price, monthly cash flow is $575 ($7k/yr) — positive. Per door: $144/mo.
- The deal already cash-flows at list — no discount required.
- Meets the 1% rule at list price ($4k rent vs $379k).
- Recommended offer: $334k (12.0% below list) — sets the bar for market timing.
- Cap rate 8.1% vs local median 4.6% in Cuyahoga Falls — top-decile yield for the area; either an underpriced asset or a hidden risk that comps aren't pricing in. Stress-test before assuming the spread holds.
Location & tenants
- Location reads 83/100 on livability (#60 in OH, #870 nationally) — a professional / high-income tenant draw. Strengths: cost of living A+, housing A+, health & safety A+; Watch: commute F.
- Cuyahoga Falls City (suburban): math 47% / reading 58% proficiency, ranked #408 of 656 in OH (top 62%) — acceptable for families but not a draw, mixed tenant base, ~2y average lease.
- Market conditions: Rents rising fast (+7.0%/yr); 90 active listings in the ZIP; 1,114 units permitted in Summit County in 2024 (397 in 5+ unit buildings).
- At $4,159/mo this rent would consume 79% of the median local household income ($63k/yr) (locally 1080% of renters already pay >50% of income on rent) — very limited rent-growth headroom before tenants either downsize or default.
Forward outlook
- Local home prices are declining (-3.0%/yr); year-one equity from $3k of loan paydown is wiped out by about $11k of value loss. Plan a longer hold.
- Summit County population projected to shrink 6% by 2050 — rents likely to lag national; underwrite the cash flow, not the appreciation.
- At projected returns (-3.0% appreciation + 7.0% rent growth), your $106k cash investment doubles in ~9 years — after that, you're playing with house money.
Negotiation context
- It's been on market 236 days — a 12% lower offer ($334k) is reasonable based on typical stale-listing flexibility.
- 5 sale attempts since 33y ago with the ask held roughly flat each time — persistent listings suggest the price (not the market) is what's stuck; bring a comps-based counter.
- Current owner paid $174k; list at $379k implies a 118% gain — meaningful room to come down on a strong offer.
Risks & watch-outs
- Watch-outs: built in 1950 — expect roof / HVAC / electrical / plumbing capex.
- Climate carrying-cost: moderate flood risk — expect insurance premiums to compound above CPI over the hold.
Questions for the listing agent
- It's been on market 236 days. Have you received any prior offers? Is the seller open to a 12% concession, seller financing, or rate buy-down credit?
- Can we see the unit-by-unit rent roll, current vacancy, and any below-market leases? What's the average tenancy length?
- What capital expenditures (roof, boiler, parking lot, exteriors) have been made in the last 5 years, and what's planned in the next 2?
- Built in 1950 — when were the roof, HVAC, electrical panel, plumbing, and water heater last replaced?
- Why hasn't it sold? Are there any deal-killer items the seller is aware of (foundation, flood, title, zoning, code violations)?
- Is there a deadline driving the sale (1031 exchange, divorce, estate, relocation)? That informs how much negotiation room exists.
- Schools are A-rated — typically a magnet for longer-tenancy family renters. What's the average tenant stay here, and is there a school-zone premium baked into asking?
- The area grade is low — what's the realistic commute time and amenity access for the typical tenant pool here? Any planned neighborhood developments (good or bad) we should know about?
- What's the average days-on-market for RENTAL listings here right now (not sales)? A rising rental-DOM trend means longer vacancies and softer asking-rent achievability than the comps imply.
- What's the recent tenant-quality profile in this submarket — average credit score on applications, eviction rate, late-payment / NSF rate, and stable-employment percentage? A property-management company in the area should have these aggregated.
- How much new apartment / multifamily construction is in the pipeline within 1–3 miles? Heavy new supply (>2% of stock underway) typically softens rents 12–24 months out; light construction supports rent growth.
Investment metrics
- 1% rule
- 1.10% ✓
- Cap rate
- 8.12%
- Cash-on-cash
- 6.51%
- DSCR
- 1.29
- GRM
- 7.6
CMA / ARV
- ARV (median comp)
- $282,467
- List price
- $379,000
- Delta
- 34.18%
- Verdict
- OVERPRICED
- Comps
- 10 within 1.0 mi
Projected returns pro-forma
-3.0% appreciation · 6.95% rent growth · sell at horizon
- IRR
- -1.8%
- Equity multiple
- 0.93×
- Total profit
- $-7,457
- Equity at exit
- $56,510
- IRR
- 11.9%
- Equity multiple
- 2.11×
- Total profit
- $117,693
- Equity at exit
- $32,769
Cash invested: $106,120 (down + closing). Projections, not guarantees.
Landlord ↔ Tenant lean methodology
- Overall (STATE)
- 73 Landlord-Friendly
- State Ohio
- 73 Landlord-Friendly · R+6
- County
- — inherits STATE
- City
- — inherits STATE
ZIP-level market 44221
- Rents YoY
- 7.0%
- Active inventory
- 90
- Price-to-rent
- 31.4×
Monthly cashflow live
- Estimated rent
- $4,159 high interval (Pro) →
- Mortgage (P&I)
- −$1,988
- Tax from tax record
- −$565 /mo · $6,776/yr
- Insurance
- −$158
- HOA
- −$0
- Vacancy / Maint / Mgmt
- −$873
- Net cashflow
- $575
Break-even live
Sensitivity live
| Price | -10% $790 | -5% $683 | +0% $575 | +5% $468 | +10% $361 |
|---|---|---|---|---|---|
| Rent | -10% $247 | -5% $411 | +0% $575 | +5% $740 | +10% $904 |
| Rate | -1.0pp $766 | -0.5pp $672 | base $575 | +0.5pp $477 | +1.0pp $377 |
4-unit breakdown (identical units grouped — click to expand)
| Units | Beds | Baths | Est. rent |
|---|---|---|---|
| 3× units | 1 | 1 | $3,018 |
| #1 | 1 | 1 | $1,006 |
| #2 | 1 | 1 | $1,006 |
| #3 | 1 | 1 | $1,006 |
| 1× unit | 2 | 1 | $1,140 |
| Total (4 units) | $4,159 | ||
UW: 25.0% down · 7.5% · 30yr · 1.5% tax · 5.0% vac · 8.0% maint · 8.0% mgmt
Financing live
Cash to close
- Down payment
- $94,750
- Closing costs
- $11,370
- Reserves months
- —
- Total cash needed
- —
Loan-product check · same deal, 3 products live
Conventional
25% down · 7.5% · 30yr
- Down + closing
- —
- Monthly P&I
- —
- Monthly cashflow
- —
- DSCR
- —
- Eligible?
- —
Personal DTI + credit; lowest rate.
DSCR
20% down · 8.5% · 30yr
- Down + closing
- —
- Monthly P&I
- —
- Monthly cashflow
- —
- DSCR
- —
- Eligible?
- —
No personal income docs; deal must DSCR.
Hard money
10% down · 12.0% · 12mo
- Down + closing
- —
- Monthly P&I
- —
- Monthly cashflow
- —
- DSCR
- —
- Eligible?
- —
Short-term bridge; refi at stabilization.
Listing history 16 events
-
2026-06-02days on market $379,000 Active 236 DOM
-
2026-06-01days on market $379,000 Active 235 DOM
-
2026-05-31days on market $379,000 Active 234 DOM
-
2026-05-31days on market $379,000 Active 233 DOM
-
2025-10-09$379,000 Active 842-char remark
Show marketing remark (842 chars)
Fantastic opportunity to own this all brick 4 unit rental property with a new (2023) $40,000 roof and a fully waterproofed basement! Also One of the one bedroom units and shared space was just fully renovated with new floors, cabinets, counters, and paint throughout. Located on a prime residential corner in Cuyahoga falls this property is a great way to jumpstart your real estate investment goals or make an addition to your portfolio for under $95,000 per unit. Featuring three one bedroom units and one two bedroom unit these rentals will always be in high demand. All four units have newer kitchen appliances and hardwood floors. Each unit has its own exterior door and can be accessed through a common area hall way which also provides access to the basement with storage and laundry. Call today to make this one your next Investment!!
-
2025-08-18historical
-
2024-10-18$379,900 Active
-
2013-12-17soldstatus $174,000
-
2013-12-16soldstatus $174,000
-
2013-08-23$189,500
-
2013-05-02historical
-
2012-08-30$169,000
-
1996-08-07soldstatus $137,000
-
1993-07-22soldstatus $114,000
-
1993-05-24$129,500
-
1987-05-05soldstatus $80,000
ⓘ Source: listings_history table (triggers on properties + properties_extension) + one-shot
backfill from property_details.listing_events for pre-trigger history.
Tax reassessment forecast OH · Partial reset (capped growth)
- Current annual tax
- $6,776 · $565/mo
- Projected year-2 tax
- $6,776 · $565/mo
- Expected delta
- $0/yr ($0/mo · 0.0%)
ⓘ Screening estimate from a state-policy table — verify with the county assessor before closing.
Climate risk First Street
- Flood 5/10 Major FEMA zone X (unshaded) · 65% chance over 30 yrs
- Wildfire 1/10 Low
- Heat 3/10 Moderate 7 d/yr ≥98°F today · 17 d/yr by 30 yrs out
- Wind 1/10 Low
- Air quality 3/10 Moderate 2 unhealthy d/yr today · 4 by 30 yrs out
Nearby sold comps map
Loading sold comps map…
Walkable amenities ~0.75 mi
Loading nearby amenities…
Taxation est. · year 1
- Rental income
- $49,908
- − Mortgage interest
- −$21,230
- − Property taxes
- −$6,776
- − Insurance
- −$1,895
- − Repairs & maintenance
- −$3,993
- − Management
- −$3,993
- − Depreciation
- −$11,025
- Taxable income
- $996
- Est. tax owed @ 24.0%
- −$239
- After-tax cash flow
- $6,667/yr
For passive investors: Depreciation is non-cash, so a rental often shows a tax loss while cash-flowing — sheltering income. Rental losses are passive: they offset passive income freely, and up to $25,000/yr can offset ordinary (W-2) income if you actively participate and your MAGI is under $100k (phasing out to $0 by $150k); unused losses carry forward. On sale, claimed depreciation is recaptured at up to 25%, and gains may owe capital-gains tax (a 1031 exchange can defer both). Figures are a year-1 estimate at your 24.0% rate — not tax advice; consult a CPA.
Schools (NCES district)
- District
- Cuyahoga Falls City
- NCES district ID
- 3904383
- Math proficiency
- 47% ▼ -18.00%
- Reading proficiency
- 58% ▼ -7.00%
- Median HH income
- $49,587
- Composite
- 44.78/100
- National rank
- #2746
- State rank
- #408 of 656 in OH
Livability — Cuyahoga Falls
- Score
- 83/100
- State rank
- #60
- US rank
- #870
Category grades
Schools grade is shown separately in the Schools card above.
Census & demographics
- Census place
- Cuyahoga Falls, OH
- County
- Summit County · 440,783 people
- City population
- 47,005
- Metro
- Akron, OH
- Population (ZIP)
- 28,546
- Household income
- $63,342
- Rent vs Own
- Severe rent burden
- 1080.0
Population outlook (Summit County) Hauer SSP2
- Today (2025)
- 546,583 people
- By 2030
- 544,028 · -0.5%
- By 2040
- 531,363 · -2.8%
- By 2050
- 514,923 · -5.8%
- By 2075
- 481,765 · -11.9%
- By 2100
- 432,265 · -20.9%
Race, ethnicity, and origin ACS 2023
- Neighborhood character
- Predominantly White (81%)
- Race & ethnicity
- White 81% Asian 7% Black 5% Two or more races 5% Hispanic / Latino 2%
- Common ancestry
- Romanian 4% Lithuanian 2% Scotch-Irish 2%
- Foreign-born
- 7% · India, China, Canada
- Languages at home
- 90% English-only · Other Indo-European 6% Other Asian/Pacific 1% German/W. Germanic 1%
Political lean MEDSL · Summit
- 2024 margin
- Lean D (+7.0) · D 53.0% · R 46.0%
- 2008→2024 swing
- -9.6pp toward R · 2008: 16.6pp · 2024: 7.0pp
- All cycles
- 2024: D+7.0 2020: D+9.6 2016: D+8.2 2012: D+14.8 2008: D+16.6
Not yet ingested
- Civics
- —
Market trends
- HPI YoY
- ▼ -222.74%
- Current HPI
- 213.5428
- Rent YoY
- ▲ 6.95%
- Metro
- Akron, OH
- State GDP YoY
- ▲ 1.98%
- F500 in state
- 48
Industry mix (Fortune 500 HQ in OH)
| Industry | F500 HQs | Revenue |
|---|---|---|
| Insurance | 3 | $145B |
|
||
| Industrial Machinery | 3 | $49B |
|
||
| Financial Services | 3 | $24B |
|
||
| Consumer Goods | 2 | $93B |
|
||
| Aerospace / Defense | 2 | $47B |
|
||
| Utilities | 2 | $33B |
|
||
Price history
+373.8% since first listed12 events — show timeline
- 2025-10-09 Listed $379,000 MLSNOW
- 2025-08-18 Listing Removed — MLSNOW
- 2024-10-18 Listed $379,900 MLSNOW
- 2013-12-17 Sold (Public Records) $174,000 Public Records
- 2013-12-16 Sold (MLS) $174,000 MLSNOW
- 2013-08-23 Listed $189,500 MLSNOW
- 2013-05-02 Listing Removed — MLSNOW
- 2012-08-30 Listed $169,000 MLSNOW
- 1996-08-07 Sold (Public Records) $137,000 Public Records
- 1993-07-22 Sold (Public Records) $114,000 Public Records
- 1993-05-24 Listed $129,500 MLSNOW
- 1987-05-05 Sold (Public Records) $80,000 Public Records
Property tax history
+4.3%/yrLatest (2025): $6,776 · -1.0% YoY. Source: county tax records.
Cash-flow waterfall
monthlySold comps — $/sqft
last 12 mo · ≤1 miLoading sold comps…