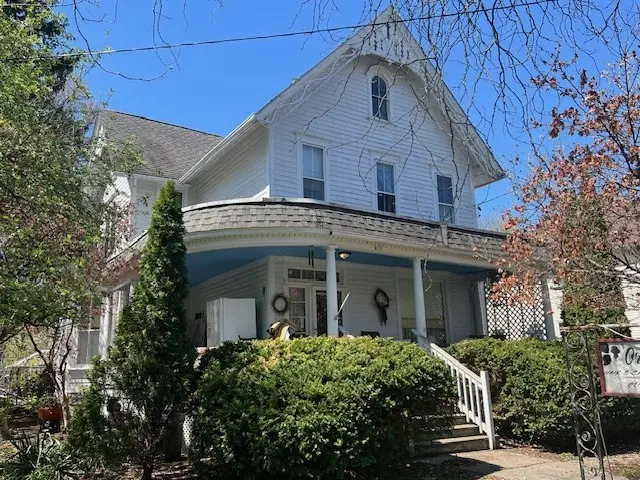
419 Loder St · Waverly, NY
Flood risk 3/10 · Minor
- FEMA flood zone
- X (unshaded)
- Chance of flooding over 30 yrs
- 0.2%
- Est. flood insurance / yr
- $473 – $860
Fire risk 2/10 · Minimal
- Est. fire insurance / yr
- $691 – $1,283
Heat risk 3/10 · Minor
- Hot days now (above 96°F)
- 7 days/yr
- Hot days in 30 yrs
- 16 days/yr
Wind risk 2/10 · Minimal
- Chance of severe wind over 30 yrs
- 2.0%
Air-quality risk 2/10 · Minimal
- Unhealthy air days now
- 0 days/yr
- Unhealthy air days in 30 yrs
- 1 days/yr
Risk factors via First Street. Map © Google.
Why this score? — see what drove the C grade
The composite is a weighted blend of 9 inputs, each scored 0–100. Each bar is that input's sub-score; the figure is the points it added to the 100-point composite (weight × sub-score).
- Cash flow +15.8/30.0
- ARV discount +15.0/15.0
- Appreciation +6.4/10.0
- 1% rule +5.7/10.0
- DSCR +4.9/10.0
- Schools +3.7/10.0
- Livability +3.4/5.0
- Rent growth +2.5/5.0
- Condition / age +2.5/5.0
$125,000
🖨 Deal sheet 📄 Offer letter ✓ Due diligence
Listing remarks MLS
Classic character and timeless curb appeal define this striking Waverly home. Featuring ornate exterior trim, a welcoming covered front porch, and a side driveway for off-street parking, 419 Loder St. offers the kind of architectural charm that is hard to find. Inside, you’ll find a grand curved staircase, original woodwork, hardwood floors, French doors, bayed windows, and spacious rooms filled with vintage detail. The large kitchen offers abundant cabinetry and overlooks the backyard, while the main living spaces provide excellent scale and flexibility for everyday living or future updates. Rich with period character and ready for its next chapter, this property is a wonderful opportunity for someone looking to restore and personalize a classic home in a convenient Waverly location. Property selling "AS-IS / WHERE-IS" and will not be completely cleaned out. Only offers with proof of funds will be considered. $1,500.00 minimum EMD. 24 Hours Notice Required.
Key facts
- Covered front porch
- Side driveway
- French doors
Tags
Neighborhood map
What this means for you Summary
Snapshot
- This is a 3-bed/1.5-bath single-family listed at $125k.
Deal economics
- At list price, monthly cash flow is $56 ($676/yr) — positive.
- The deal already cash-flows at list — no discount required.
- Meets the 1% rule at list price ($1k rent vs $125k).
- Recommended offer: $121k (3.0% below list) — sets the bar for market timing.
- Cap rate 6.8% vs local median 4.6% in Waverly — top-decile yield for the area; either an underpriced asset or a hidden risk that comps aren't pricing in. Stress-test before assuming the spread holds.
Location & tenants
- Location reads 67/100 on livability (#569 in NY) — a middle-class / working-renter tenant base. Strengths: cost of living A+, housing A+, health & safety A; Watch: amenities F, commute F, employment F.
- Waverly Central School District (town): math 41% / reading 46% proficiency, ranked #480 of 590 in NY (top 81%) — families likely to look elsewhere, expect single-tenant / working-renter base with shorter leases.
- Market conditions: 53 active listings in the ZIP; 139 units permitted in Tioga County in 2024 (65 in 5+ unit buildings).
Forward outlook
- In year one you build about $4k of equity ($864 loan paydown + $3k appreciation (2.8% local appreciation)).
- Tioga County population projected at -27% by 2050 — secular population decline; favor cash flow + early exit over multi-decade hold.
- At projected returns (2.8% appreciation + 3.0% rent growth), your $35k cash investment doubles in ~6 years — after that, you're playing with house money.
- By year 8, paydown + projected appreciation supports a ~$32k cash-out refi (75% LTV) — recoverable capital for the next deal without selling this one.
Negotiation context
- It's been on market 57 days — a 3% lower offer ($121k) is reasonable based on typical stale-listing flexibility.
Risks & watch-outs
- Watch-outs: property tax is 2.8% of price; built in 1890 — expect roof / HVAC / electrical / plumbing capex.
Questions for the listing agent
- It's been on market 57 days. Have you received any prior offers? Is the seller open to a 3% concession, seller financing, or rate buy-down credit?
- Built in 1890 — when were the roof, HVAC, electrical panel, plumbing, and water heater last replaced?
- Property tax is high relative to price — has the assessment been appealed recently, and will the sale trigger a re-assessment?
- Is there a deadline driving the sale (1031 exchange, divorce, estate, relocation)? That informs how much negotiation room exists.
- What's the average days-on-market for RENTAL listings here right now (not sales)? A rising rental-DOM trend means longer vacancies and softer asking-rent achievability than the comps imply.
- What's the recent tenant-quality profile in this submarket — average credit score on applications, eviction rate, late-payment / NSF rate, and stable-employment percentage? A property-management company in the area should have these aggregated.
- How much new for-sale + rental construction is in the pipeline within 1–3 miles? Heavy new supply typically softens prices + rents 12–24 months out; constrained supply supports both.
Investment metrics
- 1% rule
- 1.07% ✓
- Cap rate
- 6.83%
- Cash-on-cash
- 1.93%
- DSCR
- 1.09
- GRM
- 7.8
CMA / ARV
- ARV (median comp)
- $204,044
- List price
- $125,000
- Delta
- -38.74%
- Verdict
- UNDERPRICED
- Comps
- 20 within 1.0 mi
Show comp detail 11 sales within ~0.75 mi
| Address | Dist | Beds/Ba | Sqft | Sold | Price | $/sf | Match |
|---|---|---|---|---|---|---|---|
| 40 Pine St | 0.23mi | 4/2.0 (+1) | 2,432 (+0%) | 13mo | $222,450 | $91 | 71 |
| 427 Pennsylvania Ave | 0.31mi | 3/2.0 | 2,330 (-4%) | 15mo | $140,000 | $60 | 64 |
| 439 Park Ave | 0.28mi | 4/1.5 (+1) | 2,451 (+1%) | 21mo | $45,000 | $18 | 63 |
| 111 Tracy Rd | 0.31mi | 3/2.5 | 2,456 (+1%) | 21mo | $275,000 | $112 | 62 |
| 520 Fulton St | 0.40mi | 4/2.0 (+1) | 2,219 (-9%) | 1mo | $91,490 | $41 | 59 |
| 326 Chemung St | 0.44mi | 4/1.5 (+1) | 2,311 (-5%) | 10mo | $65,000 | $28 | 58 |
| 494 Fulton St | 0.28mi | 4/1.5 (+1) | 2,248 (-8%) | 17mo | $225,000 | $100 | 56 |
| 434 Clark St | 0.08mi | 4/2.0 (+1) | 2,136 (-12%) | 16mo | $176,600 | $83 | 55 |
| 446 Pennsylvania Ave | 0.40mi | 4/1.5 (+1) | 2,151 (-12%) | 6mo | $140,000 | $65 | 52 |
| 59 Lincoln St | 0.63mi | 4/2.0 (+1) | 2,587 (+6%) | 4mo | $275,000 | $106 | 50 |
| 32 Lyman Ave | 0.61mi | 3/1.0 | 2,066 (-15%) | 12mo | $175,000 | $85 | 34 |
Match score weights: distance 35% · size 25% · config 20% · recency 20%. Top-matched comps best support the ARV.
Projected returns pro-forma
2.78% appreciation · 3.0% rent growth · sell at horizon
- IRR
- 8.7%
- Equity multiple
- 1.49×
- Total profit
- $17,292
- Equity at exit
- $54,652
- IRR
- 11.4%
- Equity multiple
- 2.67×
- Total profit
- $58,520
- Equity at exit
- $83,037
Cash invested: $35,000 (down + closing). Projections, not guarantees.
Landlord ↔ Tenant lean methodology
- Overall (STATE)
- 15 Strongly Tenant-Friendly
- State New York
- 15 Strongly Tenant-Friendly · D+10
- County
- — inherits STATE
- City
- — inherits STATE
ZIP-level market 14892
- Home prices YoY
- 1.2%
- Active inventory
- 53
- Price-to-rent
- 7.8×
Monthly cashflow live
- Estimated rent
- $1,338 medium interval (Pro) →
- Mortgage (P&I)
- −$656
- Tax from tax record
- −$293 /mo · $3,514/yr
- Insurance
- −$52
- HOA
- −$0
- Vacancy / Maint / Mgmt
- −$281
- Net cashflow
- $56
Break-even live
UW: 25.0% down · 7.5% · 30yr · 1.5% tax · 5.0% vac · 8.0% maint · 8.0% mgmt
Financing live
Cash to close
- Down payment
- $31,250
- Closing costs
- $3,750
- Reserves months
- —
- Total cash needed
- —
Loan-product check · same deal, 3 products live
Conventional
25% down · 7.5% · 30yr
- Down + closing
- —
- Monthly P&I
- —
- Monthly cashflow
- —
- DSCR
- —
- Eligible?
- —
Personal DTI + credit; lowest rate.
DSCR
20% down · 8.5% · 30yr
- Down + closing
- —
- Monthly P&I
- —
- Monthly cashflow
- —
- DSCR
- —
- Eligible?
- —
No personal income docs; deal must DSCR.
Hard money
10% down · 12.0% · 12mo
- Down + closing
- —
- Monthly P&I
- —
- Monthly cashflow
- —
- DSCR
- —
- Eligible?
- —
Short-term bridge; refi at stabilization.
Listing history 15 events
-
2026-06-18days on market $125,000 Active 57 DOM
-
2026-06-17days on market $125,000 Active 56 DOM
-
2026-06-16days on market $125,000 Active 55 DOM
-
2026-06-15days on market $125,000 Active 54 DOM
-
2026-06-13days on market $125,000 Active 52 DOM
-
2026-06-12days on market $125,000 Active 51 DOM
-
2026-06-09days on market $125,000 Active 48 DOM
-
2026-06-08days on market $125,000 Active 47 DOM
-
2026-06-07days on market $125,000 Active 46 DOM
-
2026-06-07days on market $125,000 Active 45 DOM
-
2026-06-04days on market $125,000 Active 42 DOM
-
2026-06-02days on market $125,000 Active 41 DOM
-
2026-06-01days on market $125,000 Active 40 DOM
-
2026-05-31days on market $125,000 Active 39 DOM
-
2026-04-22$125,000 Active 988-char remark
Show marketing remark (988 chars)
Classic character and timeless curb appeal define this striking Waverly home. Featuring ornate exterior trim, a welcoming covered front porch, and a side driveway for off-street parking, 419 Loder St. offers the kind of architectural charm that is hard to find. Inside, you’ll find a grand curved staircase, original woodwork, hardwood floors, French doors, bayed windows, and spacious rooms filled with vintage detail. The large kitchen offers abundant cabinetry and overlooks the backyard, while the main living spaces provide excellent scale and flexibility for everyday living or future updates. Rich with period character and ready for its next chapter, this property is a wonderful opportunity for someone looking to restore and personalize a classic home in a convenient Waverly location. Property selling "AS-IS / WHERE-IS" and will not be completely cleaned out. Only offers with proof of funds will be considered. $1,500.00 minimum EMD. 24 Hours Notice Required.
ⓘ Source: listings_history table (triggers on properties + properties_extension) + one-shot
backfill from property_details.listing_events for pre-trigger history.
Tax reassessment forecast NY · Partial reset (capped growth)
- Current annual tax
- $3,514 · $293/mo
- Projected year-2 tax
- $3,514 · $293/mo
- Expected delta
- $0/yr ($0/mo · 0.0%)
ⓘ Screening estimate from a state-policy table — verify with the county assessor before closing.
Climate risk First Street
- Flood 3/10 Moderate FEMA zone X (unshaded) · 20% chance over 30 yrs
- Wildfire 2/10 Low
- Heat 3/10 Moderate 7 d/yr ≥96°F today · 16 d/yr by 30 yrs out
- Wind 2/10 Low 2% chance of damaging wind over 30 yrs
- Air quality 2/10 Low 0 unhealthy d/yr today · 1 by 30 yrs out
Nearby sold comps map
Loading sold comps map…
Walkable amenities ~0.75 mi
Loading nearby amenities…
Taxation est. · year 1
- Rental income
- $16,053
- − Mortgage interest
- −$7,002
- − Property taxes
- −$3,514
- − Insurance
- −$625
- − Repairs & maintenance
- −$1,284
- − Management
- −$1,284
- − Depreciation
- −$3,636
- Taxable loss
- −$1,293
- Est. tax savings @ 24.0%
- +$310
- After-tax cash flow
- $987/yr
For passive investors: Depreciation is non-cash, so a rental often shows a tax loss while cash-flowing — sheltering income. Rental losses are passive: they offset passive income freely, and up to $25,000/yr can offset ordinary (W-2) income if you actively participate and your MAGI is under $100k (phasing out to $0 by $150k); unused losses carry forward. On sale, claimed depreciation is recaptured at up to 25%, and gains may owe capital-gains tax (a 1031 exchange can defer both). Figures are a year-1 estimate at your 24.0% rate — not tax advice; consult a CPA.
Schools (NCES district)
- District
- Waverly Central School District
- NCES district ID
- 3630270
- Math proficiency
- 41% ▼ -4.00%
- Reading proficiency
- 46% ▲ 8.00%
- Median HH income
- $44,935
- Composite
- 36.9/100
- National rank
- #4544
- State rank
- #480 of 590 in NY
Livability — Waverly
- Score
- 67/100
- State rank
- #569
- US rank
- #10246
Category grades
Schools grade is shown separately in the Schools card above.
Census & demographics
- Census place
- Waverly, NY
- Population (ZIP)
- 7,531
Population outlook (Tioga County) Hauer SSP2
- Today (2025)
- 45,155 people
- By 2030
- 42,801 · -5.2%
- By 2040
- 37,960 · -15.9%
- By 2050
- 33,071 · -26.8%
- By 2075
- 24,144 · -46.5%
- By 2100
- 16,545 · -63.4%
Race, ethnicity, and origin ACS 2023
- Neighborhood character
- Predominantly White (93%)
- Race & ethnicity
- White 93% Hispanic / Latino 2% Two or more races 2% Black 1% Asian 1%
- Common ancestry
- Iranian 3% Romanian 3% Italian 2%
- Foreign-born
- 2%
- Languages at home
- 98% English-only · German/W. Germanic 1% Tagalog/Filipino 1%
Political lean MEDSL · Tioga
- 2024 margin
- Strong R (+22.9) · D 38.6% · R 61.4%
- 2008→2024 swing
- -12.7pp toward R · 2008: -10.2pp · 2024: -22.9pp
- All cycles
- 2024: R+22.9 2020: R+20.6 2016: R+27.6 2012: R+15.1 2008: R+10.2
Not yet ingested
- Civics
- —
Market trends
- HPI YoY
- ▲ 2.78%
- Current HPI
- 236.7714
- Rent YoY
- —
- Metro
- —
- State GDP YoY
- ▲ 2.60%
- F500 in state
- 92
Industry mix (Fortune 500 HQ in NY)
| Industry | F500 HQs | Revenue |
|---|---|---|
| Financial Services | 10 | $950B |
|
||
| Consumer Goods | 9 | $162B |
|
||
| Insurance | 4 | $225B |
|
||
| Telecommunications | 2 | $144B |
|
||
| Pharmaceuticals | 2 | $112B |
|
||
| Media / Entertainment | 2 | $69B |
|
||
Price history
1 event — show timeline
- 2026-04-22 Listed $125,000 UNYREIS
Property tax history
+17.5%/yrLatest (2025): $3,514 · +9.6% YoY. Source: county tax records.
Cash-flow waterfall
monthlySold comps — $/sqft
last 12 mo · ≤1 miLoading sold comps…