 🌊 Lakefront
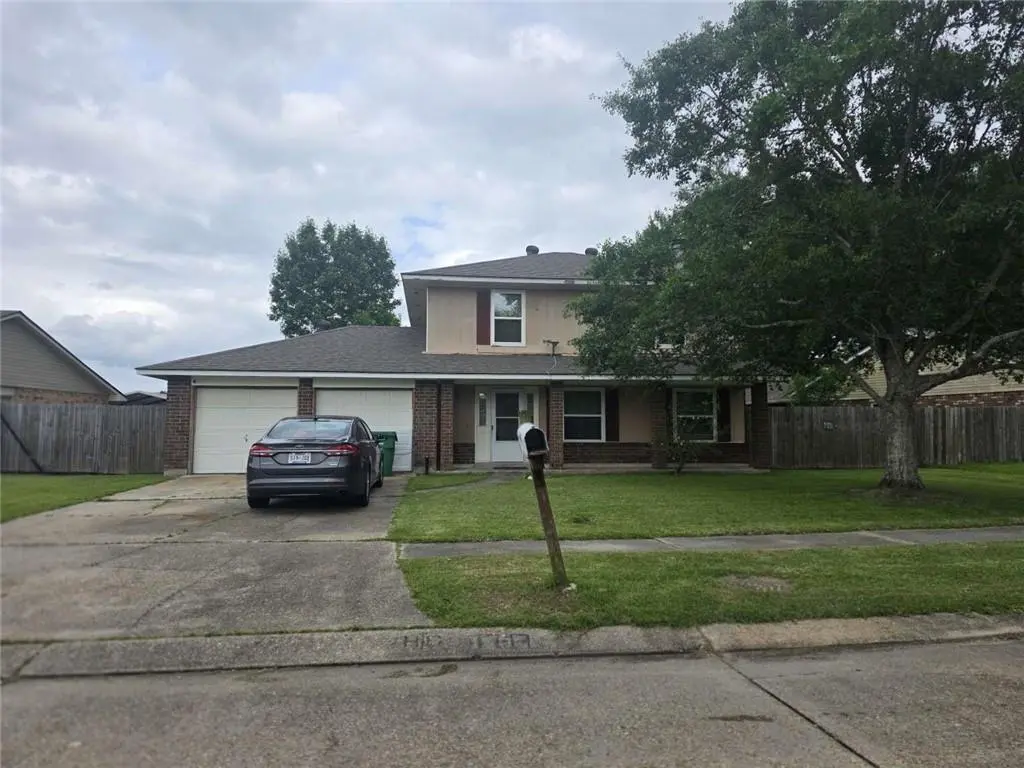
1800 W Frisco Dr · Laplace, LA
Flood risk 9/10 · Severe
- FEMA flood zone
- X (shaded)
- Chance of flooding over 30 yrs
- 0.99%
- Est. flood insurance / yr
- $507 – $1,088
Fire risk 1/10 · Minimal
- Est. fire insurance / yr
- $1,269 – $2,357
Heat risk 9/10 · Severe
- Hot days now (above 108°F)
- 7 days/yr
- Hot days in 30 yrs
- 22 days/yr
Wind risk 9/10 · Severe
- Chance of severe wind over 30 yrs
- 99.0%
Air-quality risk 3/10 · Minor
- Unhealthy air days now
- 2 days/yr
- Unhealthy air days in 30 yrs
- 3 days/yr
Risk factors via First Street. Map © Google.
Why this score? — see what drove the B- grade
The composite is a weighted blend of 9 inputs, each scored 0–100. Each bar is that input's sub-score; the figure is the points it added to the 100-point composite (weight × sub-score).
- Cash flow +25.7/30.0
- ARV discount +15.0/15.0
- DSCR +8.6/10.0
- 1% rule +5.6/10.0
- Livability +3.5/5.0
- Rent growth +2.5/5.0
- Condition / age +2.5/5.0
- Schools +1.7/10.0
- Appreciation +0.0/10.0
$179,900
🖨 Deal sheet 📄 Offer letter ✓ Due diligence
Listing remarks MLS
This 4-bed, 2.5-bath property features a 2-car attached garage, a cozy living room fireplace, and a formal dining room. The expanded kitchen and adjoining breakfast nook boast new cabinetry and countertops. Enjoy the private retention pond in the backyard! Recent updates include a 4-year-old roof, refreshed master bath, new windows, and newer downstairs flooring. Ideal for buyers looking to add their finishing touches to complete the remaining cosmetic projects.
Key facts
- 8,572 sq ft lot
- Garage
- Built 1983
Property features AI
Finance
- Other: No additional finance-related amenities provided
- Financial info: Financial details not provided
- HOA & community: HOA/community details not provided
Exterior
- Parking: Attached garage; Driveway; Garage available
- Security: Security details not provided
- Utilities: Public water; Public sewer
- Home design: 2-story property; Entry level not specified; Facing direction not specified
- Construction: Slab foundation; Construction condition listed as average
- Exterior features: City lot; Irregular lot
Interior
- Kitchen: Kitchen details not provided
- Bedrooms: Bedrooms not specified
- Flooring: Flooring details not provided
- Bathrooms: 2 full bathrooms; 1 half bathroom
- Heating & cooling: Central heating; Central air conditioning
- Interior features: 6 total rooms; Average condition
- Laundry & utility: Laundry details not provided
Neighborhood map
What this means for you Summary
Snapshot
- This is a 4-bed/2.5-bath single-family listed at $180k.
Deal economics
- At list price, monthly cash flow is $365 ($4k/yr) — positive.
- The deal already cash-flows at list — no discount required.
- Meets the 1% rule at list price ($2k rent vs $180k).
- Recommended offer: $175k (3.0% below list) — sets the bar for market timing.
- Cap rate 9.2% vs local median 4.8% in Laplace — top-decile yield for the area; either an underpriced asset or a hidden risk that comps aren't pricing in. Stress-test before assuming the spread holds.
Location & tenants
- Location reads 70/100 on livability (#61 in LA) — a middle-class / working-renter tenant base. Strengths: cost of living A+, housing A+, health & safety A+; Watch: crime F, amenities F, commute F.
- St. John The Baptist Parish (suburban): math 13% / reading 25% proficiency, ranked #68 of 98 in LA (top 69%) — low school quality limits family demand, transient renter base, plan for 1-2y turnover; 82% free/reduced lunch — lower-income household profile, screen leases tightly.
- Market conditions: 180 active listings in the ZIP; 1 comparable units currently listed for rent nearby; 61 units permitted in St. John the Baptist Parish in 2024 (0 in 5+ unit buildings).
- This rent runs 34% of the median local income ($68k/yr) — at the standard rent-burdened threshold; future hikes will face affordability resistance.
Forward outlook
- Local home prices are declining (-3.0%/yr); year-one equity from $1k of loan paydown is wiped out by about $5k of value loss. Plan a longer hold.
- St. John the Baptist County population projected at -20% by 2050 — secular population decline; favor cash flow + early exit over multi-decade hold.
Negotiation context
- It's been on market 42 days — a 3% lower offer ($175k) is reasonable based on typical stale-listing flexibility.
- 8 sale attempts since 32y ago; this cycle's ask has dropped $10k (5%) from the opening price — seller is motivated, your offer sets the floor, not the list.
- Current owner paid $138k; 30% above their basis — modest negotiation headroom, anchor on the comps not their cost.
Risks & watch-outs
- Watch-outs: flood insurance adds $66/mo.
- Climate carrying-cost: severe flood risk; severe wind risk, 99% chance of damaging wind over 30y; extreme-heat days projected 7→22/yr by 2055 (HVAC capex compounding) — expect insurance premiums to compound above CPI over the hold.
Questions for the listing agent
- It's been on market 42 days. Have you received any prior offers? Is the seller open to a 3% concession, seller financing, or rate buy-down credit?
- What's the actual annual flood-insurance premium (NFIP or private), and is the property in a SFHA with mandatory coverage?
- Is there a deadline driving the sale (1031 exchange, divorce, estate, relocation)? That informs how much negotiation room exists.
- Crime grade is F in this area — have there been break-ins, vandalism, or insurance claims at this property in the last 3 years? What carrier currently insures it and at what premium?
- This sits on a lake — are riparian / water-frontage rights deeded with the parcel? Any dock permits, shoreline easements, or HOA water-use restrictions?
- What's the documented flood / surge / shoreline-erosion history here (FEMA AND non-FEMA — e.g., storm surge, creek backup, septic-field saturation)?
- Any water-quality or seasonal algae-bloom issues that affect tenant satisfaction or short-term-rental demand?
- What's the average days-on-market for RENTAL listings here right now (not sales)? A rising rental-DOM trend means longer vacancies and softer asking-rent achievability than the comps imply.
- What's the recent tenant-quality profile in this submarket — average credit score on applications, eviction rate, late-payment / NSF rate, and stable-employment percentage? A property-management company in the area should have these aggregated.
- How much new for-sale + rental construction is in the pipeline within 1–3 miles? Heavy new supply typically softens prices + rents 12–24 months out; constrained supply supports both.
Investment metrics
- 1% rule
- 1.06% ✓
- Cap rate
- 9.17%
- Cash-on-cash
- 10.27%
- DSCR
- 1.46
- GRM
- 7.8
CMA / ARV
- ARV (median comp)
- $220,783
- List price
- $179,900
- Delta
- -18.52%
- Verdict
- UNDERPRICED
- Comps
- 20 within 1.0 mi
Show comp detail 12 sales within ~0.75 mi
| Address | Dist | Beds/Ba | Sqft | Sold | Price | $/sf | Match |
|---|---|---|---|---|---|---|---|
| 424 Kenilworth Dr | 0.16mi | 4/2.0 | 1,623 (-4%) | 6mo | $225,000 | $139 | 78 |
| 612 Fairway Dr | 0.12mi | 3/2.0 (-1) | 1,600 (-6%) | 5mo | $223,400 | $140 | 74 |
| 1604 Williamsburg Dr | 0.41mi | 4/2.0 | 1,764 (+4%) | 2mo | $218,900 | $124 | 71 |
| 1912 Williamsburg Dr | 0.43mi | 4/2.0 | 1,612 (-5%) | 5mo | $180,000 | $112 | 65 |
| 509 Chatsworth Dr | 0.40mi | 3/2.0 (-1) | 1,600 (-6%) | 4mo | $239,000 | $149 | 61 |
| 2324 Williamsburg Dr | 0.67mi | 3/2.0 (-1) | 1,628 (-4%) | 1mo | $182,500 | $112 | 54 |
| 1629 Yorktowne Dr | 0.33mi | 3/2.0 (-1) | 1,460 (-14%) | 6mo | $195,000 | $134 | 49 |
| 404 Lacour Dr | 0.52mi | 5/2.0 (+1) | 1,900 (+12%) | 2mo | $128,000 | $67 | 47 |
| 638 Colony Park Dr | 0.60mi | 3/2.5 (-1) | 1,875 (+10%) | 4mo | $185,000 | $99 | 46 |
| 705 Lemoyne Dr | 0.56mi | 3/2.0 (-1) | 1,500 (-12%) | 4mo | $148,000 | $99 | 44 |
| 701 La Salle Dr | 0.60mi | 3/2.0 (-1) | 1,490 (-12%) | 1mo | $192,000 | $129 | 44 |
| 2413 Yorktowne Dr | 0.69mi | 3/2.0 (-1) | 1,455 (-14%) | 2mo | $95,000 | $65 | 35 |
Match score weights: distance 35% · size 25% · config 20% · recency 20%. Top-matched comps best support the ARV.
Projected returns pro-forma
-3.0% appreciation · 3.0% rent growth · sell at horizon
- IRR
- -3.1%
- Equity multiple
- 0.88×
- Total profit
- $-5,955
- Equity at exit
- $26,824
- IRR
- 6.5%
- Equity multiple
- 1.49×
- Total profit
- $24,603
- Equity at exit
- $15,554
Cash invested: $50,372 (down + closing). Projections, not guarantees.
Landlord ↔ Tenant lean methodology
- Overall (STATE)
- 90 Strongly Landlord-Friendly
- State Louisiana
- 90 Strongly Landlord-Friendly · R+12
- County
- — inherits STATE
- City
- — inherits STATE
ZIP-level market 70068
- Home prices YoY
- -20.1%
- Active inventory
- 180
- Price-to-rent
- 7.8×
Monthly cashflow live
- Estimated rent
- $1,915 medium interval (Pro) →
- Mortgage (P&I)
- −$943
- Tax from tax record
- −$64 /mo · $762/yr
- Insurance
- −$75
- Flood insurance flood zone
- −$66 /mo · $798/yr
- HOA
- −$0
- Vacancy / Maint / Mgmt
- −$402
- Net cashflow
- $365
Break-even live
UW: 25.0% down · 7.5% · 30yr · 1.5% tax · 5.0% vac · 8.0% maint · 8.0% mgmt
Financing live
Cash to close
- Down payment
- $44,975
- Closing costs
- $5,397
- Reserves months
- —
- Total cash needed
- —
Loan-product check · same deal, 3 products live
Conventional
25% down · 7.5% · 30yr
- Down + closing
- —
- Monthly P&I
- —
- Monthly cashflow
- —
- DSCR
- —
- Eligible?
- —
Personal DTI + credit; lowest rate.
DSCR
20% down · 8.5% · 30yr
- Down + closing
- —
- Monthly P&I
- —
- Monthly cashflow
- —
- DSCR
- —
- Eligible?
- —
No personal income docs; deal must DSCR.
Hard money
10% down · 12.0% · 12mo
- Down + closing
- —
- Monthly P&I
- —
- Monthly cashflow
- —
- DSCR
- —
- Eligible?
- —
Short-term bridge; refi at stabilization.
Rent comps 1 comps
| Address | Beds | Baths | Sqft | Rent | $/sqft | DOM | Units | Dist |
|---|---|---|---|---|---|---|---|---|
| 1716 Yorktowne Dr Laplace, LA | 4.0 | 1.0 | 1509 | $1,500 | $0.99 | 23d | 1 | 0.34mi |
Listing history 27 events
-
2026-06-19days on market $179,900 Active 42 DOM
-
2026-06-18days on market $179,900 Active 41 DOM
-
2026-06-17days on market $179,900 Active 40 DOM
-
2026-06-16days on market $179,900 Active 39 DOM
-
2026-06-15days on market $179,900 Active 38 DOM
-
2026-06-14days on market $179,900 Active 36 DOM
-
2026-06-13days on market $179,900 Active 35 DOM
-
2026-06-10days on market $179,900 Active 33 DOM
-
2026-06-09days on market $179,900 Active 32 DOM
-
2026-06-08days on market $179,900 Active 31 DOM
-
2026-06-07days on market $179,900 Active 30 DOM
-
2026-06-02days on market $179,900 Active 25 DOM
-
2026-06-01days on market $179,900 Active 24 DOM
-
2026-05-31days on market $179,900 Active 23 DOM
-
2026-05-30days on market $179,900 Active 22 DOM
-
2026-05-08$189,900 Active 466-char remark
Show marketing remark (466 chars)
This 4-bed, 2.5-bath property features a 2-car attached garage, a cozy living room fireplace, and a formal dining room. The expanded kitchen and adjoining breakfast nook boast new cabinetry and countertops. Enjoy the private retention pond in the backyard! Recent updates include a 4-year-old roof, refreshed master bath, new windows, and newer downstairs flooring. Ideal for buyers looking to add their finishing touches to complete the remaining cosmetic projects.
-
2011-05-06soldstatus
-
2011-04-29soldstatus $137,900
Show marketing remark (349 chars)
LOVELY VIEW OF THE LAKE FROM BOTH THE EAT IN KITCHEN AND DINING/OFFICE AREA! 4 BEDROOMS AND 2.5 BATHS AND 1700 SQUARE FEET OF LIVING SPACE. THE DEN FEATURES A WOOD BURNING FIREPLACE AND LAMINATE FLOORING. SIT ON YOUR COVERED PATIO WITH A GLASS OF WINE AND ENJOY THE LOVELY LAKE VIEW. REAR YARD ACCESS WITH PLENTY OF ROOM FOR YOUR BOAT OR OTHER TOYS.
-
2011-02-08$137,900
Show marketing remark (349 chars)
LOVELY VIEW OF THE LAKE FROM BOTH THE EAT IN KITCHEN AND DINING/OFFICE AREA! 4 BEDROOMS AND 2.5 BATHS AND 1700 SQUARE FEET OF LIVING SPACE. THE DEN FEATURES A WOOD BURNING FIREPLACE AND LAMINATE FLOORING. SIT ON YOUR COVERED PATIO WITH A GLASS OF WINE AND ENJOY THE LOVELY LAKE VIEW. REAR YARD ACCESS WITH PLENTY OF ROOM FOR YOUR BOAT OR OTHER TOYS.
-
2007-07-27soldstatus $189,900
-
2007-05-26$195,000
-
2007-05-26$195,000
-
1995-02-03soldstatus $78,000
-
1994-11-13$81,000
-
1994-11-13$81,000
ⓘ Source: listings_history table (triggers on properties + properties_extension) + one-shot
backfill from property_details.listing_events for pre-trigger history.
Tax reassessment forecast LA · Resets to sale price
- Current annual tax
- $762 · $64/mo
- Projected year-2 tax
- $989 · $82/mo
- Expected delta
- +$227/yr (+$19/mo · 29.8%)
ⓘ Screening estimate from a state-policy table — verify with the county assessor before closing.
Climate risk First Street
- Flood 9/10 Extreme FEMA zone X (shaded) · 99% chance over 30 yrs
- Wildfire 1/10 Low
- Heat 9/10 Extreme 7 d/yr ≥108°F today · 22 d/yr by 30 yrs out
- Wind 9/10 Extreme 99% chance of damaging wind over 30 yrs
- Air quality 3/10 Moderate 2 unhealthy d/yr today · 3 by 30 yrs out
Nearby sold comps map
Loading sold comps map…
Walkable amenities ~0.75 mi
Loading nearby amenities…
Taxation est. · year 1
- Rental income
- $22,983
- − Mortgage interest
- −$10,077
- − Property taxes
- −$762
- − Insurance
- −$1,697
- − Repairs & maintenance
- −$1,839
- − Management
- −$1,839
- − Depreciation
- −$5,233
- Taxable income
- $1,536
- Est. tax owed @ 24.0%
- −$369
- After-tax cash flow
- $4,008/yr
For passive investors: Depreciation is non-cash, so a rental often shows a tax loss while cash-flowing — sheltering income. Rental losses are passive: they offset passive income freely, and up to $25,000/yr can offset ordinary (W-2) income if you actively participate and your MAGI is under $100k (phasing out to $0 by $150k); unused losses carry forward. On sale, claimed depreciation is recaptured at up to 25%, and gains may owe capital-gains tax (a 1031 exchange can defer both). Figures are a year-1 estimate at your 24.0% rate — not tax advice; consult a CPA.
Schools (NCES district)
- District
- St. John The Baptist Parish
- NCES district ID
- 2201530
- Math proficiency
- 13% ▼ -42.00%
- Reading proficiency
- 25% ▼ -39.00%
- Median HH income
- $50,280
- Composite
- 17.07/100
- National rank
- #9120
- State rank
- #68 of 98 in LA
Livability — Laplace
- Score
- 70/100
- State rank
- #61
- US rank
- #7898
Category grades
Schools grade is shown separately in the Schools card above.
Census & demographics
- Census place
- Laplace, LA
- County
- Saint John the Baptist Parish · 32,720 people
- Metro
- New Orleans-Metairie, LA
- Population (ZIP)
- 32,720
- Household income
- $68,459
- Rent vs Own
- Severe rent burden
- 750.0
Population outlook (St. John the Baptist County) Hauer SSP2
- Today (2025)
- 40,972 people
- By 2030
- 39,295 · -4.1%
- By 2040
- 35,902 · -12.4%
- By 2050
- 32,988 · -19.5%
- By 2075
- 28,661 · -30.0%
- By 2100
- 26,456 · -35.4%
Race, ethnicity, and origin ACS 2023
- Neighborhood character
- Diverse neighborhood (Simpson 0.62)
- Race & ethnicity
- Black 51% White 34% Hispanic / Latino 9% Two or more races 5% Asian 1%
- Hispanic origin (detail)
- Puerto Rican 1%
- Common ancestry
- Lithuanian 11%
- Foreign-born
- 5% · Canada
- Languages at home
- 91% English-only · Spanish 6% Tagalog/Filipino 1%
Political lean MEDSL · St. John the Baptist
- 2024 margin
- Strong D (+29.1) · D 64.0% · R 34.8% · Other 1.2%
- 2008→2024 swing
- +12.9pp toward D · 2008: 16.2pp · 2024: 29.1pp
- All cycles
- 2024: D+29.1 2020: D+28.2 2016: D+24.5 2012: D+26.3 2008: D+16.2
Not yet ingested
- Civics
- —
Market trends
- HPI YoY
- ▼ -60.04%
- Current HPI
- 239.1429
- Rent YoY
- —
- Metro
- New Orleans-Metairie, LA
- State GDP YoY
- ▲ 3.29%
- F500 in state
- 10
Industry mix (Fortune 500 HQ in LA)
| Industry | F500 HQs | Revenue |
|---|---|---|
| Telecommunications | 2 | $23B |
|
||
| Utilities | 1 | $12B |
|
||
| Wholesale / Distribution | 1 | $5B |
|
||
| Advertising | 1 | $2B |
|
||
Price history
+122.1% since first listed14 events — show timeline
- 2026-05-20 Price Changed $179,900 AcadianaMLS
- 2026-05-20 Price Changed $179,900 GSREIN
- 2026-05-08 Listed $189,900 GSREIN
- 2026-05-08 Listed $189,900 AcadianaMLS
- 2011-05-06 Sold (Public Records) — Public Records
- 2011-04-29 Sold (MLS) $137,900 GSREIN
- 2011-02-08 Listed $137,900 AcadianaMLS
- 2011-02-08 Listed $137,900 GSREIN
- 2007-07-27 Sold (MLS) $189,900 GSREIN
- 2007-05-26 Listed $195,000 GSREIN
- 2007-05-26 Listed $195,000 AcadianaMLS
- 1995-02-03 Sold (MLS) $78,000 GSREIN
- 1994-11-13 Listed $81,000 AcadianaMLS
- 1994-11-13 Listed $81,000 GSREIN
Property tax history
-5.4%/yrLatest (2025): $762 · +0.1% YoY. Source: county tax records.
Cash-flow waterfall
monthlySold comps — $/sqft
last 12 mo · ≤1 miLoading sold comps…