2209 Doc Holliday Rd · Burleson, TX
Flood risk No data
- FEMA flood zone
- —
- Chance of flooding over 30 yrs
- —
- Est. flood insurance / yr
- —
Fire risk No data
- Est. fire insurance / yr
- —
Heat risk No data
- Hot days now (above threshold)
- —
- Hot days in 30 yrs
- —
Wind risk No data
- Chance of severe wind over 30 yrs
- —
Air-quality risk No data
- Unhealthy air days now
- —
- Unhealthy air days in 30 yrs
- —
Risk factors via First Street. Map © Google.
Why this score? — see what drove the C+ grade
The composite is a weighted blend of 9 inputs, each scored 0–100. Each bar is that input's sub-score; the figure is the points it added to the 100-point composite (weight × sub-score).
- Cash flow +21.5/30.0
- ARV discount +15.0/15.0
- DSCR +6.9/10.0
- 1% rule +5.9/10.0
- Schools +4.5/10.0
- Livability +4.0/5.0
- Condition / age +4.0/5.0
- Rent growth +2.5/5.0
- Appreciation +0.0/10.0
$242,999
🖨 Deal sheet 📄 Offer letter ✓ Due diligence
Listing remarks MLS
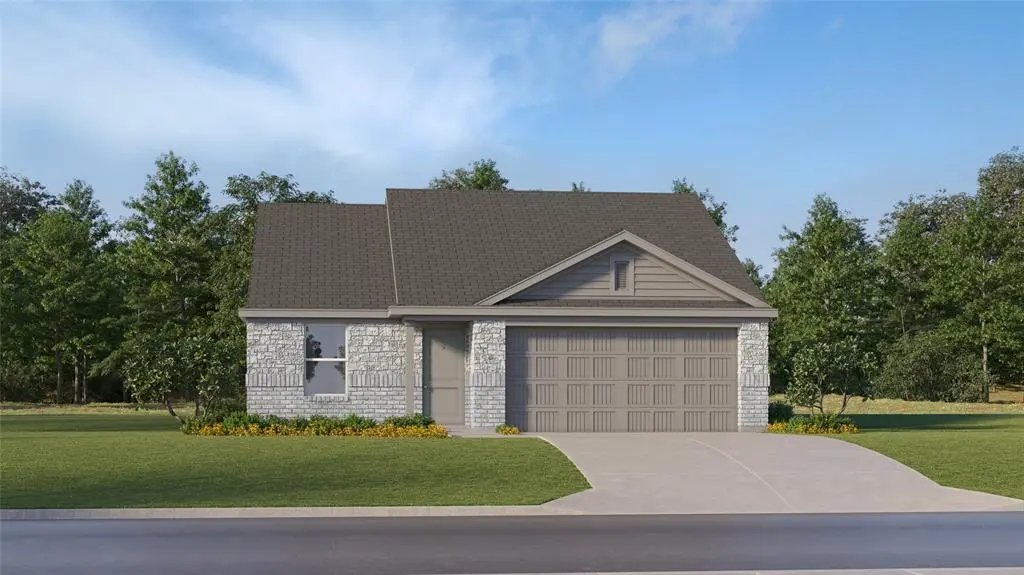
LENNAR - Frontier - Newlin Floorplan - This single-level home showcases a spacious open floorplan shared between the kitchen, dining area and family room for easy entertaining. An owner’s suite enjoys a private location in a rear corner of the home, complemented by an en-suite bathroom and walk-in closet. There are two secondary bedrooms at the front of the home, which are comfortable spaces for household members and overnight guests.
Key facts
- Walk-in closet
- Open floorplan
- Secondary bedrooms
Tags
Neighborhood map
What this means for you Summary
Snapshot
- This is a 3-bed/2.0-bath single-family listed at $243k. Condition is rated good.
Deal economics
- At list price, monthly cash flow is $364 ($4k/yr) — positive.
- The deal already cash-flows at list — no discount required.
- Meets the 1% rule at list price ($3k rent vs $243k).
- Recommended offer: $228k (6.0% below list) — sets the bar for market timing.
- Cap rate 8.1% vs local median 3.5% in Burleson — top-decile yield for the area; either an underpriced asset or a hidden risk that comps aren't pricing in. Stress-test before assuming the spread holds.
Location & tenants
- Location reads 79/100 on livability (#53 in TX, #2,133 nationally) — a middle-class / working-renter tenant base. Strengths: employment A+, cost of living A+, housing A+; Watch: amenities F, commute F.
- Joshua ISD (rural): math 52% / reading 50% proficiency, ranked #139 of 826 in TX (top 17%) — acceptable for families but not a draw, mixed tenant base, ~2y average lease.
- Market conditions: 420 active listings in the ZIP; 1 comparable units currently listed for rent nearby; 2,152 units permitted in Johnson County in 2024 (76 in 5+ unit buildings).
Forward outlook
- Local home prices are declining (-3.0%/yr); year-one equity from $2k of loan paydown is wiped out by about $7k of value loss. Plan a longer hold.
- Johnson County population projected at +24% by 2050 — long-run rental-demand tailwind backs the buy-and-hold thesis.
Negotiation context
- It's been on market 90 days — a 6% lower offer ($228k) is reasonable based on typical stale-listing flexibility.
Questions for the listing agent
- It's been on market 90 days. Have you received any prior offers? Is the seller open to a 6% concession, seller financing, or rate buy-down credit?
- What does the HOA fee cover, when was the last increase, and are there any pending special assessments or reserve-fund shortfalls?
- Why hasn't it sold? Are there any deal-killer items the seller is aware of (foundation, flood, title, zoning, code violations)?
- Is there a deadline driving the sale (1031 exchange, divorce, estate, relocation)? That informs how much negotiation room exists.
- What's the average days-on-market for RENTAL listings here right now (not sales)? A rising rental-DOM trend means longer vacancies and softer asking-rent achievability than the comps imply.
- What's the recent tenant-quality profile in this submarket — average credit score on applications, eviction rate, late-payment / NSF rate, and stable-employment percentage? A property-management company in the area should have these aggregated.
- How much new for-sale + rental construction is in the pipeline within 1–3 miles? Heavy new supply typically softens prices + rents 12–24 months out; constrained supply supports both.
Investment metrics
- 1% rule
- 1.09% ✓
- Cap rate
- 8.09%
- Cash-on-cash
- 6.42%
- DSCR
- 1.29
- GRM
- 7.6
CMA / ARV
- ARV (median comp)
- $325,932
- List price
- $242,999
- Delta
- -25.44%
- Verdict
- UNDERPRICED
- Comps
- 20 within 1.0 mi
Show comp detail 9 sales within ~0.75 mi
| Address | Dist | Beds/Ba | Sqft | Sold | Price | $/sf | Match |
|---|---|---|---|---|---|---|---|
| 2144 Jesse James Ln | 0.00mi | 3/2.0 | 1,461 (-4%) | 1mo | $219,849 | $150 | 92 |
| 2152 Jesse James Ln | 0.00mi | 3/2.0 | 1,451 (-5%) | 1mo | $228,999 | $158 | 92 |
| 2148 Jesse James Ln | 0.00mi | 4/2.0 (+1) | 1,656 (+9%) | 1mo | $240,999 | $146 | 79 |
| 2200 Doc Holiday Rd | 0.00mi | 3/2.0 | 1,302 (-14%) | 1mo | $246,999 | $190 | 75 |
| 2201 Doc Holiday Rd | 0.00mi | 4/2.0 (+1) | 1,720 (+13%) | 0mo | $256,999 | $149 | 73 |
| 2428 County Road 911 | 0.61mi | 3/2.0 | 1,442 (-5%) | 1mo | $390,000 | $270 | 62 |
| 2133 W Fm 917 | 0.45mi | 3/1.0 | 1,456 (-4%) | 9mo | $245,000 | $168 | 60 |
| 5824 Thousand Oaks Dr | 0.60mi | 4/2.0 (+1) | 1,580 (+4%) | 4mo | $269,900 | $171 | 58 |
| 5815 Thousand Oaks Dr | 0.72mi | 2/2.5 (-1) | 1,316 (-14%) | 13mo | $227,250 | $173 | 26 |
Match score weights: distance 35% · size 25% · config 20% · recency 20%. Top-matched comps best support the ARV.
Projected returns pro-forma
-3.0% appreciation · 3.0% rent growth · sell at horizon
- IRR
- -6.4%
- Equity multiple
- 0.76×
- Total profit
- $-16,110
- Equity at exit
- $36,232
- IRR
- 3.3%
- Equity multiple
- 1.24×
- Total profit
- $16,127
- Equity at exit
- $21,010
Cash invested: $68,040 (down + closing). Projections, not guarantees.
Landlord ↔ Tenant lean methodology
- Overall (STATE)
- 87 Strongly Landlord-Friendly
- State Texas
- 87 Strongly Landlord-Friendly · R+5
- County
- — inherits STATE
- City
- — inherits STATE
ZIP-level market 76058
- Home prices YoY
- -24.5%
- Active inventory
- 420
- Price-to-rent
- 7.6×
Monthly cashflow live
- Estimated rent
- $2,650 medium interval (Pro) →
- Mortgage (P&I)
- −$1,274
- Tax est. 1.5%
- −$304 /mo · $3,645/yr
- Insurance
- −$101
- HOA
- −$50
- Vacancy / Maint / Mgmt
- −$556
- Net cashflow
- $364
Break-even live
UW: 25.0% down · 7.5% · 30yr · 1.5% tax · 5.0% vac · 8.0% maint · 8.0% mgmt
Financing live
Cash to close
- Down payment
- $60,750
- Closing costs
- $7,290
- Reserves months
- —
- Total cash needed
- —
Loan-product check · same deal, 3 products live
Conventional
25% down · 7.5% · 30yr
- Down + closing
- —
- Monthly P&I
- —
- Monthly cashflow
- —
- DSCR
- —
- Eligible?
- —
Personal DTI + credit; lowest rate.
DSCR
20% down · 8.5% · 30yr
- Down + closing
- —
- Monthly P&I
- —
- Monthly cashflow
- —
- DSCR
- —
- Eligible?
- —
No personal income docs; deal must DSCR.
Hard money
10% down · 12.0% · 12mo
- Down + closing
- —
- Monthly P&I
- —
- Monthly cashflow
- —
- DSCR
- —
- Eligible?
- —
Short-term bridge; refi at stabilization.
Rent comps 1 comps
| Address | Beds | Baths | Sqft | Rent | $/sqft | DOM | Units | Dist |
|---|---|---|---|---|---|---|---|---|
| 1612 Caddo Peak Trl Joshua, TX | 3.0 | 3.0 | 1504 | $2,650 | $1.76 | 10d | 1 | 1.00mi |
HOA detail
- Monthly dues
- $50 · $600/yr
Listing history 16 events
-
2026-06-18days on market $242,999 Active 90 DOM
-
2026-06-17days on market $242,999 Active 89 DOM
-
2026-06-16days on market $242,999 Active 88 DOM
-
2026-06-15days on market $242,999 Active 87 DOM
-
2026-06-13days on market $242,999 Active 85 DOM
-
2026-06-10price $242,999 Active 81 DOM
-
2026-06-09days on market $239,149 Active 81 DOM
-
2026-06-08days on market $239,149 Active 80 DOM
-
2026-06-07days on market $239,149 Active 79 DOM
-
2026-06-04days on market $239,149 Active 76 DOM
-
2026-06-03days on market $239,149 Active 75 DOM
-
2026-06-02days on market $239,149 Active 74 DOM
-
2026-06-01days on market $239,149 Active 73 DOM
-
2026-05-31days on market $239,149 Active 72 DOM
-
2026-05-14price $239,149 444-char remark
Show marketing remark (444 chars)
LENNAR - Frontier - Newlin Floorplan - This single-level home showcases a spacious open floorplan shared between the kitchen, dining area and family room for easy entertaining. An owner’s suite enjoys a private location in a rear corner of the home, complemented by an en-suite bathroom and walk-in closet. There are two secondary bedrooms at the front of the home, which are comfortable spaces for household members and overnight guests.
-
2026-03-20$240,999 Active 444-char remark
Show marketing remark (444 chars)
LENNAR - Frontier - Newlin Floorplan - This single-level home showcases a spacious open floorplan shared between the kitchen, dining area and family room for easy entertaining. An owner’s suite enjoys a private location in a rear corner of the home, complemented by an en-suite bathroom and walk-in closet. There are two secondary bedrooms at the front of the home, which are comfortable spaces for household members and overnight guests.
ⓘ Source: listings_history table (triggers on properties + properties_extension) + one-shot
backfill from property_details.listing_events for pre-trigger history.
Nearby sold comps map
Loading sold comps map…
Walkable amenities ~0.75 mi
Loading nearby amenities…
Taxation est. · year 1
- Rental income
- $31,800
- − Mortgage interest
- −$13,612
- − Property taxes
- −$3,645
- − Insurance
- −$1,215
- − Repairs & maintenance
- −$2,544
- − Management
- −$2,544
- − HOA
- −$600
- − Depreciation
- −$7,069
- Taxable income
- $571
- Est. tax owed @ 24.0%
- −$137
- After-tax cash flow
- $4,233/yr
For passive investors: Depreciation is non-cash, so a rental often shows a tax loss while cash-flowing — sheltering income. Rental losses are passive: they offset passive income freely, and up to $25,000/yr can offset ordinary (W-2) income if you actively participate and your MAGI is under $100k (phasing out to $0 by $150k); unused losses carry forward. On sale, claimed depreciation is recaptured at up to 25%, and gains may owe capital-gains tax (a 1031 exchange can defer both). Figures are a year-1 estimate at your 24.0% rate — not tax advice; consult a CPA.
Condition & rehab AI · 1 photo
This single-family home is in good condition with a good exterior and interior. It is move-in ready with minor maintenance items to address.
Value-add opportunities
- Resale Paint exterior walls — Fresh paint enhances curb appeal and can increase the home's value.
- Rental Inspect and clean gutters — Clean gutters improve drainage and reduce the risk of water damage, which is beneficial for renters.
Renovation cost estimate screening
Value-add ROI direction
- Resale Paint exterior walls — Fresh paint enhances curb appeal and can increase the home's value. ↑
- Rental Inspect and clean gutters — Clean gutters improve drainage and reduce the risk of water damage, which is beneficial for renters. ↑
ⓘ Cost ranges are severity-bucket heuristics (US national rule-of-thumb). Get contractor quotes + a written scope before underwriting a rehab budget.
Schools (NCES district)
- District
- Joshua ISD
- NCES district ID
- 4824930
- Math proficiency
- 52% ▼ -7.00%
- Reading proficiency
- 50% ▼ -1.00%
- Median HH income
- $60,696
- Composite
- 44.65/100
- National rank
- #2769
- State rank
- #139 of 826 in TX
Livability — Burleson
- Score
- 79/100
- State rank
- #53
- US rank
- #2133
Category grades
Schools grade is shown separately in the Schools card above.
Census & demographics
- Census place
- Burleson, TX
- City population
- 81,549
- Population (ZIP)
- 21,531
Population outlook (Johnson County) Hauer SSP2
- Today (2025)
- 179,678 people
- By 2030
- 189,208 · +5.3%
- By 2040
- 207,261 · +15.4%
- By 2050
- 223,064 · +24.1%
- By 2075
- 259,979 · +44.7%
- By 2100
- 275,395 · +53.3%
Race, ethnicity, and origin ACS 2023
- Neighborhood character
- Predominantly White (67%)
- Race & ethnicity
- White 67% Hispanic / Latino 28% Two or more races 11% Black 2%
- Hispanic origin (detail)
- Mexican 26%
- Common ancestry
- Italian 2% Slovak 2% Portuguese 1%
- Foreign-born
- 7% · Canada
- Languages at home
- 80% English-only · Spanish 18% German/W. Germanic 1%
Political lean MEDSL · Johnson
- 2024 margin
- Solid R (+51.4) · D 23.9% · R 75.3%
- 2008→2024 swing
- -3.9pp toward R · 2008: -47.5pp · 2024: -51.4pp
- All cycles
- 2024: R+51.4 2020: R+53.0 2016: R+58.3 2012: R+55.6 2008: R+47.5
Not yet ingested
- Civics
- —
Market trends
- HPI YoY
- ▼ -86.22%
- Current HPI
- 265.6513
- Rent YoY
- —
- Metro
- —
- State GDP YoY
- ▲ 3.95%
- F500 in state
- 110
Industry mix (Fortune 500 HQ in TX)
| Industry | F500 HQs | Revenue |
|---|---|---|
| Energy | 16 | $1,198B |
|
||
| Technology | 5 | $198B |
|
||
| Engineering / Construction | 4 | $72B |
|
||
| Energy Services | 3 | $60B |
|
||
| Utilities | 3 | $41B |
|
||
| Healthcare | 2 | $330B |
|
||
Price history
-0.8% since first listed2 events — show timeline
- 2026-05-14 Price Changed $239,149 NTREIS
- 2026-03-20 Listed $240,999 NTREIS
Cash-flow waterfall
monthlySold comps — $/sqft
last 12 mo · ≤1 miLoading sold comps…