4420 Pleasant Valley Rd #155 · Diamond Springs, CA
Flood risk 1/10 · Minimal
- FEMA flood zone
- X (unshaded)
- Chance of flooding over 30 yrs
- 0.0%
- Est. flood insurance / yr
- $507 – $1,088
Fire risk 8/10 · Major
- Est. fire insurance / yr
- $659 – $1,223
Heat risk 6/10 · Moderate
- Hot days now (above 100°F)
- 7 days/yr
- Hot days in 30 yrs
- 17 days/yr
Wind risk 1/10 · Minimal
- Chance of severe wind over 30 yrs
- —
Air-quality risk 10/10 · Severe
- Unhealthy air days now
- 31 days/yr
- Unhealthy air days in 30 yrs
- 38 days/yr
Risk factors via First Street. Map © Google.
Why this score? — see what drove the F grade
The composite is a weighted blend of 9 inputs, each scored 0–100. Each bar is that input's sub-score; the figure is the points it added to the 100-point composite (weight × sub-score).
- Cash flow +9.5/30.0
- ARV discount +7.5/15.0
- Schools +3.7/10.0
- 1% rule +2.9/10.0
- DSCR +2.7/10.0
- Rent growth +2.5/5.0
- Condition / age +2.5/5.0
- Livability +2.4/5.0
- Appreciation +0.0/10.0
$279,900
🖨 Deal sheet (PDF) 📄 Offer letter ✓ Due diligence
Listing remarks
Updated and absolutely gorgeous, this move-in ready home is located in desirable Lake Oaks, a 55+ community, where the seller has thoughtfully redone everything so you can simply move in and enjoy. The very open floor plan creates a bright, welcoming feel, highlighted by a large kitchen with an island, granite countertops, abundant cabinetry, and stainless steel appliances. The dining room features double doors that open to the deck, seamlessly blending indoor and outdoor living, while the living area is anchored by a stunning double-sided wood-burning fireplace that serves as a true statement piece. The spacious primary bedroom is privately situated on the opposite end of the home from the
Key facts
- Walk-in closet
- Abundant cabinetry
- Granite countertops
Tags
Property features AI
Finance
- Financial info: No land lease (listed land lease amount field present but property marked No)
- HOA & community: No association; Senior community
Exterior
- Parking: Covered parking
- Utilities: Cable available; Individual electric meter; Individual gas meter; 220 volts in kitchen and laundry; Public water; Public sewer
- Home design: Manufactured in park (double wide); Updated/remodeled; Built in 1985
- Construction: Composition roof; Wood skirting; Kaufman make
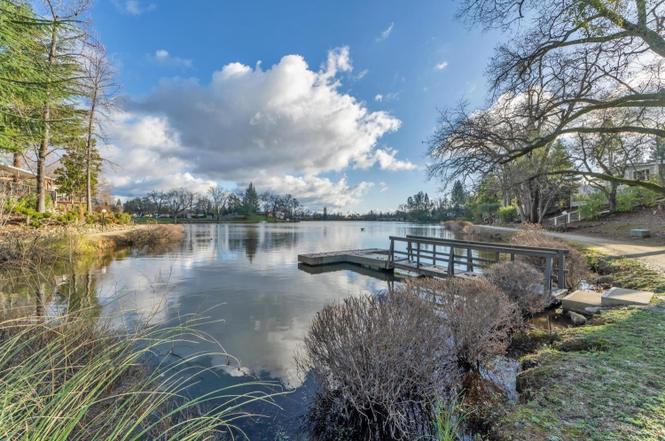
- Exterior features: Private setting with lake access; Patio awning and carport awning; Storage and shed(s)
Interior
- Kitchen: Island with stone counters; Dishwasher; Disposal; Microwave; Free-standing electric oven
- Bedrooms: 3 bedrooms (including a master bedroom)
- Flooring: Carpet
- Bathrooms: 2 full bathrooms; Double sinks; Jetted tub; Tub with shower over; Shower stall(s)
- Heating & cooling: Central heating; Fireplace(s); Central air conditioning; Ceiling fans
- Interior features: Cathedral/vaulted living and family rooms; Formal dining room; Porch steps and covered porch/deck; Dual pane full windows; Pets allowed (with number and size limits); Storage area
- Laundry & utility: Laundry room with hookups, sink, and inside location
Neighborhood map
What this means for you Summary
Snapshot
- This is a 3-bed/2.0-bath manufactured listed at $280k.
Deal economics
- At list price, monthly cash flow is $-196 ($-2k/yr) — negative.
- To cash-flow at today's rent, offer at most $252k (10.1% below list).
- To meet the 1% rule (rent ≥ 1% of price), the offer needs to be $220k (21.4% below list).
- Recommended offer: $220k (21.4% below list) — sets the bar for 1% rule.
- Cap rate 5.5% vs local median 2.3% in Diamond Springs — top-decile yield for the area; either an underpriced asset or a hidden risk that comps aren't pricing in. Stress-test before assuming the spread holds.
Location & tenants
- Location reads 47/100 on livability (#1,239 in CA) — a working-class tenant base; expect higher turnover. Strengths: housing B+; Watch: crime D-, amenities F, commute F.
- Mother Lode Union Elementary (rural): math 36% / reading 41% proficiency, ranked #726 of 1,400 in CA (top 52%) — families likely to look elsewhere, expect single-tenant / working-renter base with shorter leases.
- Zoned schools: Indian Creek Elementary (466 students, 50% FRL); Herbert C. Green Middle (374 students, 49% FRL); Union Mine High (math 31% / reading 66%, grade D, #373 of 1,170 statewide, top 32%, 1,066 students, 38% FRL).
- Market conditions: 32 active listings in the ZIP; 437 units permitted in El Dorado County in 2024 (0 in 5+ unit buildings).
Forward outlook
- Local home prices are declining (-3.0%/yr); year-one equity from $2k of loan paydown is wiped out by about $8k of value loss. Plan a longer hold.
- El Dorado County population projected to shrink 3% by 2050 — rents likely to lag national; underwrite the cash flow, not the appreciation.
Negotiation context
- It's been on market 126 days — a 12% lower offer ($246k) is reasonable based on typical stale-listing flexibility.
Risks & watch-outs
- Climate carrying-cost: severe wildfire risk; extreme-heat days projected 7→17/yr by 2055 (HVAC capex compounding) — expect insurance premiums to compound above CPI over the hold.
Questions for the listing agent
- What do current leases actually rent for vs. the listed asking? Can we see a recent rent roll and the last 12 months of T-12 income?
- It's been on market 126 days. Have you received any prior offers? Is the seller open to a 21% concession, seller financing, or rate buy-down credit?
- Why hasn't it sold? Are there any deal-killer items the seller is aware of (foundation, flood, title, zoning, code violations)?
- Is there a deadline driving the sale (1031 exchange, divorce, estate, relocation)? That informs how much negotiation room exists.
- Schools are D-rated, which usually means shorter tenancies and higher turnover. Who's the typical renter profile here, and what's been the actual vacancy rate?
- Crime grade is D in this area — have there been break-ins, vandalism, or insurance claims at this property in the last 3 years? What carrier currently insures it and at what premium?
- The area grade is low — what's the realistic commute time and amenity access for the typical tenant pool here? Any planned neighborhood developments (good or bad) we should know about?
- What's the average days-on-market for RENTAL listings here right now (not sales)? A rising rental-DOM trend means longer vacancies and softer asking-rent achievability than the comps imply.
- What's the recent tenant-quality profile in this submarket — average credit score on applications, eviction rate, late-payment / NSF rate, and stable-employment percentage? A property-management company in the area should have these aggregated.
- How much new for-sale + rental construction is in the pipeline within 1–3 miles? Heavy new supply typically softens prices + rents 12–24 months out; constrained supply supports both.
Investment metrics
- 1% rule
- 0.79% ✗
- Cap rate
- 5.45%
- Cash-on-cash
- -3.00%
- DSCR
- 0.87
- GRM
- 10.6
CMA / ARV
No comps found within radius.
Projected returns pro-forma
-3.0% appreciation · 3.0% rent growth · sell at horizon
- IRR
- -21.3%
- Equity multiple
- 0.26×
- Total profit
- $-57,806
- Equity at exit
- $41,734
- IRR
- -14.8%
- Equity multiple
- 0.15×
- Total profit
- $-66,275
- Equity at exit
- $24,201
Cash invested: $78,372 (down + closing). Projections, not guarantees.
Landlord ↔ Tenant lean methodology
- Overall (STATE)
- 18 Strongly Tenant-Friendly
- State California
- 18 Strongly Tenant-Friendly · D+13
- County
- — inherits STATE
- City
- — inherits STATE
ZIP-level market 95619
- Active inventory
- 32
- Price-to-rent
- 10.6×
Monthly cashflow live
- Estimated rent
- $2,200 medium interval (Pro) →
- Mortgage (P&I)
- −$1,468
- Tax est. 1.5%
- −$350 /mo · $4,198/yr
- Insurance
- −$117
- HOA
- −$0
- Vacancy / Maint / Mgmt
- −$462
- Net cashflow
- $-196
Break-even live
Sensitivity live
| Price | -10% $-3 | -5% $-99 | +0% $-196 | +5% $-293 | +10% $-389 |
|---|---|---|---|---|---|
| Rent | -10% $-370 | -5% $-283 | +0% $-196 | +5% $-109 | +10% $-22 |
| Rate | -1.0pp $-55 | -0.5pp $-125 | base $-196 | +0.5pp $-269 | +1.0pp $-342 |
UW: 25.0% down · 7.5% · 30yr · 1.5% tax · 5.0% vac · 8.0% maint · 8.0% mgmt
Financing live
Cash to close
- Down payment
- $69,975
- Closing costs
- $8,397
- Reserves months
- —
- Total cash needed
- —
Loan-product check · same deal, 3 products live
Conventional
25% down · 7.5% · 30yr
- Down + closing
- —
- Monthly P&I
- —
- Monthly cashflow
- —
- DSCR
- —
- Eligible?
- —
Personal DTI + credit; lowest rate.
DSCR
20% down · 8.5% · 30yr
- Down + closing
- —
- Monthly P&I
- —
- Monthly cashflow
- —
- DSCR
- —
- Eligible?
- —
No personal income docs; deal must DSCR.
Hard money
10% down · 12.0% · 12mo
- Down + closing
- —
- Monthly P&I
- —
- Monthly cashflow
- —
- DSCR
- —
- Eligible?
- —
Short-term bridge; refi at stabilization.
Listing history 12 events
-
2026-06-21days on market $279,900 Active 126 DOM
-
2026-06-18days on market $279,900 Active 123 DOM
-
2026-06-17days on market $279,900 Active 122 DOM
-
2026-06-16days on market $279,900 Active 121 DOM
-
2026-06-15days on market $279,900 Active 120 DOM
-
2026-06-13days on market $279,900 Active 118 DOM
-
2026-06-13pricedays on market $279,900 Active 117 DOM
-
2026-06-09days on market $284,900 Active 114 DOM
-
2026-06-08days on market $284,900 Active 113 DOM
-
2026-06-07days on market $284,900 Active 112 DOM
-
2026-06-03days on market $284,900 Active 108 DOM
-
2026-05-31days on market $284,900 Active 107 DOM
ⓘ Source: listings_history table (triggers on properties + properties_extension) + one-shot
backfill from property_details.listing_events for pre-trigger history.
Climate risk First Street
- Flood 1/10 Low FEMA zone X (unshaded) · 0% chance over 30 yrs
- Wildfire 8/10 Severe
- Heat 6/10 Major 7 d/yr ≥100°F today · 17 d/yr by 30 yrs out
- Wind 1/10 Low
- Air quality 10/10 Extreme 31 unhealthy d/yr today · 38 by 30 yrs out
Nearby sold comps map
Loading sold comps map…
Walkable amenities ~0.75 mi
Loading nearby amenities…
Taxation est. · year 1
- Rental income
- $26,405
- − Mortgage interest
- −$15,679
- − Property taxes
- −$4,198
- − Insurance
- −$1,400
- − Repairs & maintenance
- −$2,112
- − Management
- −$2,112
- − Depreciation
- −$8,143
- Taxable loss
- −$7,239
- Est. tax savings @ 24.0%
- +$1,737
- After-tax cash flow
- $-615/yr
For passive investors: Depreciation is non-cash, so a rental often shows a tax loss while cash-flowing — sheltering income. Rental losses are passive: they offset passive income freely, and up to $25,000/yr can offset ordinary (W-2) income if you actively participate and your MAGI is under $100k (phasing out to $0 by $150k); unused losses carry forward. On sale, claimed depreciation is recaptured at up to 25%, and gains may owe capital-gains tax (a 1031 exchange can defer both). Figures are a year-1 estimate at your 24.0% rate — not tax advice; consult a CPA.
Schools (NCES district)
- District
- Mother Lode Union Elementary
- NCES district ID
- 0625980
- Math proficiency
- 36% ▬ 0.00%
- Reading proficiency
- 41% ▼ -4.00%
- Median HH income
- $59,429
- Composite
- 36.63/100
- National rank
- #9251
- State rank
- #726 of 1400 in CA
Livability — Diamond Springs
- Score
- 47/100
- State rank
- #1239
- US rank
- #26264
Category grades
Schools grade is shown separately in the Schools card above.
Census & demographics
- Census place
- Diamond Springs, CA
- City population
- 6,362
- Population (ZIP)
- 6,362
Population outlook (El Dorado County) Hauer SSP2
- Today (2025)
- 191,666 people
- By 2030
- 193,662 · +1.0%
- By 2040
- 192,583 · +0.5%
- By 2050
- 185,904 · -3.0%
- By 2075
- 169,543 · -11.5%
- By 2100
- 139,623 · -27.2%
Race, ethnicity, and origin ACS 2023
- Neighborhood character
- Predominantly White (68%)
- Race & ethnicity
- White 68% Hispanic / Latino 24% Two or more races 5% Asian 3% Native American 1%
- Hispanic origin (detail)
- Mexican 22%
- Common ancestry
- Italian 9% Slovak 4% Russian 4%
- Foreign-born
- 6% · Canada, South Korea
- Languages at home
- 90% English-only · Spanish 7% Korean 1% French/Haitian/Cajun 1%
Political lean MEDSL · El Dorado
- 2024 margin
- R (+12.0) · D 42.6% · R 54.6% · Other 2.8%
- 2008→2024 swing
- -1.5pp toward R · 2008: -10.5pp · 2024: -12.0pp
- All cycles
- 2024: R+12.0 2020: R+8.8 2016: R+13.9 2012: R+18.2 2008: R+10.5
Not yet ingested
- Civics
- —
Market trends
- HPI YoY
- ▼ -137.93%
- Current HPI
- 248.9804
- Rent YoY
- —
- Metro
- —
- State GDP YoY
- ▲ 3.21%
- F500 in state
- 116
Industry mix (Fortune 500 HQ in CA)
| Industry | F500 HQs | Revenue |
|---|---|---|
| Technology | 27 | $1,492B |
|
||
| Financial Services | 3 | $174B |
|
||
| Retail | 3 | $44B |
|
||
| Insurance | 3 | $26B |
|
||
| Media / Entertainment | 2 | $115B |
|
||
| Pharmaceuticals / Biotech | 2 | $62B |
|
||
Property tax history
-0.0%/yrLatest (2023): $360 · -0.5% YoY. Source: county tax records.
Cash-flow waterfall
monthlySold comps — $/sqft
last 12 mo · ≤1 miLoading sold comps…