336 E Alluvial Ave #119 · Fresno, CA
Flood risk 1/10 · Minimal
- FEMA flood zone
- X (unshaded)
- Chance of flooding over 30 yrs
- 0.0%
- Est. flood insurance / yr
- $507 – $1,088
Fire risk 6/10 · Moderate
- Est. fire insurance / yr
- $659 – $1,223
Heat risk 8/10 · Major
- Hot days now (above 105°F)
- 7 days/yr
- Hot days in 30 yrs
- 17 days/yr
Wind risk 1/10 · Minimal
- Chance of severe wind over 30 yrs
- —
Air-quality risk 10/10 · Severe
- Unhealthy air days now
- 48 days/yr
- Unhealthy air days in 30 yrs
- 50 days/yr
Risk factors via First Street. Map © Google.
Why this score? — see what drove the C grade
The composite is a weighted blend of 9 inputs, each scored 0–100. Each bar is that input's sub-score; the figure is the points it added to the 100-point composite (weight × sub-score).
- Cash flow +27.2/30.0
- DSCR +9.4/10.0
- 1% rule +7.4/10.0
- Schools +5.9/10.0
- Livability +3.1/5.0
- Rent growth +3.0/5.0
- Condition / age +2.5/5.0
- ARV discount +0.0/15.0
- Appreciation +0.0/10.0
$169,999
🖨 Deal sheet 📄 Offer letter ✓ Due diligence
Listing remarks MLS
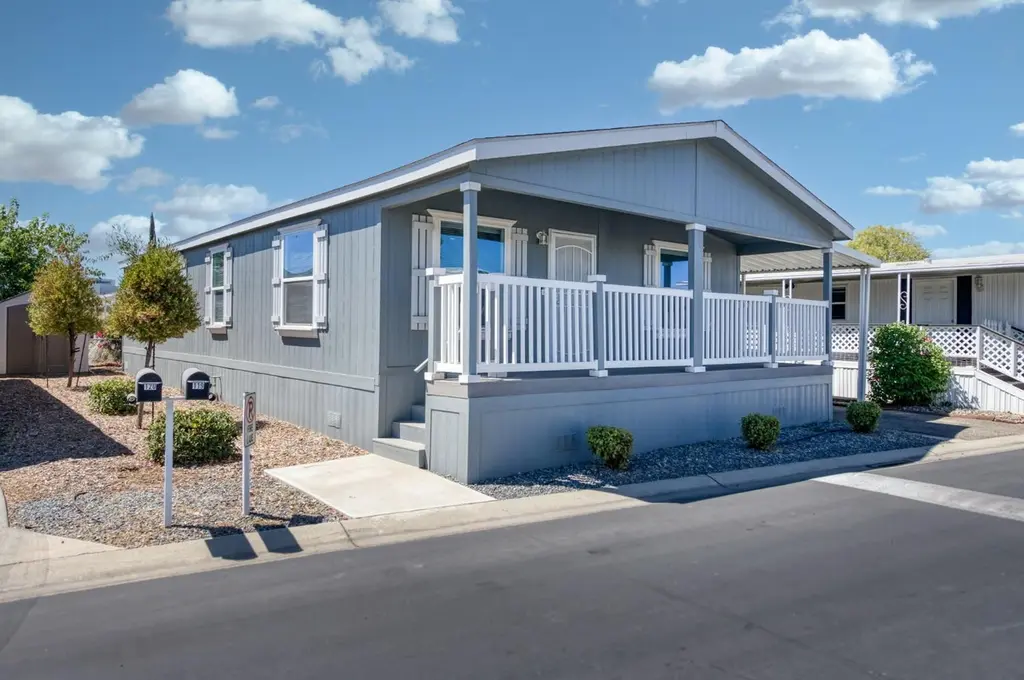
Built in 2019 by Fleetwood Homes, this energy-efficient double-wide manufactured home is located in San Joaquin Village Mobile Home Parka well-maintained, all-ages community in the award-winning Clovis Unified School District. Ideally situated within walking distance to River Park Shopping Center and Kaiser Hospital, this 3-bedroom, 2-bath home offers approximately 1,500 sq. ft. of comfortable, move-in ready living space.Enjoy an open and airy floor plan featuring vaulted ceilings, dual-pane windows, neutral flooring, ceiling fans, and central heating & air. The spacious living room is filled with natural light from large windows adorned with wood box valances. The gourmet kitchen opens to the living area and features wood cabinetry, gas appliances, a large center island, and dishwasher perfect for entertaining or everyday living.The private primary suite includes a walk-in closet and an en-suite bath with dual sinks. Additional highlights include an indoor laundry room with gas hookups, a covered front porch, a 2-car carport, and a storage shed.San Joaquin Village offers a variety of amenities, including a pool, spa, clubhouse, playground, and RV parkingmaking this the perfect place to call home.
Key facts
- Covered front porch
- Gourmet kitchen
- Storage shed
Tags
Neighborhood map
What this means for you Summary
Snapshot
- This is a 3-bed/2.0-bath manufactured listed at $170k.
Deal economics
- At list price, monthly cash flow is $484 ($6k/yr) — positive.
- The deal already cash-flows at list — no discount required.
- Meets the 1% rule at list price ($2k rent vs $170k).
- Recommended offer: $150k (12.0% below list) — sets the bar for market timing.
- Cap rate 9.7% vs local median 3.7% in Fresno — top-decile yield for the area; either an underpriced asset or a hidden risk that comps aren't pricing in. Stress-test before assuming the spread holds.
Location & tenants
- Location reads 62/100 on livability (#469 in CA) — a middle-class / working-renter tenant base. Strengths: commute A+, housing A+; Watch: amenities D+, employment D+, schools D.
- Clovis Unified (suburban): math 58% / reading 72% proficiency, ranked #152 of 1,400 in CA (top 11%) — acceptable for families but not a draw, mixed tenant base, ~2y average lease.
- Market conditions: Rents rising (+1.9%/yr); 176 active listings in the ZIP; 16 comparable units currently listed for rent nearby; rentals at typical pace (median 16d on market — plan ~3-4 weeks tenant-placement turnaround); solid renter incomes; 2,426 units permitted in Fresno County in 2024 (296 in 5+ unit buildings).
Forward outlook
- Local home prices are declining (-3.0%/yr); year-one equity from $1k of loan paydown is wiped out by about $5k of value loss. Plan a longer hold.
- Fresno County population projected at +11% by 2050 — modest demand growth; plan on rents tracking national, not racing it.
Negotiation context
- It's been on market 136 days — a 12% lower offer ($150k) is reasonable based on typical stale-listing flexibility.
- 3 sale attempts since 15y ago; this cycle's ask has dropped $10k (6%) from the opening price — seller is motivated, your offer sets the floor, not the list.
- Current owner paid $110k; list at $170k implies a 55% gain — meaningful room to come down on a strong offer.
Risks & watch-outs
- Climate carrying-cost: major wildfire risk; extreme-heat days projected 7→17/yr by 2055 (HVAC capex compounding) — expect insurance premiums to compound above CPI over the hold.
Questions for the listing agent
- It's been on market 136 days. Have you received any prior offers? Is the seller open to a 12% concession, seller financing, or rate buy-down credit?
- Why hasn't it sold? Are there any deal-killer items the seller is aware of (foundation, flood, title, zoning, code violations)?
- Is there a deadline driving the sale (1031 exchange, divorce, estate, relocation)? That informs how much negotiation room exists.
- Schools are D-rated, which usually means shorter tenancies and higher turnover. Who's the typical renter profile here, and what's been the actual vacancy rate?
- Crime grade is F in this area — have there been break-ins, vandalism, or insurance claims at this property in the last 3 years? What carrier currently insures it and at what premium?
- What's the average days-on-market for RENTAL listings here right now (not sales)? A rising rental-DOM trend means longer vacancies and softer asking-rent achievability than the comps imply.
- What's the recent tenant-quality profile in this submarket — average credit score on applications, eviction rate, late-payment / NSF rate, and stable-employment percentage? A property-management company in the area should have these aggregated.
- How much new for-sale + rental construction is in the pipeline within 1–3 miles? Heavy new supply typically softens prices + rents 12–24 months out; constrained supply supports both.
Investment metrics
- 1% rule
- 1.24% ✓
- Cap rate
- 9.71%
- Cash-on-cash
- 12.20%
- DSCR
- 1.54
- GRM
- 6.7
CMA / ARV
- ARV (median comp)
- $117,500
- List price
- $169,999
- Delta
- 44.68%
- Verdict
- OVERPRICED
- Comps
- 14 within 1.0 mi
Show comp detail 4 sales within ~0.75 mi
| Address | Dist | Beds/Ba | Sqft | Sold | Price | $/sf | Match |
|---|---|---|---|---|---|---|---|
| 336 E Alluvial Ave #1 | 0.05mi | 2/2.0 (-1) | 1,056 (0%) | 4mo | $125,000 | $118 | 90 |
| 336 E Alluvial Ave Spc 5 | 0.00mi | 2/2.0 (-1) | 1,080 (+2%) | 11mo | $127,500 | $118 | 82 |
| 336 E Alluvial Ave #165 | 0.00mi | 3/2.0 | 1,080 (+2%) | 23mo | $145,000 | $134 | 77 |
| 7676 Fresno St #84 | 0.23mi | 2/1.0 (-1) | 900 (-15%) | 15mo | $80,000 | $89 | 43 |
Match score weights: distance 35% · size 25% · config 20% · recency 20%. Top-matched comps best support the ARV.
Projected returns pro-forma
-3.0% appreciation · 1.91% rent growth · sell at horizon
- IRR
- 0.6%
- Equity multiple
- 1.02×
- Total profit
- $1,035
- Equity at exit
- $25,347
- IRR
- 9.1%
- Equity multiple
- 1.66×
- Total profit
- $31,580
- Equity at exit
- $14,698
Cash invested: $47,600 (down + closing). Projections, not guarantees.
Landlord ↔ Tenant lean methodology
- Overall (STATE)
- 18 Strongly Tenant-Friendly
- State California
- 18 Strongly Tenant-Friendly · D+13
- County
- — inherits STATE
- City
- — inherits STATE
ZIP-level market 93720
- Rents YoY
- 1.9%
- Active inventory
- 176
- Price-to-rent
- 6.7×
Monthly cashflow live
- Estimated rent
- $2,100 high interval (Pro) →
- Mortgage (P&I)
- −$891
- Tax est. 1.5%
- −$212 /mo · $2,550/yr
- Insurance
- −$71
- HOA
- −$0
- Vacancy / Maint / Mgmt
- −$441
- Net cashflow
- $484
Break-even live
UW: 25.0% down · 7.5% · 30yr · 1.5% tax · 5.0% vac · 8.0% maint · 8.0% mgmt
Financing live
Cash to close
- Down payment
- $42,500
- Closing costs
- $5,100
- Reserves months
- —
- Total cash needed
- —
Loan-product check · same deal, 3 products live
Conventional
25% down · 7.5% · 30yr
- Down + closing
- —
- Monthly P&I
- —
- Monthly cashflow
- —
- DSCR
- —
- Eligible?
- —
Personal DTI + credit; lowest rate.
DSCR
20% down · 8.5% · 30yr
- Down + closing
- —
- Monthly P&I
- —
- Monthly cashflow
- —
- DSCR
- —
- Eligible?
- —
No personal income docs; deal must DSCR.
Hard money
10% down · 12.0% · 12mo
- Down + closing
- —
- Monthly P&I
- —
- Monthly cashflow
- —
- DSCR
- —
- Eligible?
- —
Short-term bridge; refi at stabilization.
Rent comps 16 comps
| Address | Beds | Baths | Sqft | Rent | $/sqft | DOM | Units | Dist |
|---|---|---|---|---|---|---|---|---|
| 7579 N Angus St Unit 101 Fresno, CA | 2.0 | 2.0 | 1245 | $1,825 | $1.47 | 24d | 1 | 0.14mi |
| 7580 N Angus St Fresno, CA | 2.0 | 2.0 | 1350 | $1,900 | $1.41 | 44d | 1 | 0.15mi |
| 7722 N Angus St Fresno, CA | 1.0–2.0 | 1.0–2.0 | 820 | $1,575 | $1.92 | 3d | 1 | 0.30mi |
| 7511 N First St Fresno, CA | 1.0–3.0 | 1.0–2.5 | 1078 | $2,350 | $2.18 | 2d | 21 | 0.31mi |
| 7625 N First St Fresno, CA | 1.0–2.0 | 1.0 | 739 | $1,625 | $2.20 | 2d | 2 | 0.37mi |
| 7675 N First St Fresno, CA | 1.0–2.0 | 1.0–2.0 | 989 | $1,830 | $1.85 | 44d | 1 | 0.39mi |
| 875 E Cromwell Ave Fresno, CA | 3.0 | 2.0 | 1472 | $2,800 | $1.90 | 14d | 1 | 0.69mi |
| 1050 E Fallbrook Ave Fresno, CA | 3.0 | 2.0 | 1457 | $2,750 | $1.89 | 24d | 1 | 0.92mi |
| 373 W Nees Ave Fresno, CA | 1.0–2.0 | 1.0–2.0 | 867 | $1,855 | $2.14 | 3d | 1 | 0.99mi |
| 6515 N Orchard St Fresno, CA | 3.0 | 2.0 | 1500 | $2,300 | $1.53 | 16d | 1 | 0.99mi |
| 445 W Nees Ave Fresno, CA | 1.0–2.0 | 1.0–2.0 | 847 | $1,820 | $2.15 | 2d | 10 | 1.12mi |
| 8440 N Millbrook Ave Fresno, CA | 1.0–2.0 | 1.5–2.0 | 1002 | $2,000 | $2.00 | 44d | 1 | 1.28mi |
| 91 W Sierra Ave Fresno, CA | 3.0 | 1.5 | 1291 | $2,500 | $1.94 | 16d | 1 | 1.28mi |
| 8153 N Cedar Ave #212 Fresno, CA | 2.0 | 2.0 | 1141 | $1,750 | $1.53 | 24d | 1 | 1.40mi |
| 7350 N Cedar Ave Fresno, CA | 2.0 | 1.0 | 915 | $1,816 | $1.98 | 2d | 2 | 1.44mi |
| 135 E Stuart Ave Fresno, CA | 3.0 | 1.0 | 1120 | $1,995 | $1.78 | 3d | 1 | 1.46mi |
Listing history 26 events
-
2026-06-18days on market $169,999 Active 136 DOM
-
2026-06-17days on market $169,999 Active 135 DOM
-
2026-06-16days on market $169,999 Active 134 DOM
-
2026-06-15days on market $169,999 Active 133 DOM
-
2026-06-13days on market $169,999 Active 131 DOM
-
2026-06-13days on market $169,999 Active 130 DOM
-
2026-06-10days on market $169,999 Active 128 DOM
-
2026-06-09days on market $169,999 Active 127 DOM
-
2026-06-08days on market $169,999 Active 126 DOM
-
2026-06-07days on market $169,999 Active 125 DOM
-
2026-06-05days on market $169,999 Active 122 DOM
-
2026-06-03days on market $169,999 Active 121 DOM
-
2026-06-02days on market $169,999 Active 120 DOM
-
2026-06-01days on market $169,999 Active 119 DOM
-
2026-05-31days on market $169,999 Active 118 DOM
-
2026-04-23price $174,999 1220-char remark
Show marketing remark (1220 chars)
Built in 2019 by Fleetwood Homes, this energy-efficient double-wide manufactured home is located in San Joaquin Village Mobile Home Parka well-maintained, all-ages community in the award-winning Clovis Unified School District. Ideally situated within walking distance to River Park Shopping Center and Kaiser Hospital, this 3-bedroom, 2-bath home offers approximately 1,500 sq. ft. of comfortable, move-in ready living space.Enjoy an open and airy floor plan featuring vaulted ceilings, dual-pane windows, neutral flooring, ceiling fans, and central heating & air. The spacious living room is filled with natural light from large windows adorned with wood box valances. The gourmet kitchen opens to the living area and features wood cabinetry, gas appliances, a large center island, and dishwasher perfect for entertaining or everyday living.The private primary suite includes a walk-in closet and an en-suite bath with dual sinks. Additional highlights include an indoor laundry room with gas hookups, a covered front porch, a 2-car carport, and a storage shed.San Joaquin Village offers a variety of amenities, including a pool, spa, clubhouse, playground, and RV parkingmaking this the perfect place to call home.
-
2026-02-02$179,999 Active 1220-char remark
Show marketing remark (1220 chars)
Built in 2019 by Fleetwood Homes, this energy-efficient double-wide manufactured home is located in San Joaquin Village Mobile Home Parka well-maintained, all-ages community in the award-winning Clovis Unified School District. Ideally situated within walking distance to River Park Shopping Center and Kaiser Hospital, this 3-bedroom, 2-bath home offers approximately 1,500 sq. ft. of comfortable, move-in ready living space.Enjoy an open and airy floor plan featuring vaulted ceilings, dual-pane windows, neutral flooring, ceiling fans, and central heating & air. The spacious living room is filled with natural light from large windows adorned with wood box valances. The gourmet kitchen opens to the living area and features wood cabinetry, gas appliances, a large center island, and dishwasher perfect for entertaining or everyday living.The private primary suite includes a walk-in closet and an en-suite bath with dual sinks. Additional highlights include an indoor laundry room with gas hookups, a covered front porch, a 2-car carport, and a storage shed.San Joaquin Village offers a variety of amenities, including a pool, spa, clubhouse, playground, and RV parkingmaking this the perfect place to call home.
-
2025-12-23price $179,999
-
2020-03-30soldstatus $110,000 Sold
-
2020-03-11status Pending
-
2020-03-10status Backup
-
2020-01-29$110,000 Active
-
2011-12-15soldstatus $11,000
-
2011-11-06price $13,500
-
2011-11-06historical
-
2011-09-28$11,000
ⓘ Source: listings_history table (triggers on properties + properties_extension) + one-shot
backfill from property_details.listing_events for pre-trigger history.
Climate risk First Street
- Flood 1/10 Low FEMA zone X (unshaded) · 0% chance over 30 yrs
- Wildfire 6/10 Major
- Heat 8/10 Severe 7 d/yr ≥105°F today · 17 d/yr by 30 yrs out
- Wind 1/10 Low
- Air quality 10/10 Extreme 48 unhealthy d/yr today · 50 by 30 yrs out
Nearby sold comps map
Loading sold comps map…
Walkable amenities ~0.75 mi
Loading nearby amenities…
Taxation est. · year 1
- Rental income
- $25,198
- − Mortgage interest
- −$9,523
- − Property taxes
- −$2,550
- − Insurance
- −$850
- − Repairs & maintenance
- −$2,016
- − Management
- −$2,016
- − Depreciation
- −$4,945
- Taxable income
- $3,298
- Est. tax owed @ 24.0%
- −$792
- After-tax cash flow
- $5,017/yr
For passive investors: Depreciation is non-cash, so a rental often shows a tax loss while cash-flowing — sheltering income. Rental losses are passive: they offset passive income freely, and up to $25,000/yr can offset ordinary (W-2) income if you actively participate and your MAGI is under $100k (phasing out to $0 by $150k); unused losses carry forward. On sale, claimed depreciation is recaptured at up to 25%, and gains may owe capital-gains tax (a 1031 exchange can defer both). Figures are a year-1 estimate at your 24.0% rate — not tax advice; consult a CPA.
Schools (NCES district)
- District
- Clovis Unified
- NCES district ID
- 0609030
- Math proficiency
- 58% ▲ 1.00%
- Reading proficiency
- 72% ▲ 2.00%
- Median HH income
- $71,950
- Composite
- 58.7/100
- National rank
- #2003
- State rank
- #152 of 1400 in CA
Livability — Fresno
- Score
- 62/100
- State rank
- #469
- US rank
- #15907
Category grades
Schools grade is shown separately in the Schools card above.
Census & demographics
- Census place
- Fresno, CA
- County
- Fresno County · 834,801 people
- City population
- 593,114
- Metro
- Fresno, CA
- Population (ZIP)
- 50,089
- Household income
- $105,050
- Rent vs Own
- Severe rent burden
- 1796.0
Population outlook (Fresno County) Hauer SSP2
- Today (2025)
- 1,042,971 people
- By 2030
- 1,072,198 · +2.8%
- By 2040
- 1,122,408 · +7.6%
- By 2050
- 1,157,251 · +11.0%
- By 2075
- 1,182,575 · +13.4%
- By 2100
- 1,105,899 · +6.0%
Race, ethnicity, and origin ACS 2023
- Neighborhood character
- Diverse neighborhood (Simpson 0.67)
- Race & ethnicity
- White 48% Hispanic / Latino 28% Two or more races 16% Asian 16% Black 3%
- Hispanic origin (detail)
- Mexican 24%
- Common ancestry
- Russian 2% Slovak 1% Italian 1%
- Foreign-born
- 17% · Canada, China, Vietnam
- Languages at home
- 73% English-only · Spanish 10% Other Indo-European 6% Tagalog/Filipino 2%
Political lean MEDSL · Fresno
- 2024 margin
- Toss-up / Even · D 46.5% · R 50.9% · Other 2.6%
- 2008→2024 swing
- -6.5pp toward R · 2008: 2.1pp · 2024: -4.4pp
- All cycles
- 2024: R+4.4 2020: D+7.8 2016: D+3.9 2012: R+2.9 2008: D+2.1
Not yet ingested
- Civics
- —
Market trends
- HPI YoY
- ▼ -278.23%
- Current HPI
- 332.618
- Rent YoY
- ▲ 1.91%
- Metro
- Fresno, CA
- State GDP YoY
- ▲ 3.21%
- F500 in state
- 116
Industry mix (Fortune 500 HQ in CA)
| Industry | F500 HQs | Revenue |
|---|---|---|
| Technology | 27 | $1,492B |
|
||
| Financial Services | 3 | $174B |
|
||
| Retail | 3 | $44B |
|
||
| Insurance | 3 | $26B |
|
||
| Media / Entertainment | 2 | $115B |
|
||
| Pharmaceuticals / Biotech | 2 | $62B |
|
||
Price history
+1490.9% since first listed11 events — show timeline
- 2026-04-23 Price Changed $174,999 FRESNOMLS
- 2026-02-02 Listed $179,999 FRESNOMLS
- 2025-12-23 Price Changed $179,999 FRESNOMLS
- 2020-03-30 Sold (MLS) $110,000 FRESNOMLS
- 2020-03-11 Pending — FRESNOMLS
- 2020-03-10 Pending — FRESNOMLS
- 2020-01-29 Listed $110,000 FRESNOMLS
- 2011-12-15 Sold (MLS) $11,000 FRESNOMLS
- 2011-11-06 Delisted — FRESNOMLS
- 2011-11-06 Price Changed $13,500 FRESNOMLS
- 2011-09-28 Listed $11,000 FRESNOMLS
Cash-flow waterfall
monthlySold comps — $/sqft
last 12 mo · ≤1 miLoading sold comps…