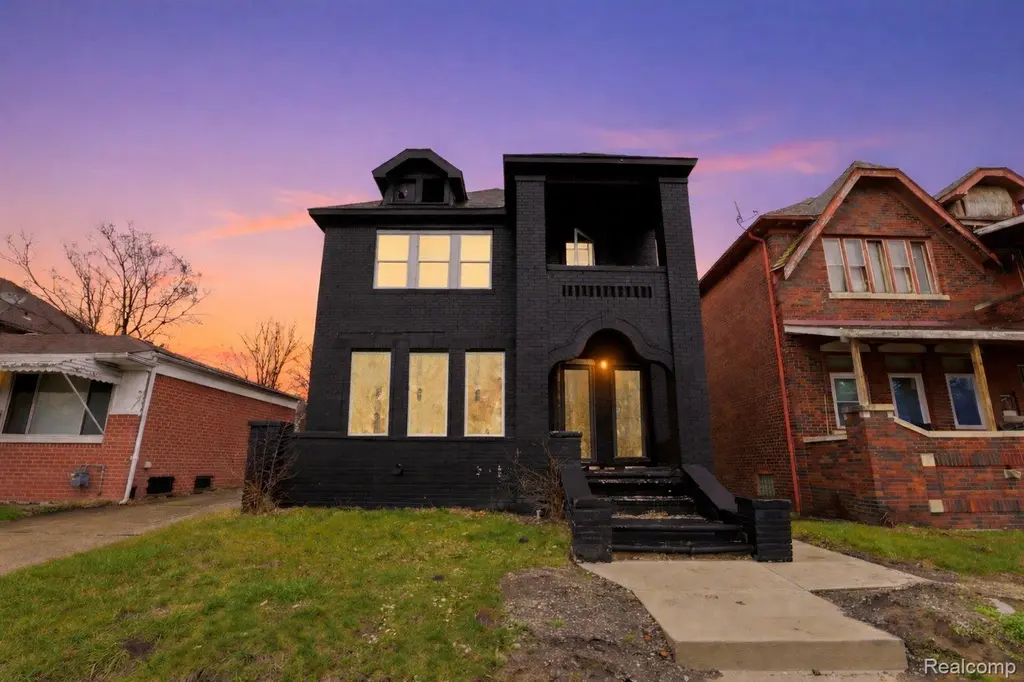
16188 Lawton St · Detroit, MI
Flood risk 1/10 · Minimal
- FEMA flood zone
- X (unshaded)
- Chance of flooding over 30 yrs
- 0.0%
- Est. flood insurance / yr
- $473 – $860
Fire risk 1/10 · Minimal
- Est. fire insurance / yr
- $784 – $1,456
Heat risk 3/10 · Minor
- Hot days now (above 97°F)
- 7 days/yr
- Hot days in 30 yrs
- 14 days/yr
Wind risk 2/10 · Minimal
- Chance of severe wind over 30 yrs
- —
Air-quality risk 4/10 · Minor
- Unhealthy air days now
- 4 days/yr
- Unhealthy air days in 30 yrs
- 6 days/yr
Risk factors via First Street. Map © Google.
Why this score? — see what drove the D grade
The composite is a weighted blend of 9 inputs, each scored 0–100. Each bar is that input's sub-score; the figure is the points it added to the 100-point composite (weight × sub-score).
- Cash flow +20.0/30.0
- 1% rule +6.8/10.0
- DSCR +6.4/10.0
- Livability +3.7/5.0
- Rent growth +3.4/5.0
- Condition / age +2.5/5.0
- Schools +1.3/10.0
- ARV discount +0.0/15.0
- Appreciation +0.0/10.0
$160,000
🖨 Deal sheet (PDF) 📄 Offer letter ✓ Due diligence
Listing remarks MLS
Spacious brick duplex featuring two large units, each offering 3 bedrooms. Just outside the bagley neighborhood in the very desirable Martin Park. Most major updates have already been completed—just bring your finishing touches with new flooring to make it shine. A solid investment or owner-occupant opportunity with strong potential! Very little rehab needed. With an ARV above 230k and each unit should rent out for $1,300 a month totalling $2,600. Cash on Cash return is through the roof!! RECENT APPRAISAL CAME IN AT $240k
Key facts
- 3,920 sq ft lot
- Built 1928
- Listed 76 days
Neighborhood map
What this means for you Summary
Snapshot
- This is a 6-bed/2.5-bath townhouse listed at $160k.
Deal economics
- At list price, monthly cash flow is $198 ($2k/yr) — positive.
- The deal already cash-flows at list — no discount required.
- Meets the 1% rule at list price ($2k rent vs $160k).
- Recommended offer: $150k (6.0% below list) — sets the bar for market timing.
- Cap rate 7.8% vs local median 10.0% in Detroit — below-typical yield; the buyer is paying a premium for something (appreciation thesis, condition, location) that the cap rate doesn't capture.
Location & tenants
- Location reads 73/100 on livability (#218 in MI) — a middle-class / working-renter tenant base. Strengths: amenities A+, commute A+, cost of living A+; Watch: crime F, employment F.
- Detroit Public Schools Community District (urban): math 10% / reading 24% proficiency, ranked #499 of 540 in MI (top 92%) — low school quality limits family demand, transient renter base, plan for 1-2y turnover; 90% free/reduced lunch — lower-income household profile, screen leases tightly.
- Zoned schools: Paul Robeson Malcolm X Academy (math 10% / reading 10%, grade F, #1,230 of 1,397 statewide, top 91%, 395 students, 88% FRL); Mumford High School (math 24% / reading 24%, grade F, #481 of 713 statewide, top 81%, 889 students, 86% FRL) — zoned schools at 87% FRL track the district average.
- Market conditions: Rents rising (+3.4%/yr); 349 active listings in the ZIP; 2 comparable units currently listed for rent nearby; 2,639 units permitted in Wayne County in 2024 (1,216 in 5+ unit buildings).
- This rent runs 39% of the median local income ($58k/yr) — at the standard rent-burdened threshold; future hikes will face affordability resistance.
Forward outlook
- Local home prices are declining (-3.0%/yr); year-one equity from $1k of loan paydown is wiped out by about $5k of value loss. Plan a longer hold.
- Wayne County population projected at -17% by 2050 — secular population decline; favor cash flow + early exit over multi-decade hold.
Negotiation context
- It's been on market 76 days — a 6% lower offer ($150k) is reasonable based on typical stale-listing flexibility.
- 16 sale attempts since 9y ago; this cycle's ask has dropped $15k (9%) from the opening price — seller is motivated, your offer sets the floor, not the list.
- Current owner paid $99k; list at $160k implies a 62% gain — meaningful room to come down on a strong offer.
Risks & watch-outs
- Watch-outs: property tax is 2.9% of price; built in 1928 — expect roof / HVAC / electrical / plumbing capex.
Questions for the listing agent
- It's been on market 76 days. Have you received any prior offers? Is the seller open to a 6% concession, seller financing, or rate buy-down credit?
- Built in 1928 — when were the roof, HVAC, electrical panel, plumbing, and water heater last replaced?
- Property tax is high relative to price — has the assessment been appealed recently, and will the sale trigger a re-assessment?
- Why hasn't it sold? Are there any deal-killer items the seller is aware of (foundation, flood, title, zoning, code violations)?
- Is there a deadline driving the sale (1031 exchange, divorce, estate, relocation)? That informs how much negotiation room exists.
- Schools are F-rated, which usually means shorter tenancies and higher turnover. Who's the typical renter profile here, and what's been the actual vacancy rate?
- Crime grade is F in this area — have there been break-ins, vandalism, or insurance claims at this property in the last 3 years? What carrier currently insures it and at what premium?
- The area grade is low — what's the realistic commute time and amenity access for the typical tenant pool here? Any planned neighborhood developments (good or bad) we should know about?
- What's the average days-on-market for RENTAL listings here right now (not sales)? A rising rental-DOM trend means longer vacancies and softer asking-rent achievability than the comps imply.
- What's the recent tenant-quality profile in this submarket — average credit score on applications, eviction rate, late-payment / NSF rate, and stable-employment percentage? A property-management company in the area should have these aggregated.
- How much new for-sale + rental construction is in the pipeline within 1–3 miles? Heavy new supply typically softens prices + rents 12–24 months out; constrained supply supports both.
Investment metrics
- 1% rule
- 1.18% ✓
- Cap rate
- 7.77%
- Cash-on-cash
- 5.29%
- DSCR
- 1.24
- GRM
- 7.0
CMA / ARV
- ARV (median comp)
- $135,035
- List price
- $160,000
- Delta
- 18.49%
- Verdict
- OVERPRICED
- Comps
- 20 within 1.0 mi
Projected returns pro-forma
-3.0% appreciation · 3.44% rent growth · sell at horizon
- IRR
- -7.4%
- Equity multiple
- 0.72×
- Total profit
- $-12,355
- Equity at exit
- $23,857
- IRR
- 2.9%
- Equity multiple
- 1.21×
- Total profit
- $9,530
- Equity at exit
- $13,834
Cash invested: $44,800 (down + closing). Projections, not guarantees.
Landlord ↔ Tenant lean methodology
- Overall (STATE)
- 62 Landlord-Friendly
- State Michigan
- 62 Landlord-Friendly · EVEN
- County
- — inherits STATE
- City
- — inherits STATE
ZIP-level market 48221
- Rents YoY
- 3.4%
- Active inventory
- 349
- Price-to-rent
- 7.0×
Monthly cashflow live
- Estimated rent
- $1,894 medium interval (Pro) →
- Mortgage (P&I)
- −$839
- Tax from tax record
- −$393 /mo · $4,717/yr
- Insurance
- −$67
- HOA
- −$0
- Vacancy / Maint / Mgmt
- −$398
- Net cashflow
- $198
Break-even live
Sensitivity live
| Price | -10% $288 | -5% $243 | +0% $198 | +5% $152 | +10% $107 |
|---|---|---|---|---|---|
| Rent | -10% $48 | -5% $123 | +0% $198 | +5% $272 | +10% $347 |
| Rate | -1.0pp $278 | -0.5pp $238 | base $198 | +0.5pp $156 | +1.0pp $114 |
UW: 25.0% down · 7.5% · 30yr · 1.5% tax · 5.0% vac · 8.0% maint · 8.0% mgmt
Financing live
Cash to close
- Down payment
- $40,000
- Closing costs
- $4,800
- Reserves months
- —
- Total cash needed
- —
Loan-product check · same deal, 3 products live
Conventional
25% down · 7.5% · 30yr
- Down + closing
- —
- Monthly P&I
- —
- Monthly cashflow
- —
- DSCR
- —
- Eligible?
- —
Personal DTI + credit; lowest rate.
DSCR
20% down · 8.5% · 30yr
- Down + closing
- —
- Monthly P&I
- —
- Monthly cashflow
- —
- DSCR
- —
- Eligible?
- —
No personal income docs; deal must DSCR.
Hard money
10% down · 12.0% · 12mo
- Down + closing
- —
- Monthly P&I
- —
- Monthly cashflow
- —
- DSCR
- —
- Eligible?
- —
Short-term bridge; refi at stabilization.
Rent comps 2 comps
| Address | Beds | Baths | Sqft | Rent | $/sqft | DOM | Units | Dist |
|---|---|---|---|---|---|---|---|---|
| 106 Geneva St Highland Park, MI | 5.0 | 1.0 | 1920 | $1,450 | $0.76 | 12d | 1 | 1.14mi |
| 15756 Ohio St Detroit, MI | 5.0 | 2.0 | 1934 | $1,700 | $0.88 | 26d | 1 | 1.32mi |
Listing history 50 events
-
2026-06-21days on market $160,000 Active 76 DOM
-
2026-06-18days on market $160,000 Active 73 DOM
-
2026-06-17days on market $160,000 Active 72 DOM
-
2026-06-15days on market $160,000 Active 70 DOM
-
2026-06-13days on market $160,000 Active 68 DOM
-
2026-06-13days on market $160,000 Active 67 DOM
-
2026-06-09days on market $160,000 Active 64 DOM
-
2026-06-08days on market $160,000 Active 63 DOM
-
2026-06-07days on market $160,000 Active 62 DOM
-
2026-06-04days on market $160,000 Active 59 DOM
-
2026-06-03days on market $160,000 Active 58 DOM
-
2026-06-02days on market $160,000 Active 57 DOM
-
2026-06-01days on market $160,000 Active 56 DOM
-
2026-05-31days on market $160,000 Active 55 DOM
-
2026-04-06$175,000 Active 533-char remark
Show marketing remark (529 chars)
Spacious brick duplex featuring two large units, each offering 3 bedrooms. Just outside the bagley neighborhood in the very desirable Martin Park. Most major updates have already been completed - just bring your finishing touches with new flooring to make it shine. A solid investment or owner-occupant opportunity with strong potential! Very little rehab needed. With an ARV above 230k and each unit should rent out for $1,300 a month totalling $2,600. Cash on Cash return is through the roof!! RECENT APPRAISAL CAME IN AT $240k
-
2026-04-06$175,000 Active 529-char remark
Show marketing remark (529 chars)
Spacious brick duplex featuring two large units, each offering 3 bedrooms. Just outside the bagley neighborhood in the very desirable Martin Park. Most major updates have already been completed - just bring your finishing touches with new flooring to make it shine. A solid investment or owner-occupant opportunity with strong potential! Very little rehab needed. With an ARV above 230k and each unit should rent out for $1,300 a month totalling $2,600. Cash on Cash return is through the roof!! RECENT APPRAISAL CAME IN AT $240k
-
2024-09-17status Pending
-
2024-09-17status Pending
-
2024-09-17soldstatus $99,000 Sold
-
2024-09-17soldstatus $99,000 Closed
-
2024-08-12status Active
-
2024-08-12status Active
-
2024-08-12status Pending
-
2024-08-12status Pending
-
2024-07-09$99,999 Active
-
2024-07-09$99,999 Active
-
2024-07-06historical $99,999
-
2024-07-06historical $99,999
-
2024-01-21historical
-
2024-01-20historical
-
2024-01-04status Active
-
2024-01-04status Active
-
2024-01-01historical
-
2024-01-01historical
-
2023-10-23$139,000 Active
-
2023-10-23$139,000 Active
-
2023-10-21historical
-
2023-10-21historical
-
2023-09-01historical
-
2023-09-01historical
-
2023-06-06price $165,000
-
2023-06-06price $165,000
-
2023-06-02status Active
-
2023-06-02status Active
-
2023-04-21status Pending
-
2023-04-21status Pending
-
2023-04-16historical Accepting Backup Offers
-
2023-04-16historical Accepting Backup Offers
-
2023-03-26price $175,000
-
2023-03-25price $175,000
ⓘ Source: listings_history table (triggers on properties + properties_extension) + one-shot
backfill from property_details.listing_events for pre-trigger history.
Tax reassessment forecast MI · Partial reset (capped growth)
- Current annual tax
- $4,717 · $393/mo
- Projected year-2 tax
- $4,717 · $393/mo
- Expected delta
- $0/yr ($0/mo · 0.0%)
ⓘ Screening estimate from a state-policy table — verify with the county assessor before closing.
Climate risk First Street
- Flood 1/10 Low FEMA zone X (unshaded) · 0% chance over 30 yrs
- Wildfire 1/10 Low
- Heat 3/10 Moderate 7 d/yr ≥97°F today · 14 d/yr by 30 yrs out
- Wind 2/10 Low
- Air quality 4/10 Moderate 4 unhealthy d/yr today · 6 by 30 yrs out
Nearby sold comps map
Loading sold comps map…
Walkable amenities ~0.75 mi
Loading nearby amenities…
Taxation est. · year 1
- Rental income
- $22,730
- − Mortgage interest
- −$8,962
- − Property taxes
- −$4,717
- − Insurance
- −$800
- − Repairs & maintenance
- −$1,818
- − Management
- −$1,818
- − Depreciation
- −$4,655
- Taxable loss
- −$41
- Est. tax savings @ 24.0%
- +$10
- After-tax cash flow
- $2,381/yr
For passive investors: Depreciation is non-cash, so a rental often shows a tax loss while cash-flowing — sheltering income. Rental losses are passive: they offset passive income freely, and up to $25,000/yr can offset ordinary (W-2) income if you actively participate and your MAGI is under $100k (phasing out to $0 by $150k); unused losses carry forward. On sale, claimed depreciation is recaptured at up to 25%, and gains may owe capital-gains tax (a 1031 exchange can defer both). Figures are a year-1 estimate at your 24.0% rate — not tax advice; consult a CPA.
Schools (NCES district)
- District
- Detroit Public Schools Community District
- NCES district ID
- 2601103
- Math proficiency
- 10% ▼ -2.00%
- Reading proficiency
- 24% ▲ 6.00%
- Median HH income
- $25,815
- Composite
- 13.06/100
- National rank
- #9564
- State rank
- #499 of 540 in MI
Livability — Detroit
- Score
- 73/100
- State rank
- #218
- US rank
- #5427
Category grades
Schools grade is shown separately in the Schools card above.
Census & demographics
- Census place
- Detroit, MI
- County
- Wayne County · 1,562,939 people
- City population
- 572,865
- Metro
- Detroit-Warren-Dearborn, MI
- Population (ZIP)
- 41,392
- Household income
- $57,878
- Rent vs Own
- Severe rent burden
- 1646.0
Population outlook (Wayne County) Hauer SSP2
- Today (2025)
- 1,675,273 people
- By 2030
- 1,620,300 · -3.3%
- By 2040
- 1,502,341 · -10.3%
- By 2050
- 1,384,039 · -17.4%
- By 2075
- 1,124,592 · -32.9%
- By 2100
- 881,193 · -47.4%
Race, ethnicity, and origin ACS 2023
- Neighborhood character
- Predominantly Black (85%)
- Race & ethnicity
- Black 85% White 8% Two or more races 4% Asian 1%
- Common ancestry
- Romanian 1% Lithuanian 1%
- Foreign-born
- 2% · Canada
- Languages at home
- 97% English-only · Spanish 1% Other Indo-European 1%
Political lean MEDSL · Wayne
- 2024 margin
- Strong D (+29.0) · D 62.7% · R 33.7% · Other 3.6%
- 2008→2024 swing
- -20.5pp toward R · 2008: 49.5pp · 2024: 29.0pp
- All cycles
- 2024: D+29.0 2020: D+38.1 2016: D+37.3 2012: D+46.9 2008: D+49.5
Not yet ingested
- Civics
- —
Market trends
- HPI YoY
- ▼ -433.14%
- Current HPI
- 280.5434
- Rent YoY
- ▲ 3.44%
- Metro
- Detroit-Warren-Dearborn, MI
- State GDP YoY
- ▲ 1.37%
- F500 in state
- 28
Industry mix (Fortune 500 HQ in MI)
| Industry | F500 HQs | Revenue |
|---|---|---|
| Automotive Parts | 3 | $48B |
|
||
| Automotive | 2 | $372B |
|
||
| Chemicals | 1 | $45B |
|
||
| Automotive Retail | 1 | $29B |
|
||
| Healthcare / Medical Devices | 1 | $23B |
|
||
| Automotive Technology | 1 | $20B |
|
||
Price history
+192.2% since first listed50 events — show timeline
- 2026-04-06 Listed $175,000 REALCOMP
- 2026-04-06 Listed $175,000 MiRealSource-MiMLS
- 2024-09-17 Pending — MiRealSource-MiMLS
- 2024-09-17 Pending — REALCOMP
- 2024-09-17 Sold (MLS) $99,000 MiRealSource-MiMLS
- 2024-09-17 Sold (MLS) $99,000 REALCOMP
- 2024-08-12 Relisted — REALCOMP
- 2024-08-12 Relisted — MiRealSource-MiMLS
- 2024-08-12 Pending — MiRealSource-MiMLS
- 2024-08-12 Pending — REALCOMP
- 2024-07-09 Listed $99,999 MiRealSource-MiMLS
- 2024-07-09 Listed $99,999 REALCOMP
- 2024-07-06 Coming Soon $99,999 MiRealSource-MiMLS
- 2024-07-06 Coming Soon $99,999 REALCOMP
- 2024-01-21 Listing Removed — MiRealSource-MiMLS
- 2024-01-20 Listing Removed — REALCOMP
- 2024-01-04 Relisted — MiRealSource-MiMLS
- 2024-01-04 Relisted — REALCOMP
- 2024-01-01 Listing Removed — MiRealSource-MiMLS
- 2024-01-01 Listing Removed — REALCOMP
- 2023-10-23 Listed $139,000 MiRealSource-MiMLS
- 2023-10-23 Listed $139,000 REALCOMP
- 2023-10-21 Coming Soon — MiRealSource-MiMLS
- 2023-10-21 Coming Soon — REALCOMP
- 2023-09-01 Listing Removed — MiRealSource-MiMLS
- 2023-09-01 Listing Removed — REALCOMP
- 2023-06-06 Price Changed $165,000 MiRealSource-MiMLS
- 2023-06-06 Price Changed $165,000 REALCOMP
- 2023-06-02 Relisted — MiRealSource-MiMLS
- 2023-06-02 Relisted — REALCOMP
- 2023-04-21 Pending — MiRealSource-MiMLS
- 2023-04-21 Pending — REALCOMP
- 2023-04-16 Contingent — MiRealSource-MiMLS
- 2023-04-16 Contingent — REALCOMP
- 2023-03-26 Price Changed $175,000 MiRealSource-MiMLS
- 2023-03-25 Price Changed $175,000 REALCOMP
- 2023-03-02 Listed $185,000 MiRealSource-MiMLS
- 2023-03-02 Listed $185,000 REALCOMP
- 2023-02-23 Coming Soon — MiRealSource-MiMLS
- 2023-02-23 Coming Soon — REALCOMP
- 2018-02-01 Sold (MLS) $40,000 MiRealSource-MiMLS
- 2018-02-01 Sold (MLS) $40,000 REALCOMP
- 2017-12-09 Pending — MiRealSource-MiMLS
- 2017-12-09 Pending — REALCOMP
- 2017-11-20 Price Changed $47,500 MiRealSource-MiMLS
- 2017-11-20 Price Changed $47,500 REALCOMP
- 2017-11-05 Price Changed $50,000 MiRealSource-MiMLS
- 2017-11-04 Price Changed $50,000 REALCOMP
- 2017-10-21 Listed $59,900 MiRealSource-MiMLS
- 2017-10-21 Listed $59,900 REALCOMP
Property tax history
+9.1%/yrLatest (2025): $4,717 · +41.0% YoY. Source: county tax records.
Cash-flow waterfall
monthlySold comps — $/sqft
last 12 mo · ≤1 miLoading sold comps…