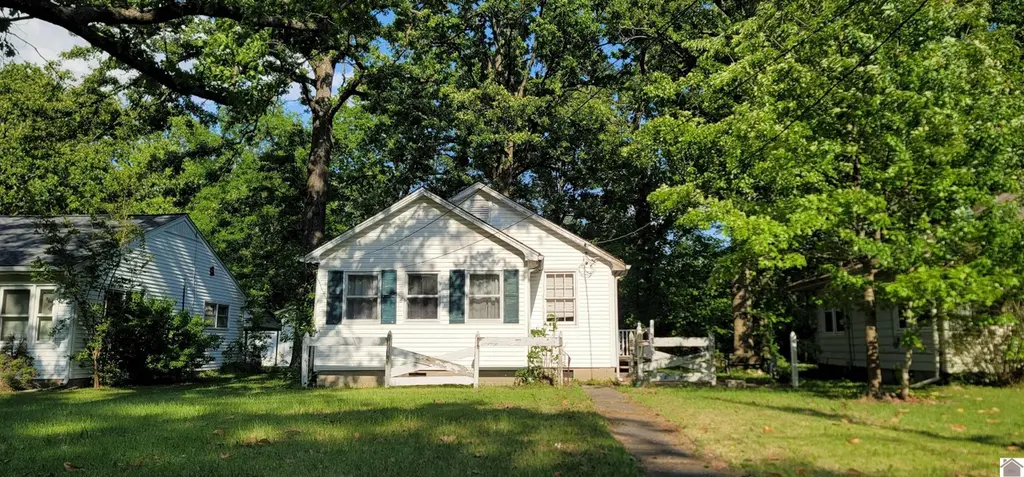
752 H C Mathis Dr · Paducah, KY
Flood risk 3/10 · Minor
- FEMA flood zone
- X
- Chance of flooding over 30 yrs
- 0.2%
- Est. flood insurance / yr
- $507 – $1,088
Fire risk 3/10 · Minor
- Est. fire insurance / yr
- $839 – $1,559
Heat risk 6/10 · Moderate
- Hot days now (above 108°F)
- 7 days/yr
- Hot days in 30 yrs
- 20 days/yr
Wind risk 3/10 · Minor
- Chance of severe wind over 30 yrs
- 6.0%
Air-quality risk 3/10 · Minor
- Unhealthy air days now
- 1 days/yr
- Unhealthy air days in 30 yrs
- 4 days/yr
Risk factors via First Street. Map © Google.
Why this score? — see what drove the B- grade
The composite is a weighted blend of 9 inputs, each scored 0–100. Each bar is that input's sub-score; the figure is the points it added to the 100-point composite (weight × sub-score).
- Cash flow +30.0/30.0
- 1% rule +10.0/10.0
- DSCR +10.0/10.0
- ARV discount +7.5/15.0
- Livability +3.4/5.0
- Rent growth +2.5/5.0
- Schools +2.3/10.0
- Condition / age +2.2/5.0
- Appreciation +0.0/10.0
$50,000
🖨 Deal sheet 📄 Offer letter ✓ Due diligence
Listing remarks
EXPONENTIAL POTENTIAL! This 2 bedroom, 1 bath house has charm, great access within the city to restaurants, shopping, downtown, recreational venues, medical facilities, and directly across from Bob Noble Park! Private parking is available off of the back alley, with a large storage shed also situated in back. The enclosed front porch is very spacious, as is the living room & dining area, and the utility room! Both bedrooms have the original hardwood flooring. This property is a great find for an investor, flipper or DIY-er!
Key facts
- Private parking
- Large storage shed
- Enclosed front porch
Tags
Property features AI
Exterior
- Parking: Alley access for rear parking
- Utilities: Public water; Public sewer; Natural gas available
- Home design: Single-family residence; One story
- Construction: Frame construction; Vinyl siding
- Exterior features: Level lot; Outbuilding
Interior
- Flooring: Carpet; Laminate; Vinyl; Wood
- Bathrooms: 1 full bathroom
- Heating & cooling: Natural gas heating; Central air; Ceiling fans
- Interior features: Gas water heater; Crawl space basement
Neighborhood map
What this means for you Summary
Snapshot
- This is a 2-bed/1.0-bath single-family listed at $50k. Condition is rated fair.
Deal economics
- At list price, monthly cash flow is $437 ($5k/yr) — positive.
- The deal already cash-flows at list — no discount required.
- Meets the 1% rule at list price ($990 rent vs $50k).
- Recommended offer: $49k (1.5% below list) — sets the bar for market timing.
- Cap rate 16.8% vs local median 4.5% in Paducah — top-decile yield for the area; either an underpriced asset or a hidden risk that comps aren't pricing in. Stress-test before assuming the spread holds.
Location & tenants
- Location reads 68/100 on livability (#197 in KY) — a middle-class / working-renter tenant base. Strengths: cost of living A+, housing A+, health & safety A+; Watch: crime C-, employment D, amenities F.
- Paducah Independent (town): math 22% / reading 36% proficiency, ranked #122 of 165 in KY (top 74%) — low school quality limits family demand, transient renter base, plan for 1-2y turnover; 69% free/reduced lunch — lower-income household profile, screen leases tightly.
- Zoned schools: Mcnabb Elementary School (math 8% / reading 17%, grade F, #630 of 676 statewide, top 95%, 322 students, 91% FRL); Paducah Middle School (math 19% / reading 36%, grade F, #168 of 217 statewide, top 78%, 652 students, 69% FRL); Paducah Tilghman High School (math 22% / reading 42%, grade F, #97 of 254 statewide, top 46%, 878 students, 64% FRL).
- Market conditions: 248 active listings in the ZIP; 5 comparable units currently listed for rent nearby; rentals lingering (median 44d on market — plan ~5-8 weeks vacancy on turnover, expect pricing pressure); 100% of comp listings sitting > 30 days — soft ceiling on asking rent; 187 units permitted in McCracken County in 2024 (104 in 5+ unit buildings).
- This rent is only 17% of the median local income ($71k/yr) — well below the 30% rent-burden line; pricing power to push rent on renewal without tenant pushback.
Forward outlook
- Local home prices are declining (-3.0%/yr); year-one equity from $346 of loan paydown is wiped out by about $2k of value loss. Plan a longer hold.
- McCracken County population projected to shrink 9% by 2050 — rents likely to lag national; underwrite the cash flow, not the appreciation.
- At projected returns (-3.0% appreciation + 3.0% rent growth), your $14k cash investment doubles in ~4 years — after that, you're playing with house money.
Negotiation context
- It's been on market 21 days — a 2% lower offer ($49k) is reasonable based on typical stale-listing flexibility.
Risks & watch-outs
- Watch-outs: built in 1952 — expect roof / HVAC / electrical / plumbing capex.
- Climate carrying-cost: extreme-heat days projected 7→20/yr by 2055 (HVAC capex compounding) — expect insurance premiums to compound above CPI over the hold.
Questions for the listing agent
- Have any recent inspections been done? Can we get a copy of the seller's disclosures and any deferred-maintenance estimates?
- Built in 1952 — when were the roof, HVAC, electrical panel, plumbing, and water heater last replaced?
- Is there a deadline driving the sale (1031 exchange, divorce, estate, relocation)? That informs how much negotiation room exists.
- Schools are D-rated, which usually means shorter tenancies and higher turnover. Who's the typical renter profile here, and what's been the actual vacancy rate?
- What's the average days-on-market for RENTAL listings here right now (not sales)? A rising rental-DOM trend means longer vacancies and softer asking-rent achievability than the comps imply.
- What's the recent tenant-quality profile in this submarket — average credit score on applications, eviction rate, late-payment / NSF rate, and stable-employment percentage? A property-management company in the area should have these aggregated.
- How much new for-sale + rental construction is in the pipeline within 1–3 miles? Heavy new supply typically softens prices + rents 12–24 months out; constrained supply supports both.
Investment metrics
- 1% rule
- 1.98% ✓
- Cap rate
- 16.77%
- Cash-on-cash
- 37.42%
- DSCR
- 2.67
- GRM
- 4.2
CMA / ARV
- ARV (median comp)
- $104,959
- List price
- $50,000
- Delta
- -52.36%
- Verdict
- UNDERPRICED
- Comps
- 20 within 1.0 mi
Show comp detail 12 sales within ~0.75 mi
| Address | Dist | Beds/Ba | Sqft | Sold | Price | $/sf | Match |
|---|---|---|---|---|---|---|---|
| 752 H C Mathis Dr | 0.00mi | 2/1.0 | 960 (0%) | 1mo | $51,000 | $53 | 99 |
| 733 N 26th St | 0.05mi | 2/1.0 | 952 (-1%) | 1mo | $106,000 | $111 | 96 |
| 806 H C Mathis Dr | 0.04mi | 2/1.0 | 978 (+2%) | 2mo | $87,000 | $89 | 93 |
| 751 N 22nd St | 0.32mi | 2/1.0 | 980 (+2%) | 6mo | $28,000 | $29 | 77 |
| 906 N 26th St | 0.15mi | 3/1.0 (+1) | 864 (-10%) | 0mo | $78,000 | $90 | 71 |
| 706 N 23rd St | 0.29mi | 3/1.0 (+1) | 1,006 (+5%) | 3mo | $28,000 | $28 | 71 |
| 725 N 24th St | 0.18mi | 2/1.0 | 1,082 (+13%) | 3mo | $120,000 | $111 | 68 |
| 915 N 25th St | 0.18mi | 3/1.0 (+1) | 864 (-10%) | 4mo | $105,000 | $122 | 67 |
| 2948 Trimble St | 0.57mi | 3/1.0 (+1) | 980 (+2%) | 5mo | $130,000 | $133 | 61 |
| 1900 Harrison St | 0.64mi | 1/1.0 (-1) | 984 (+2%) | 1mo | $130,000 | $132 | 60 |
| 2600 Monroe St | 0.63mi | 2/1.0 | 899 (-6%) | 4mo | $127,500 | $142 | 56 |
| 1920 Harrison St | 0.59mi | 2/1.0 | 1,100 (+15%) | 3mo | $19,900 | $18 | 46 |
Match score weights: distance 35% · size 25% · config 20% · recency 20%. Top-matched comps best support the ARV.
Projected returns pro-forma
-3.0% appreciation · 3.0% rent growth · sell at horizon
- IRR
- 33.4%
- Equity multiple
- 2.41×
- Total profit
- $19,720
- Equity at exit
- $7,455
- IRR
- 40.3%
- Equity multiple
- 4.79×
- Total profit
- $53,039
- Equity at exit
- $4,323
Cash invested: $14,000 (down + closing). Projections, not guarantees.
Landlord ↔ Tenant lean methodology
- Overall (STATE)
- 83 Strongly Landlord-Friendly
- State Kentucky
- 83 Strongly Landlord-Friendly · R+16
- County
- — inherits STATE
- City
- — inherits STATE
ZIP-level market 42001
- Home prices YoY
- -24.8%
- Active inventory
- 248
- Price-to-rent
- 4.2×
Monthly cashflow live
- Estimated rent
- $990 high interval (Pro) →
- Mortgage (P&I)
- −$262
- Tax est. 1.5%
- −$62 /mo · $750/yr
- Insurance
- −$21
- HOA
- −$0
- Vacancy / Maint / Mgmt
- −$208
- Net cashflow
- $437
Break-even live
UW: 25.0% down · 7.5% · 30yr · 1.5% tax · 5.0% vac · 8.0% maint · 8.0% mgmt
Financing live
Cash to close
- Down payment
- $12,500
- Closing costs
- $1,500
- Reserves months
- —
- Total cash needed
- —
Loan-product check · same deal, 3 products live
Conventional
25% down · 7.5% · 30yr
- Down + closing
- —
- Monthly P&I
- —
- Monthly cashflow
- —
- DSCR
- —
- Eligible?
- —
Personal DTI + credit; lowest rate.
DSCR
20% down · 8.5% · 30yr
- Down + closing
- —
- Monthly P&I
- —
- Monthly cashflow
- —
- DSCR
- —
- Eligible?
- —
No personal income docs; deal must DSCR.
Hard money
10% down · 12.0% · 12mo
- Down + closing
- —
- Monthly P&I
- —
- Monthly cashflow
- —
- DSCR
- —
- Eligible?
- —
Short-term bridge; refi at stabilization.
Rent comps 5 comps
| Address | Beds | Baths | Sqft | Rent | $/sqft | DOM | Units | Dist |
|---|---|---|---|---|---|---|---|---|
| 2741 Trimble St Unit 27195 Paducah, KY | 2.0 | 1.0 | 850 | $725 | $0.85 | 43d | 1 | 0.37mi |
| 2991 Clay St Unit 06 Paducah, KY | 2.0 | 1.0 | 974 | $715 | $0.73 | 43d | 1 | 0.64mi |
| 2967 Harrison St Paducah, KY | 1.0–2.0 | 1.0 | 725 | $915 | $1.26 | 43d | 1 | 0.67mi |
| 1900 Jefferson St Paducah, KY | 2.0 | 1.0 | 800 | $1,400 | $1.75 | 43d | 1 | 0.83mi |
| 922 S 27th St Unit A Paducah, KY | 2.0 | 1.0 | 600 | $875 | $1.46 | 43d | 1 | 1.46mi |
Listing history 1 events
-
2026-04-28$50,000 Active 535-char remark
ⓘ Source: listings_history table (triggers on properties + properties_extension) + one-shot
backfill from property_details.listing_events for pre-trigger history.
Climate risk First Street
- Flood 3/10 Moderate FEMA zone X · 20% chance over 30 yrs
- Wildfire 3/10 Moderate
- Heat 6/10 Major 7 d/yr ≥108°F today · 20 d/yr by 30 yrs out
- Wind 3/10 Moderate 6% chance of damaging wind over 30 yrs
- Air quality 3/10 Moderate 1 unhealthy d/yr today · 4 by 30 yrs out
Nearby sold comps map
Loading sold comps map…
Walkable amenities ~0.75 mi
Loading nearby amenities…
Taxation est. · year 1
- Rental income
- $11,881
- − Mortgage interest
- −$2,801
- − Property taxes
- −$750
- − Insurance
- −$250
- − Repairs & maintenance
- −$950
- − Management
- −$950
- − Depreciation
- −$1,455
- Taxable income
- $4,724
- Est. tax owed @ 24.0%
- −$1,134
- After-tax cash flow
- $4,105/yr
For passive investors: Depreciation is non-cash, so a rental often shows a tax loss while cash-flowing — sheltering income. Rental losses are passive: they offset passive income freely, and up to $25,000/yr can offset ordinary (W-2) income if you actively participate and your MAGI is under $100k (phasing out to $0 by $150k); unused losses carry forward. On sale, claimed depreciation is recaptured at up to 25%, and gains may owe capital-gains tax (a 1031 exchange can defer both). Figures are a year-1 estimate at your 24.0% rate — not tax advice; consult a CPA.
Condition & rehab AI · 1 photo
This 2-bedroom, 1-bath home has potential for significant value increase with moderate renovations, including painting and siding repair.
Repairs flagged
- Major siding — Significant wear and tear
- Major paint — Peeling and faded paint
Value-add opportunities
- Both painting — Fresh paint enhances curb appeal and interior aesthetics
- Both siding repair — New siding improves curb appeal and potential for energy efficiency
Renovation cost estimate screening
| Repair item | Severity | Est. cost |
|---|---|---|
| siding · Significant wear and tear | Major | $15,000–50,000 |
| paint · Peeling and faded paint | Major | $15,000–50,000 |
| Total estimated repair cost · 2 items | $30,000–100,000 |
Value-add ROI direction
- Both painting — Fresh paint enhances curb appeal and interior aesthetics ↑
- Both siding repair — New siding improves curb appeal and potential for energy efficiency ↑
ⓘ Cost ranges are severity-bucket heuristics (US national rule-of-thumb). Get contractor quotes + a written scope before underwriting a rehab budget.
Schools (NCES district)
- District
- Paducah Independent
- NCES district ID
- 2104650
- Math proficiency
- 22% ▼ -14.00%
- Reading proficiency
- 36% ▼ -17.00%
- Median HH income
- $30,067
- Composite
- 23.41/100
- National rank
- #7896
- State rank
- #122 of 165 in KY
Livability — Paducah
- Score
- 68/100
- State rank
- #197
- US rank
- #9780
Category grades
Schools grade is shown separately in the Schools card above.
Census & demographics
- Census place
- Paducah, KY
- County
- McCracken County · 30,856 people
- City population
- 30,856
- Metro
- Paducah, KY-IL
- Population (ZIP)
- 30,856
- Household income
- $71,365
- Rent vs Own
- Severe rent burden
- 1001.0
Population outlook (McCracken County) Hauer SSP2
- Today (2025)
- 64,237 people
- By 2030
- 63,468 · -1.2%
- By 2040
- 61,221 · -4.7%
- By 2050
- 58,432 · -9.0%
- By 2075
- 52,668 · -18.0%
- By 2100
- 44,517 · -30.7%
Race, ethnicity, and origin ACS 2023
- Neighborhood character
- Predominantly White (78%)
- Race & ethnicity
- White 78% Black 13% Two or more races 6% Hispanic / Latino 2% Asian 1%
- Common ancestry
- Lithuanian 2% Italian 2% Serbian 2%
- Foreign-born
- 2% · Canada, China
- Languages at home
- 97% English-only · Spanish 1%
Political lean MEDSL · McCracken
- 2024 margin
- Solid R (+34.9) · D 31.9% · R 66.8% · Other 1.2%
- 2008→2024 swing
- -9.7pp toward R · 2008: -25.2pp · 2024: -34.9pp
- All cycles
- 2024: R+34.9 2020: R+31.7 2016: R+37.2 2012: R+32.5 2008: R+25.2
Not yet ingested
- Civics
- —
Market trends
- HPI YoY
- ▼ -85.23%
- Current HPI
- 258.1706
- Rent YoY
- —
- Metro
- Paducah, KY-IL
- State GDP YoY
- ▲ 1.81%
- F500 in state
- 4
Industry mix (Fortune 500 HQ in KY)
| Industry | F500 HQs | Revenue |
|---|---|---|
| Healthcare | 1 | $118B |
|
||
| Food / Beverage | 1 | $7B |
|
||
Price history
+2.0% since first listed3 events — show timeline
- 2026-05-21 Sold (MLS) $51,000 WKRMLS
- 2026-05-19 Pending — WKRMLS
- 2026-04-28 Listed $50,000 WKRMLS
Cash-flow waterfall
monthlySold comps — $/sqft
last 12 mo · ≤1 miLoading sold comps…