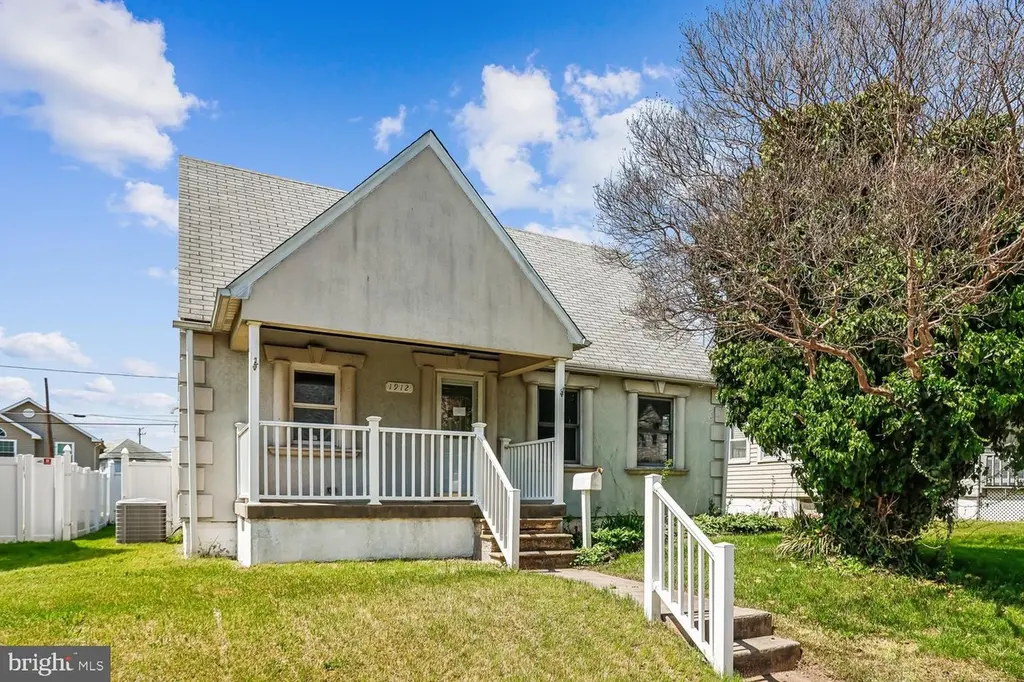
1912 Queensway · Dundalk, MD
Flood risk 1/10 · Minimal
- FEMA flood zone
- X (unshaded)
- Chance of flooding over 30 yrs
- 0.0%
- Est. flood insurance / yr
- $473 – $860
Fire risk 1/10 · Minimal
- Est. fire insurance / yr
- $755 – $1,403
Heat risk 8/10 · Major
- Hot days now (above 104°F)
- 7 days/yr
- Hot days in 30 yrs
- 15 days/yr
Wind risk 6/10 · Moderate
- Chance of severe wind over 30 yrs
- 27.0%
Air-quality risk 5/10 · Moderate
- Unhealthy air days now
- 6 days/yr
- Unhealthy air days in 30 yrs
- 8 days/yr
Risk factors via First Street. Map © Google.
Why this score? — see what drove the C- grade
The composite is a weighted blend of 9 inputs, each scored 0–100. Each bar is that input's sub-score; the figure is the points it added to the 100-point composite (weight × sub-score).
- Cash flow +15.8/30.0
- ARV discount +14.6/15.0
- DSCR +4.9/10.0
- Livability +4.2/5.0
- 1% rule +4.1/10.0
- Rent growth +2.5/5.0
- Condition / age +2.5/5.0
- Schools +2.3/10.0
- Appreciation +0.0/10.0
$224,900
🖨 Deal sheet (PDF) 📄 Offer letter ✓ Due diligence
Listing remarks
Welcome to 1912 Queensway—an incredible opportunity to create the home you’ve always envisioned. Full of character and untapped potential, this charming property is ready for its next chapter and invites you to bring your personal style and updates to make it truly your own. The main level features hardwood floors, two comfortable bedrooms, and a full bathroom. A bright, open kitchen that flows beautifully into a spacious dining room/sitting room combination—an ideal space for hosting or simply enjoying everyday living filled with natural light. Upstairs, you have a spacious open area with endless possibilities. Whether you imagine a private third bedroom, a home office,
Key facts
- 4,848 sq ft lot
- Garage
- Built 1940
Property features AI
Exterior
- Parking: Detached garage (rear entry); Driveway with two spaces; Three total garage/parking spaces
- Utilities: Public water; Public sewer; Natural gas hot water; Natural gas heating
- Home design: Detached property
- Construction: Stucco exterior; Block foundation with crawl space; Above-grade and below-grade structures
- Exterior features: Deck(s); Partially finished basement
Interior
- Kitchen: Combination kitchen/dining
- Bedrooms: Two bedrooms on the main level; One bedroom on the upper level
- Flooring: Hardwood
- Bathrooms: One full bathroom on the main level; One full bathroom total
- Heating & cooling: Central heating; Electric cooling (other type)
- Interior features: Attic; Ceiling fan(s); Combination kitchen/dining area; Traditional floor plan; Wood floors
- Laundry & utility: Laundry in the basement
Neighborhood map
What this means for you Summary
Snapshot
- This is a 3-bed/1.0-bath single-family listed at $225k.
Deal economics
- At list price, monthly cash flow is $104 ($1k/yr) — positive.
- The deal already cash-flows at list — no discount required.
- To meet the 1% rule (rent ≥ 1% of price), the offer needs to be $204k (9.2% below list).
- Recommended offer: $204k (9.2% below list) — sets the bar for 1% rule.
Location & tenants
- Location reads 85/100 on livability (#16 in MD, #510 nationally) — a professional / high-income tenant draw. Strengths: amenities A+, commute A+, housing A+; Watch: crime F.
- Baltimore County Public Schools (suburban): math 15% / reading 34% proficiency, ranked #11 of 24 in MD (top 46%) — low school quality limits family demand, transient renter base, plan for 1-2y turnover.
- Zoned schools: Dundalk Elementary (math 6% / reading 8%, grade F, #726 of 860 statewide, top 86%, 743 students, 74% FRL); Dundalk Middle (math 2% / reading 13%, grade F, #217 of 225 statewide, top 97%, 860 students, 64% FRL); Dundalk High (math 5% / reading 33%, grade F, #177 of 222 statewide, top 80%, 2,193 students, 62% FRL) — zoned schools average 66% FRL vs 39% district-wide (28 pts higher); higher-poverty schools than district average — tighter screening recommended.
- Zoned-school proficiency averages 11% at this address vs 24% district-wide (-13 pts) — the specific schools serving this property underperform the Baltimore County Public Schools average; the district grade overstates school quality for this exact location.
- Market conditions: Rents soft (-0.1%/yr); 238 active listings in the ZIP; 29 comparable units currently listed for rent nearby; rentals at typical pace (median 20d on market — plan ~3-4 weeks tenant-placement turnaround); 1,511 units permitted in Baltimore County in 2024 (643 in 5+ unit buildings).
- This rent runs 38% of the median local income ($64k/yr) — at the standard rent-burdened threshold; future hikes will face affordability resistance.
Forward outlook
- Local home prices are declining (-3.0%/yr); year-one equity from $2k of loan paydown is wiped out by about $7k of value loss. Plan a longer hold.
- Baltimore County population projected at +12% by 2050 — modest demand growth; plan on rents tracking national, not racing it.
Negotiation context
- Only 11 days on market — expect competitive offers; lowballing is unlikely to land.
- Current owner paid $88k; list at $225k implies a 157% gain — meaningful room to come down on a strong offer.
Risks & watch-outs
- Watch-outs: built in 1940 — expect roof / HVAC / electrical / plumbing capex.
- Climate carrying-cost: major wind risk, 27% chance of damaging wind over 30y; extreme-heat days projected 7→15/yr by 2055 (HVAC capex compounding) — expect insurance premiums to compound above CPI over the hold.
Questions for the listing agent
- Built in 1940 — when were the roof, HVAC, electrical panel, plumbing, and water heater last replaced?
- Is there a deadline driving the sale (1031 exchange, divorce, estate, relocation)? That informs how much negotiation room exists.
- Schools are A-rated — typically a magnet for longer-tenancy family renters. What's the average tenant stay here, and is there a school-zone premium baked into asking?
- Crime grade is F in this area — have there been break-ins, vandalism, or insurance claims at this property in the last 3 years? What carrier currently insures it and at what premium?
- What's the average days-on-market for RENTAL listings here right now (not sales)? A rising rental-DOM trend means longer vacancies and softer asking-rent achievability than the comps imply.
- What's the recent tenant-quality profile in this submarket — average credit score on applications, eviction rate, late-payment / NSF rate, and stable-employment percentage? A property-management company in the area should have these aggregated.
- How much new for-sale + rental construction is in the pipeline within 1–3 miles? Heavy new supply typically softens prices + rents 12–24 months out; constrained supply supports both.
Investment metrics
- 1% rule
- 0.91% ✗
- Cap rate
- 6.85%
- Cash-on-cash
- 1.98%
- DSCR
- 1.09
- GRM
- 9.2
CMA / ARV
- ARV (on-the-fly)
- $267,264
- Comps found
- 12
Show comp detail 12 sales within ~0.75 mi
| Address | Dist | Beds/Ba | Sqft | Sold | Price | $/sf | Match |
|---|---|---|---|---|---|---|---|
| 1912 Queensway | 0.00mi | 3/1.0 | 1,392 (0%) | 1mo | $225,000 | $162 | 99 |
| 1818 Maxwell Ave | 0.22mi | 3/2.0 | 1,320 (-5%) | 4mo | $275,000 | $208 | 73 |
| 6818 Holabird Ave | 0.32mi | 3/2.0 | 1,395 (+0%) | 10mo | $200,000 | $143 | 72 |
| 1902 Queensway | 0.04mi | 3/1.5 | 1,514 (+9%) | 12mo | $290,000 | $192 | 72 |
| 5 Liberty Pkwy | 0.26mi | 2/2.0 (-1) | 1,240 (-11%) | 2mo | $264,000 | $213 | 60 |
| 22 Leeway Rd | 0.58mi | 3/2.0 | 1,388 (-0%) | 11mo | $300,000 | $216 | 60 |
| 214 Maple Ave | 0.34mi | 4/2.0 (+1) | 1,492 (+7%) | 9mo | $100,000 | $67 | 56 |
| 6701 Bessemer Ave | 0.66mi | 3/1.0 | 1,480 (+6%) | 4mo | $148,000 | $100 | 55 |
| 103 Wells Ave | 0.22mi | 3/2.0 | 1,190 (-14%) | 9mo | $220,000 | $185 | 54 |
| 1906 Jackson Rd | 0.29mi | 3/1.0 | 1,200 (-14%) | 13mo | $270,000 | $225 | 53 |
| 1830 Walnut Ave | 0.54mi | 3/2.0 | 1,236 (-11%) | 10mo | $315,000 | $255 | 44 |
| 1776 Brookview Rd | 0.54mi | 4/1.0 (+1) | 1,209 (-13%) | 6mo | $201,000 | $166 | 43 |
Match score weights: distance 35% · size 25% · config 20% · recency 20%. Top-matched comps best support the ARV.
Projected returns pro-forma
-3.0% appreciation · 0.0% rent growth · sell at horizon
- IRR
- -16.5%
- Equity multiple
- 0.43×
- Total profit
- $-35,789
- Equity at exit
- $33,533
- IRR
- -14.6%
- Equity multiple
- 0.27×
- Total profit
- $-45,731
- Equity at exit
- $19,445
Cash invested: $62,972 (down + closing). Projections, not guarantees.
Landlord ↔ Tenant lean methodology
- Overall (STATE)
- 27 Tenant-Leaning
- State Maryland
- 27 Tenant-Leaning · D+14
- County
- — inherits STATE
- City
- — inherits STATE
ZIP-level market 21222
- Rents YoY
- -0.1%
- Active inventory
- 238
- Price-to-rent
- 9.2×
Monthly cashflow live
- Estimated rent
- $2,041 high interval (Pro) →
- Mortgage (P&I)
- −$1,179
- Tax from tax record
- −$235 /mo · $2,825/yr
- Insurance
- −$94
- HOA
- −$0
- Vacancy / Maint / Mgmt
- −$429
- Net cashflow
- $104
Break-even live
Sensitivity live
| Price | -10% $231 | -5% $168 | +0% $104 | +5% $41 | +10% $-23 |
|---|---|---|---|---|---|
| Rent | -10% $-57 | -5% $24 | +0% $104 | +5% $185 | +10% $265 |
| Rate | -1.0pp $217 | -0.5pp $161 | base $104 | +0.5pp $46 | +1.0pp $-13 |
UW: 25.0% down · 7.5% · 30yr · 1.5% tax · 5.0% vac · 8.0% maint · 8.0% mgmt
Financing live
Cash to close
- Down payment
- $56,225
- Closing costs
- $6,747
- Reserves months
- —
- Total cash needed
- —
Loan-product check · same deal, 3 products live
Conventional
25% down · 7.5% · 30yr
- Down + closing
- —
- Monthly P&I
- —
- Monthly cashflow
- —
- DSCR
- —
- Eligible?
- —
Personal DTI + credit; lowest rate.
DSCR
20% down · 8.5% · 30yr
- Down + closing
- —
- Monthly P&I
- —
- Monthly cashflow
- —
- DSCR
- —
- Eligible?
- —
No personal income docs; deal must DSCR.
Hard money
10% down · 12.0% · 12mo
- Down + closing
- —
- Monthly P&I
- —
- Monthly cashflow
- —
- DSCR
- —
- Eligible?
- —
Short-term bridge; refi at stabilization.
Rent comps 29 comps
| Address | Beds | Baths | Sqft | Rent | $/sqft | DOM | Units | Dist |
|---|---|---|---|---|---|---|---|---|
| 6722 Brentwood Ave Unit 2FL Dundalk, MD | 3.0 | 1.0 | 900 | $1,750 | $1.94 | 45d | 1 | 0.44mi |
| 1955 Walnut Ave Dundalk, MD | 3.0 | 1.0 | 950 | $2,300 | $2.42 | 45d | 1 | 0.50mi |
| 266 Saint Helena Ave Dundalk, MD | 3.0 | 1.0 | 1305 | $1,900 | $1.46 | 14d | 1 | 0.55mi |
| 12 Leeway Dundalk, MD | 3.0 | 1.0 | 1358 | $1,750 | $1.29 | 45d | 1 | 0.58mi |
| 6552 Parnell Ave Dundalk, MD | 2.0 | 1.5 | 885 | $1,500 | $1.69 | 19d | 1 | 0.63mi |
| 2624 Liberty Pkwy Dundalk, MD | 3.0 | 1.5 | 1110 | $1,856 | $1.67 | 45d | 1 | 0.64mi |
| 1533 Leslie Rd Dundalk, MD | 4.0 | 1.0 | 1270 | $2,000 | $1.57 | 45d | 1 | 0.66mi |
| 6537 Baltimore Ave Baltimore, MD | 3.0 | 1.0 | 1272 | $1,700 | $1.34 | 3d | 1 | 0.70mi |
| 1329 Bethlehem Ave Dundalk, MD | 3.0 | 2.0 | 1800 | $2,700 | $1.50 | 0d | 1 | 0.82mi |
| 78 N Dundalk Ave Dundalk, MD | 4.0 | 2.0 | 1545 | $2,200 | $1.42 | 25d | 1 | 0.83mi |
| 7003 Dunmanway Dundalk, MD | 1.0–2.0 | 1.0 | 772 | $1,345 | $1.74 | 3d | 13 | 0.87mi |
| 1504 Elrino St Baltimore, MD | 2.0 | 2.0 | 1050 | $1,650 | $1.57 | 6d | 1 | 0.98mi |
| 2959 Liberty Pkwy Dundalk, MD | 3.0 | 2.0 | 1479 | $2,150 | $1.45 | 45d | 1 | 1.02mi |
| 638 Villager Cir Dundalk, MD | 3.0 | 3.5 | 1572 | $2,450 | $1.56 | 19d | 1 | 1.04mi |
| 2952 Sollers Point Rd Unit B Dundalk, MD | 2.0 | 1.0 | 1874 | $1,290 | $0.69 | 6d | 1 | 1.05mi |
| 2976 Cornwall Rd Unit 1 Dundalk, MD | 2.0 | 1.0 | 900 | $1,590 | $1.77 | 16d | 1 | 1.06mi |
| 643 47th St Baltimore, MD | 2.0 | 2.0 | 1620 | $2,100 | $1.30 | 14d | 1 | 1.06mi |
| 1915 Merritt Blvd Dundalk, MD | 3.0 | 2.0 | 1208 | $2,500 | $2.07 | 45d | 1 | 1.13mi |
| 3231 Dundalk Ave Dundalk, MD | 3.0 | 2.0 | 1630 | $2,000 | $1.23 | 6d | 1 | 1.16mi |
| 6710 Hudson St Baltimore, MD | 4.0 | 4.0 | 1156 | $3,500 | $3.03 | 25d | 1 | 1.17mi |
| 7508 Ives Ln Dundalk, MD | 2.0 | 1.0 | 896 | $1,750 | $1.95 | 45d | 1 | 1.18mi |
| 1207 Anglesea St Baltimore, MD | 2.0 | 2.0 | 1162 | $2,150 | $1.85 | 6d | 1 | 1.29mi |
| 530 47th St Baltimore, MD | 3.0 | 1.0 | 1424 | $1,695 | $1.19 | 0d | 1 | 1.30mi |
| 849 Loalan Ave Dundalk, MD | 3.0 | 1.5 | 1024 | $1,850 | $1.81 | 16d | 1 | 1.36mi |
| 7484 Rabon Ave Dundalk, MD | 3.0 | 1.5 | 1499 | $2,000 | $1.33 | 45d | 1 | 1.37mi |
| 3443 Dunhaven Rd Dundalk, MD | 2.0 | 2.0 | 1016 | $1,900 | $1.87 | 6d | 1 | 1.38mi |
| 7448 Durwood Rd Dundalk, MD | 3.0 | 2.0 | 1606 | $1,995 | $1.24 | 4d | 1 | 1.39mi |
| 7520 Durwood Rd Dundalk, MD | 3.0 | 1.0 | 1110 | $2,100 | $1.89 | 45d | 1 | 1.42mi |
| 3481 McShane Way Dundalk, MD | 2.0 | 1.5 | 896 | $2,150 | $2.40 | 45d | 1 | 1.47mi |
Listing history 4 events
-
2026-04-29status Pending
-
2026-04-17$224,900 Active
-
1995-05-10soldstatus $87,500
-
1991-08-12soldstatus $55,000
ⓘ Source: listings_history table (triggers on properties + properties_extension) + one-shot
backfill from property_details.listing_events for pre-trigger history.
Tax reassessment forecast MD · Partial reset (capped growth)
- Current annual tax
- $2,825 · $235/mo
- Projected year-2 tax
- $2,825 · $235/mo
- Expected delta
- $0/yr ($0/mo · 0.0%)
ⓘ Screening estimate from a state-policy table — verify with the county assessor before closing.
Climate risk First Street
- Flood 1/10 Low FEMA zone X (unshaded) · 0% chance over 30 yrs
- Wildfire 1/10 Low
- Heat 8/10 Severe 7 d/yr ≥104°F today · 15 d/yr by 30 yrs out
- Wind 6/10 Major 27% chance of damaging wind over 30 yrs
- Air quality 5/10 Major 6 unhealthy d/yr today · 8 by 30 yrs out
Nearby sold comps map
Loading sold comps map…
Walkable amenities ~0.75 mi
Loading nearby amenities…
Taxation est. · year 1
- Rental income
- $24,496
- − Mortgage interest
- −$12,598
- − Property taxes
- −$2,825
- − Insurance
- −$1,124
- − Repairs & maintenance
- −$1,960
- − Management
- −$1,960
- − Depreciation
- −$6,543
- Taxable loss
- −$2,513
- Est. tax savings @ 24.0%
- +$603
- After-tax cash flow
- $1,853/yr
For passive investors: Depreciation is non-cash, so a rental often shows a tax loss while cash-flowing — sheltering income. Rental losses are passive: they offset passive income freely, and up to $25,000/yr can offset ordinary (W-2) income if you actively participate and your MAGI is under $100k (phasing out to $0 by $150k); unused losses carry forward. On sale, claimed depreciation is recaptured at up to 25%, and gains may owe capital-gains tax (a 1031 exchange can defer both). Figures are a year-1 estimate at your 24.0% rate — not tax advice; consult a CPA.
Schools (NCES district)
- District
- Baltimore County Public Schools
- NCES district ID
- 2400120
- Math proficiency
- 15% ▼ -16.00%
- Reading proficiency
- 34% ▼ -5.00%
- Median HH income
- $66,746
- Composite
- 23.17/100
- National rank
- #7948
- State rank
- #11 of 24 in MD
Livability — Dundalk
- Score
- 85/100
- State rank
- #16
- US rank
- #510
Category grades
Schools grade is shown separately in the Schools card above.
Census & demographics
- Census place
- Dundalk, MD
- County
- Baltimore County · 769,527 people
- City population
- 59,407
- Metro
- Baltimore-Columbia-Towson, MD
- Population (ZIP)
- 59,407
- Household income
- $64,141
- Rent vs Own
- Severe rent burden
- 2566.0
Population outlook (Baltimore County) Hauer SSP2
- Today (2025)
- 885,518 people
- By 2030
- 909,272 · +2.7%
- By 2040
- 951,547 · +7.5%
- By 2050
- 990,955 · +11.9%
- By 2075
- 1,086,411 · +22.7%
- By 2100
- 1,135,078 · +28.2%
Race, ethnicity, and origin ACS 2023
- Neighborhood character
- Diverse neighborhood (Simpson 0.60)
- Race & ethnicity
- White 59% Black 18% Hispanic / Latino 15% Two or more races 7% Asian 2% Native American 1%
- Hispanic origin (detail)
- Mexican 3% Puerto Rican 2%
- Common ancestry
- Romanian 7% Lithuanian 1% Italian 1%
- Foreign-born
- 9% · Canada
- Languages at home
- 85% English-only · Spanish 11% Other Indo-European 2% Arabic 1%
Political lean MEDSL · Baltimore
- 2024 margin
- Strong D (+24.5) · D 61.0% · R 36.5% · Other 2.5%
- 2008→2024 swing
- +9.9pp toward D · 2008: 14.6pp · 2024: 24.5pp
- All cycles
- 2024: D+24.5 2020: D+27.0 2016: D+17.4 2012: D+16.4 2008: D+14.6
Not yet ingested
- Civics
- —
Market trends
- HPI YoY
- ▼ -251.44%
- Current HPI
- 228.4218
- Rent YoY
- ▼ -0.09%
- Metro
- Baltimore-Columbia-Towson, MD
- State GDP YoY
- ▲ 2.97%
- F500 in state
- 12
Industry mix (Fortune 500 HQ in MD)
| Industry | F500 HQs | Revenue |
|---|---|---|
| Aerospace / Defense | 1 | $71B |
|
||
| Utilities | 1 | $25B |
|
||
| Hotels | 1 | $24B |
|
||
| Consumer Goods | 1 | $7B |
|
||
| Real Estate | 1 | $6B |
|
||
| Chemicals | 1 | $2B |
|
||
Price history
+308.9% since first listed4 events — show timeline
- 2026-04-29 Pending — BRIGHT MLS
- 2026-04-17 Listed $224,900 BRIGHT MLS
- 1995-05-10 Sold (Public Records) $87,500 Public Records
- 1991-08-12 Sold (Public Records) $55,000 Public Records
Property tax history
+2.9%/yrLatest (2025): $2,825 · -26.0% YoY. Source: county tax records.
Cash-flow waterfall
monthlySold comps — $/sqft
last 12 mo · ≤1 miLoading sold comps…