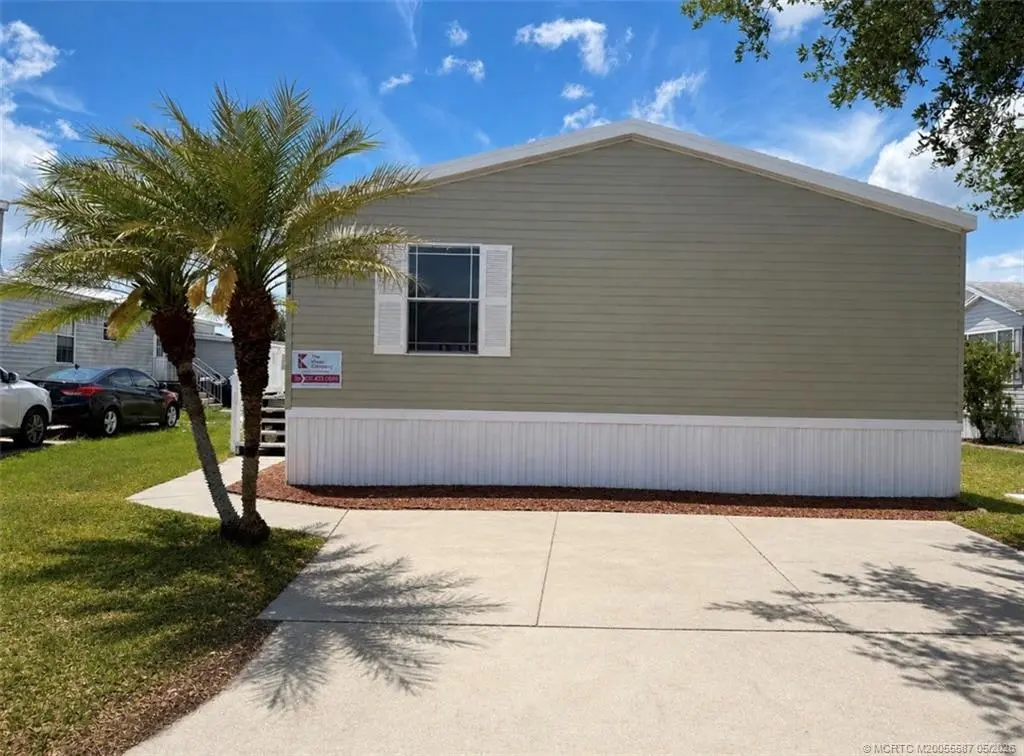
3484 Newberry Way · St. Cloud, FL
Flood risk 6/10 · Moderate
- FEMA flood zone
- X (unshaded)
- Chance of flooding over 30 yrs
- 0.7%
- Est. flood insurance / yr
- $507 – $1,088
Fire risk 5/10 · Moderate
- Est. fire insurance / yr
- $947 – $1,759
Heat risk 9/10 · Severe
- Hot days now (above 108°F)
- 7 days/yr
- Hot days in 30 yrs
- 24 days/yr
Wind risk 9/10 · Severe
- Chance of severe wind over 30 yrs
- 99.0%
Air-quality risk 1/10 · Minimal
- Unhealthy air days now
- 0 days/yr
- Unhealthy air days in 30 yrs
- 0 days/yr
Risk factors via First Street. Map © Google.
Why this score? — see what drove the B grade
The composite is a weighted blend of 9 inputs, each scored 0–100. Each bar is that input's sub-score; the figure is the points it added to the 100-point composite (weight × sub-score).
- Cash flow +30.0/30.0
- 1% rule +10.0/10.0
- DSCR +10.0/10.0
- ARV discount +7.5/15.0
- Condition / age +4.0/5.0
- Schools +3.6/10.0
- Rent growth +3.1/5.0
- Livability +2.5/5.0
- Appreciation +0.0/10.0
$79,900
🖨 Deal sheet 📄 Offer letter ✓ Due diligence
Listing remarks
Foreclosure-Bank owned Updated home with stainless steel appliances and a new roof
Key facts
- New roof
- Community pool
- Built 2006
Tags
Property features AI
Finance
- Other: Pets allowed (number and size limits apply)
- Financial info: Land lease amount $726
- HOA & community: Homeowners association with a monthly fee of $726; HOA covers association management, common areas, grounds maintenance, pools, and trash
Exterior
- Utilities: Electricity available
- Home design: Single-story home; Resale property
- Construction: Aluminum siding
- Exterior features: Community pool; Clubhouse; Playground; Property manager on-site; Street lights; Non-gated community; Maintenance of common areas and grounds included
Interior
- Bathrooms: 2 full bathrooms
- Heating & cooling: Central heating; Central air conditioning
- Interior features: Unfurnished
Neighborhood map
What this means for you Summary
Snapshot
- This is a 3-bed/2.0-bath manufactured listed at $80k. Condition is rated good.
Deal economics
- At list price, monthly cash flow is $531 ($6k/yr) — positive.
- The deal already cash-flows at list — no discount required.
- Meets the 1% rule at list price ($2k rent vs $80k).
- Recommended offer: $78k (3.0% below list) — sets the bar for market timing.
- Cap rate 14.3% vs local median 4.0% in St. Cloud — top-decile yield for the area; either an underpriced asset or a hidden risk that comps aren't pricing in. Stress-test before assuming the spread holds.
Location & tenants
- Location reads: area grade B — affects rentability + tenant quality, not the cash-flow math above.
- Osceola (suburban): math 39% / reading 45% proficiency, ranked #60 of 73 in FL (top 82%) — families likely to look elsewhere, expect single-tenant / working-renter base with shorter leases; 60% free/reduced lunch — lower-income household profile, screen leases tightly.
- Market conditions: Rents rising (+2.3%/yr); 868 active listings in the ZIP; 15 comparable units currently listed for rent nearby; rentals at typical pace (median 16d on market — plan ~3-4 weeks tenant-placement turnaround); solid renter incomes; 8,813 units permitted in Osceola County in 2024 (3,072 in 5+ unit buildings).
Forward outlook
- Local home prices are declining (-3.0%/yr); year-one equity from $552 of loan paydown is wiped out by about $2k of value loss. Plan a longer hold.
- Osceola County population projected at +73% by 2050 — long-run rental-demand tailwind backs the buy-and-hold thesis.
- At projected returns (-3.0% appreciation + 2.3% rent growth), your $22k cash investment doubles in ~5 years — after that, you're playing with house money.
Negotiation context
- It's been on market 40 days — a 3% lower offer ($78k) is reasonable based on typical stale-listing flexibility.
Risks & watch-outs
- Watch-outs: HOA is 32% of rent.
- Climate carrying-cost: major flood risk; severe wind risk, 99% chance of damaging wind over 30y; moderate wildfire risk; extreme-heat days projected 7→24/yr by 2055 (HVAC capex compounding) — expect insurance premiums to compound above CPI over the hold.
Questions for the listing agent
- It's been on market 40 days. Have you received any prior offers? Is the seller open to a 3% concession, seller financing, or rate buy-down credit?
- What does the HOA fee cover, when was the last increase, and are there any pending special assessments or reserve-fund shortfalls?
- Is there a deadline driving the sale (1031 exchange, divorce, estate, relocation)? That informs how much negotiation room exists.
- What's the average days-on-market for RENTAL listings here right now (not sales)? A rising rental-DOM trend means longer vacancies and softer asking-rent achievability than the comps imply.
- What's the recent tenant-quality profile in this submarket — average credit score on applications, eviction rate, late-payment / NSF rate, and stable-employment percentage? A property-management company in the area should have these aggregated.
- How much new for-sale + rental construction is in the pipeline within 1–3 miles? Heavy new supply typically softens prices + rents 12–24 months out; constrained supply supports both.
Investment metrics
- 1% rule
- 2.87% ✓
- Cap rate
- 14.27%
- Cash-on-cash
- 28.48%
- DSCR
- 2.27
- GRM
- 2.9
CMA / ARV
- ARV (on-the-fly)
- $398,736
- Comps found
- 1
Show comp detail 1 sale within ~0.75 mi
| Address | Dist | Beds/Ba | Sqft | Sold | Price | $/sf | Match |
|---|---|---|---|---|---|---|---|
| 3525 Cord Ave | 0.71mi | 3/2.0 | 1,232 (-12%) | 12mo | $350,000 | $284 | 36 |
Match score weights: distance 35% · size 25% · config 20% · recency 20%. Top-matched comps best support the ARV.
Projected returns pro-forma
-3.0% appreciation · 2.3% rent growth · sell at horizon
- IRR
- 21.8%
- Equity multiple
- 1.88×
- Total profit
- $19,748
- Equity at exit
- $11,913
- IRR
- 29.3%
- Equity multiple
- 3.51×
- Total profit
- $56,212
- Equity at exit
- $6,908
Cash invested: $22,372 (down + closing). Projections, not guarantees.
Landlord ↔ Tenant lean methodology
- Overall (STATE)
- 87 Strongly Landlord-Friendly
- State Florida
- 87 Strongly Landlord-Friendly · R+3
- County
- — inherits STATE
- City
- — inherits STATE
ZIP-level market 34772
- Home prices YoY
- -32.5%
- Rents YoY
- 2.3%
- Active inventory
- 868
- Price-to-rent
- 2.9×
Monthly cashflow live
- Estimated rent
- $2,290 high interval (Pro) →
- Mortgage (P&I)
- −$419
- Tax est. 1.5%
- −$100 /mo · $1,198/yr
- Insurance
- −$33
- HOA
- −$726
- Vacancy / Maint / Mgmt
- −$481
- Net cashflow
- $531
Break-even live
UW: 25.0% down · 7.5% · 30yr · 1.5% tax · 5.0% vac · 8.0% maint · 8.0% mgmt
Financing live
Cash to close
- Down payment
- $19,975
- Closing costs
- $2,397
- Reserves months
- —
- Total cash needed
- —
Loan-product check · same deal, 3 products live
Conventional
25% down · 7.5% · 30yr
- Down + closing
- —
- Monthly P&I
- —
- Monthly cashflow
- —
- DSCR
- —
- Eligible?
- —
Personal DTI + credit; lowest rate.
DSCR
20% down · 8.5% · 30yr
- Down + closing
- —
- Monthly P&I
- —
- Monthly cashflow
- —
- DSCR
- —
- Eligible?
- —
No personal income docs; deal must DSCR.
Hard money
10% down · 12.0% · 12mo
- Down + closing
- —
- Monthly P&I
- —
- Monthly cashflow
- —
- DSCR
- —
- Eligible?
- —
Short-term bridge; refi at stabilization.
Rent comps 15 comps
| Address | Beds | Baths | Sqft | Rent | $/sqft | DOM | Units | Dist |
|---|---|---|---|---|---|---|---|---|
| 3352 Kelsey Ln Saint Cloud, FL | 4.0 | 2.0 | 1687 | $2,165 | $1.28 | 16d | 1 | 0.24mi |
| 1917 Cayman Cove Cir Saint Cloud, FL | 3.0 | 2.0 | 1341 | $2,250 | $1.68 | 11d | 1 | 0.26mi |
| 3338 Kelsey Ln Saint Cloud, FL | 3.0 | 2.0 | 1236 | $1,850 | $1.50 | 3d | 1 | 0.29mi |
| 3350 Countryside View Dr Saint Cloud, FL | 3.0 | 2.0 | 1658 | $2,800 | $1.69 | 23d | 1 | 0.47mi |
| 3633 Doe Run Dr Saint Cloud, FL | 4.0 | 2.0 | 1788 | $2,280 | $1.28 | 23d | 1 | 0.73mi |
| 2202 Seven Oaks Dr Saint Cloud, FL | 3.0 | 2.5 | 1588 | $1,800 | $1.13 | 23d | 1 | 0.75mi |
| 2210 Seven Oaks Dr Saint Cloud, FL | 2.0 | 2.5 | 1373 | $1,795 | $1.31 | 19d | 1 | 0.76mi |
| 3734 Briarwood Estates Cir Saint Cloud, FL | 4.0 | 2.0 | 1820 | $2,116 | $1.16 | 7d | 1 | 0.91mi |
| 3507 Harlequin Dr Saint Cloud, FL | 3.0 | 2.0 | 1682 | $2,125 | $1.26 | 21d | 1 | 0.93mi |
| 2318 Sweetwater Blvd Saint Cloud, FL | 3.0 | 2.0 | 1772 | $2,090 | $1.18 | 1d | 1 | 1.09mi |
| 2952 Leba Ln Saint Cloud, FL | 3.0 | 2.0 | 1632 | $1,965 | $1.20 | 21d | 1 | 1.28mi |
| 2368 Sweetwater Blvd Saint Cloud, FL | 3.0 | 2.0 | 1552 | $2,100 | $1.35 | 7d | 1 | 1.33mi |
| 5390 Silver Thistle Ln Saint Cloud, FL | 3.0 | 2.0 | 1632 | $2,050 | $1.26 | 3d | 1 | 1.44mi |
| 5180 Gulf Sturgeon Ln Saint Cloud, FL | 3.0 | 2.0 | 1480 | $1,990 | $1.34 | 3d | 1 | 1.47mi |
| 3912 Wind Dancer Cir Saint Cloud, FL | 3.0 | 2.0 | 1677 | $2,100 | $1.25 | 17d | 1 | 1.50mi |
HOA detail
- Monthly dues
- $726 · $8,712/yr
Listing history 15 events
-
2026-06-18days on market $79,900 Active 40 DOM
-
2026-06-17days on market $79,900 Active 39 DOM
-
2026-06-16days on market $79,900 Active 38 DOM
-
2026-06-15days on market $79,900 Active 37 DOM
-
2026-06-13days on market $79,900 Active 35 DOM
-
2026-06-13days on market $79,900 Active 34 DOM
-
2026-06-09days on market $79,900 Active 31 DOM
-
2026-06-08days on market $79,900 Active 30 DOM
-
2026-06-07days on market $79,900 Active 29 DOM
-
2026-06-04days on market $79,900 Active 26 DOM
-
2026-06-03days on market $79,900 Active 25 DOM
-
2026-06-02days on market $79,900 Active 24 DOM
-
2026-06-01days on market $79,900 Active 23 DOM
-
2026-05-31days on market $79,900 Active 22 DOM
-
2026-05-09$79,900 Active
ⓘ Source: listings_history table (triggers on properties + properties_extension) + one-shot
backfill from property_details.listing_events for pre-trigger history.
Climate risk First Street
- Flood 6/10 Major FEMA zone X (unshaded) · 70% chance over 30 yrs
- Wildfire 5/10 Major
- Heat 9/10 Extreme 7 d/yr ≥108°F today · 24 d/yr by 30 yrs out
- Wind 9/10 Extreme 99% chance of damaging wind over 30 yrs
- Air quality 1/10 Low 0 unhealthy d/yr today · 0 by 30 yrs out
Nearby sold comps map
Loading sold comps map…
Walkable amenities ~0.75 mi
Loading nearby amenities…
Taxation est. · year 1
- Rental income
- $27,480
- − Mortgage interest
- −$4,476
- − Property taxes
- −$1,198
- − Insurance
- −$400
- − Repairs & maintenance
- −$2,198
- − Management
- −$2,198
- − HOA
- −$8,712
- − Depreciation
- −$2,324
- Taxable income
- $5,973
- Est. tax owed @ 24.0%
- −$1,434
- After-tax cash flow
- $4,938/yr
For passive investors: Depreciation is non-cash, so a rental often shows a tax loss while cash-flowing — sheltering income. Rental losses are passive: they offset passive income freely, and up to $25,000/yr can offset ordinary (W-2) income if you actively participate and your MAGI is under $100k (phasing out to $0 by $150k); unused losses carry forward. On sale, claimed depreciation is recaptured at up to 25%, and gains may owe capital-gains tax (a 1031 exchange can defer both). Figures are a year-1 estimate at your 24.0% rate — not tax advice; consult a CPA.
Condition & rehab AI · 8 photos
This updated manufactured home is in good condition with recent updates, making it a solid investment.
Value-add opportunities
- Resale Paint exterior trim — Enhances curb appeal
- Rental Clean gutters — Keeps property in good condition
Renovation cost estimate screening
Value-add ROI direction
- Resale Paint exterior trim — Enhances curb appeal ↑
- Rental Clean gutters — Keeps property in good condition ↑
ⓘ Cost ranges are severity-bucket heuristics (US national rule-of-thumb). Get contractor quotes + a written scope before underwriting a rehab budget.
Schools (NCES district)
- District
- Osceola
- NCES district ID
- 1201470
- Math proficiency
- 39% ▼ -9.00%
- Reading proficiency
- 45% ▼ -4.00%
- Median HH income
- $45,528
- Composite
- 35.7/100
- National rank
- #4865
- State rank
- #60 of 73 in FL
Livability — St. Cloud
No livability data for this city. (Only ~50 U.S. cities are tracked.)
Census & demographics
- Census place
- St. Cloud, FL
- County
- Osceola County · 410,217 people
- City population
- 29,247
- Metro
- Orlando-Kissimmee-Sanford, FL
- Population (ZIP)
- 35,390
- Household income
- $97,868
- Rent vs Own
- Severe rent burden
- 443.0
Population outlook (Osceola County) Hauer SSP2
- Today (2025)
- 447,624 people
- By 2030
- 511,823 · +14.3%
- By 2040
- 642,986 · +43.6%
- By 2050
- 774,552 · +73.0%
- By 2075
- 1,078,144 · +140.9%
- By 2100
- 1,269,660 · +183.6%
Race, ethnicity, and origin ACS 2023
- Neighborhood character
- Diverse neighborhood (Simpson 0.62)
- Race & ethnicity
- White 44% Hispanic / Latino 44% Two or more races 19% Black 4% Asian 2%
- Hispanic origin (detail)
- Puerto Rican 20% Cuban 2% Dominican 6%
- Common ancestry
- Lithuanian 2% Slovak 1% Iranian 1%
- Foreign-born
- 18% · Canada, Jamaica
- Languages at home
- 60% English-only · Spanish 36% German/W. Germanic 1% Other Indo-European 1%
Political lean MEDSL · Osceola
- 2024 margin
- Toss-up / Even · D 48.7% · R 50.2% · Other 1.1%
- 2008→2024 swing
- -21.2pp toward R · 2008: 19.7pp · 2024: -1.4pp
- All cycles
- 2024: R+1.4 2020: D+13.8 2016: D+25.0 2012: D+24.5 2008: D+19.7
Not yet ingested
- Civics
- —
Market trends
- HPI YoY
- ▼ -132.55%
- Current HPI
- 274.6517
- Rent YoY
- ▲ 2.30%
- Metro
- Orlando-Kissimmee-Sanford, FL
- State GDP YoY
- ▲ 3.28%
- F500 in state
- 36
Industry mix (Fortune 500 HQ in FL)
| Industry | F500 HQs | Revenue |
|---|---|---|
| Industrial Technology | 2 | $29B |
|
||
| Insurance | 2 | $17B |
|
||
| Retail | 1 | $60B |
|
||
| Technology Distribution | 1 | $58B |
|
||
| Homebuilding | 1 | $35B |
|
||
| Technology Manufacturing | 1 | $35B |
|
||
Price history
1 event — show timeline
- 2026-05-09 Listed $79,900 MCRTC
Cash-flow waterfall
monthlySold comps — $/sqft
last 12 mo · ≤1 miLoading sold comps…