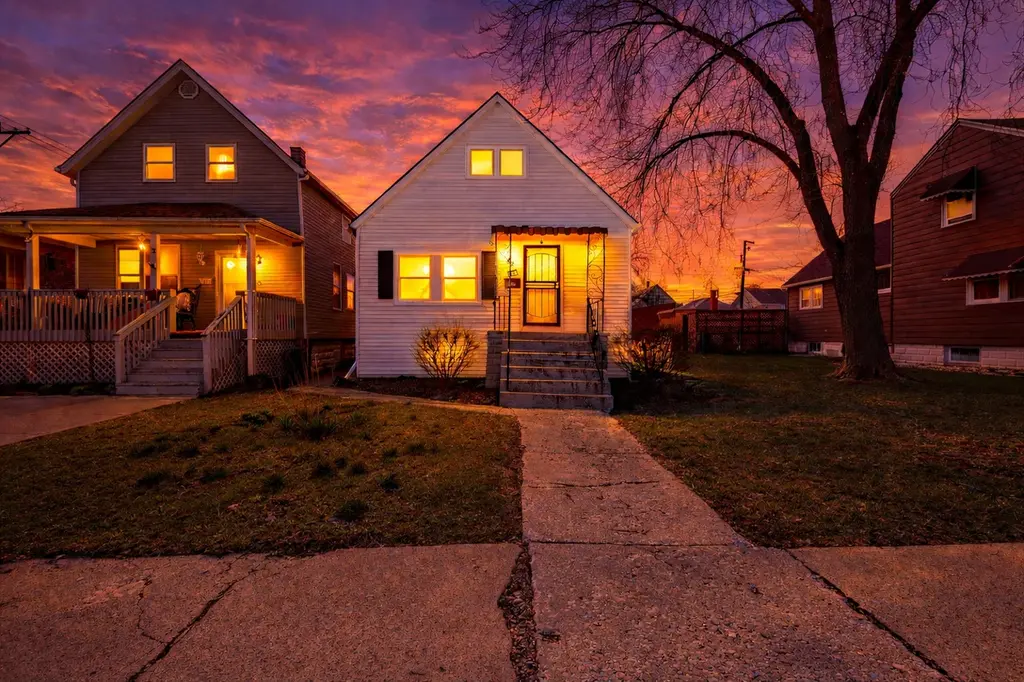
82 Isa Ave · Chicago Heights, IL
Flood risk 6/10 · Moderate
- FEMA flood zone
- X (unshaded)
- Chance of flooding over 30 yrs
- 0.68%
- Est. flood insurance / yr
- $473 – $860
Fire risk 3/10 · Minor
- Est. fire insurance / yr
- $804 – $1,492
Heat risk 3/10 · Minor
- Hot days now (above 101°F)
- 7 days/yr
- Hot days in 30 yrs
- 16 days/yr
Wind risk 2/10 · Minimal
- Chance of severe wind over 30 yrs
- —
Air-quality risk 2/10 · Minimal
- Unhealthy air days now
- 2 days/yr
- Unhealthy air days in 30 yrs
- 2 days/yr
Risk factors via First Street. Map © Google.
Why this score? — see what drove the C grade
The composite is a weighted blend of 9 inputs, each scored 0–100. Each bar is that input's sub-score; the figure is the points it added to the 100-point composite (weight × sub-score).
- Cash flow +25.1/30.0
- DSCR +8.2/10.0
- ARV discount +7.5/15.0
- 1% rule +7.3/10.0
- Rent growth +4.1/5.0
- Livability +3.6/5.0
- Condition / age +2.5/5.0
- Schools +0.7/10.0
- Appreciation +0.0/10.0
$149,900
🖨 Deal sheet (PDF) 📄 Offer letter ✓ Due diligence
Listing remarks MLS
This 2 bedroom/1 bath home located on a pleasant, quiet street has been beautifully rehabbed and returned to a true state of modern quality. With neutral colors and decor, the options to make it your own are plentiful. The full length basement allows for tons of storage, or your personal vision of constructing extra rooms. Finally, rest assured in the safety of your vehicles being parked in the large 2-car garage. Contact me for more details, and schedule your personal showing!
Key facts
- Basement family room
- Enclosed back porch
- Remodeled bathroom
Tags
Property features AI
Finance
- HOA & community: No master association fee required
Exterior
- Parking: Detached garage with garage door opener (2 garage spaces, 2 total parking spaces)
- Utilities: Public water; Public sewer; Electric with circuit breakers
- Home design: Detached single-family home; One-story; Fee simple ownership; Commuter bus access
- Construction: Built over 100 years ago; Vinyl siding; Asphalt roof; Concrete perimeter foundation
- Exterior features: Sidewalks; Street lights; Paved street; Lot approximately 25 x 125
Interior
- Kitchen: Range; Eating area / table space
- Bedrooms: Master bedroom on main level (10 x 9); Second bedroom on main level (9 x 8); Additional bedrooms listed
- Flooring: Carpet in main living areas and bedrooms
- Bathrooms: 1 full bathroom
- Heating & cooling: Natural gas forced-air heating; Ceiling fan(s)
- Interior features: First-floor bedroom; Partially finished full basement; 6 total rooms; Some photos virtually staged
- Laundry & utility: Laundry room
Neighborhood map
What this means for you Summary
Snapshot
- This is a 3-bed/1.0-bath single-family listed at $150k.
Deal economics
- At list price, monthly cash flow is $332 ($4k/yr) — positive.
- The deal already cash-flows at list — no discount required.
- Meets the 1% rule at list price ($2k rent vs $150k).
- Recommended offer: $145k (3.0% below list) — sets the bar for market timing.
- Cap rate 8.9% vs local median 6.4% in Chicago Heights — top-decile yield for the area; either an underpriced asset or a hidden risk that comps aren't pricing in. Stress-test before assuming the spread holds.
Location & tenants
- Location reads 71/100 on livability (#339 in IL) — a middle-class / working-renter tenant base. Strengths: commute A+, cost of living A+, housing A+; Watch: employment C-, crime F, amenities F.
- Bloom Twp Hsd 206 (suburban): math 8% / reading 9% proficiency, ranked #591 of 620 in IL (top 95%) — low school quality limits family demand, transient renter base, plan for 1-2y turnover.
- Zoned schools: Chicago Heights Middle School (math 9% / reading 24%, grade F, #482 of 665 statewide, top 73%, 940 students, 0% FRL); Bloom High School (math 7% / reading 8%, grade F, #589 of 693 statewide, top 86%, 1,737 students, 0% FRL).
- Market conditions: Rents rising fast (+6.5%/yr); 224 active listings in the ZIP; 8 comparable units currently listed for rent nearby; rentals leasing fast (median 9d on market — plan ~1-2 weeks tenant-placement turnaround); 6,272 units permitted in Cook County in 2024 (4,658 in 5+ unit buildings).
- This rent runs 36% of the median local income ($62k/yr) — at the standard rent-burdened threshold; future hikes will face affordability resistance.
Forward outlook
- Local home prices are declining (-3.0%/yr); year-one equity from $1k of loan paydown is wiped out by about $4k of value loss. Plan a longer hold.
- At projected returns (-3.0% appreciation + 6.5% rent growth), your $42k cash investment doubles in ~8 years — after that, you're playing with house money.
Negotiation context
- It's been on market 41 days — a 3% lower offer ($145k) is reasonable based on typical stale-listing flexibility.
- 8 sale attempts since 20y ago with the ask held roughly flat each time — persistent listings suggest the price (not the market) is what's stuck; bring a comps-based counter.
Risks & watch-outs
- Watch-outs: built in 1898 — expect roof / HVAC / electrical / plumbing capex.
- Climate carrying-cost: major flood risk — expect insurance premiums to compound above CPI over the hold.
Questions for the listing agent
- It's been on market 41 days. Have you received any prior offers? Is the seller open to a 3% concession, seller financing, or rate buy-down credit?
- Built in 1898 — when were the roof, HVAC, electrical panel, plumbing, and water heater last replaced?
- Is there a deadline driving the sale (1031 exchange, divorce, estate, relocation)? That informs how much negotiation room exists.
- Schools are F-rated, which usually means shorter tenancies and higher turnover. Who's the typical renter profile here, and what's been the actual vacancy rate?
- Crime grade is F in this area — have there been break-ins, vandalism, or insurance claims at this property in the last 3 years? What carrier currently insures it and at what premium?
- What's the average days-on-market for RENTAL listings here right now (not sales)? A rising rental-DOM trend means longer vacancies and softer asking-rent achievability than the comps imply.
- What's the recent tenant-quality profile in this submarket — average credit score on applications, eviction rate, late-payment / NSF rate, and stable-employment percentage? A property-management company in the area should have these aggregated.
- How much new for-sale + rental construction is in the pipeline within 1–3 miles? Heavy new supply typically softens prices + rents 12–24 months out; constrained supply supports both.
Investment metrics
- 1% rule
- 1.23% ✓
- Cap rate
- 8.95%
- Cash-on-cash
- 9.49%
- DSCR
- 1.42
- GRM
- 6.8
CMA / ARV
- ARV (on-the-fly)
- $84,744
- Comps found
- 5
Show comp detail 5 sales within ~0.75 mi
| Address | Dist | Beds/Ba | Sqft | Sold | Price | $/sf | Match |
|---|---|---|---|---|---|---|---|
| 1313 Vincennes Ave | 0.18mi | 2/1.0 (-1) | 800 (+1%) | 16mo | $130,000 | $163 | 72 |
| 1212 Center Ave | 0.56mi | 3/1.0 | 809 (+2%) | 4mo | $160,000 | $198 | 67 |
| 1635 Oak St Unit 1B | 0.52mi | 2/1.5 (-1) | 792 (0%) | 10mo | $80,000 | $101 | 60 |
| 43 E 13th St | 0.16mi | 2/1.0 (-1) | 866 (+9%) | 15mo | $63,000 | $73 | 60 |
| 1230 Lincoln Ave | 0.47mi | 2/1.0 (-1) | 725 (-8%) | 20mo | $77,400 | $107 | 42 |
Match score weights: distance 35% · size 25% · config 20% · recency 20%. Top-matched comps best support the ARV.
Projected returns pro-forma
-3.0% appreciation · 6.48% rent growth · sell at horizon
- IRR
- 2.1%
- Equity multiple
- 1.09×
- Total profit
- $3,602
- Equity at exit
- $22,351
- IRR
- 15.1%
- Equity multiple
- 2.43×
- Total profit
- $60,128
- Equity at exit
- $12,961
Cash invested: $41,972 (down + closing). Projections, not guarantees.
Landlord ↔ Tenant lean methodology
- Overall (STATE)
- 43 Moderately Tenant-Leaning
- State Illinois
- 43 Moderately Tenant-Leaning · D+7
- County
- — inherits STATE
- City
- — inherits STATE
ZIP-level market 60411
- Home prices YoY
- -33.9%
- Rents YoY
- 6.5%
- Active inventory
- 224
- Price-to-rent
- 6.8×
Monthly cashflow live
- Estimated rent
- $1,844 high interval (Pro) →
- Mortgage (P&I)
- −$786
- Tax from tax record
- −$276 /mo · $3,314/yr
- Insurance
- −$62
- HOA
- −$0
- Vacancy / Maint / Mgmt
- −$387
- Net cashflow
- $332
Break-even live
Sensitivity live
| Price | -10% $417 | -5% $374 | +0% $332 | +5% $289 | +10% $247 |
|---|---|---|---|---|---|
| Rent | -10% $186 | -5% $259 | +0% $332 | +5% $405 | +10% $477 |
| Rate | -1.0pp $407 | -0.5pp $370 | base $332 | +0.5pp $293 | +1.0pp $253 |
UW: 25.0% down · 7.5% · 30yr · 1.5% tax · 5.0% vac · 8.0% maint · 8.0% mgmt
Financing live
Cash to close
- Down payment
- $37,475
- Closing costs
- $4,497
- Reserves months
- —
- Total cash needed
- —
Loan-product check · same deal, 3 products live
Conventional
25% down · 7.5% · 30yr
- Down + closing
- —
- Monthly P&I
- —
- Monthly cashflow
- —
- DSCR
- —
- Eligible?
- —
Personal DTI + credit; lowest rate.
DSCR
20% down · 8.5% · 30yr
- Down + closing
- —
- Monthly P&I
- —
- Monthly cashflow
- —
- DSCR
- —
- Eligible?
- —
No personal income docs; deal must DSCR.
Hard money
10% down · 12.0% · 12mo
- Down + closing
- —
- Monthly P&I
- —
- Monthly cashflow
- —
- DSCR
- —
- Eligible?
- —
Short-term bridge; refi at stabilization.
Rent comps 8 comps
| Address | Beds | Baths | Sqft | Rent | $/sqft | DOM | Units | Dist |
|---|---|---|---|---|---|---|---|---|
| 83 W 15th St #1 Chicago Heights, IL | 3.0 | 1.0 | 1050 | $1,500 | $1.43 | 5d | 1 | 0.55mi |
| 63 Hickory St Unit 2 Chicago Heights, IL | 3.0 | 1.0 | 900 | $1,700 | $1.89 | 26d | 1 | 0.73mi |
| 41 E Main St Unit 2 Chicago Heights, IL | 2.0 | 1.0 | 1000 | $1,550 | $1.55 | 9d | 1 | 0.84mi |
| 531 Wallace St Chicago Heights, IL | 3.0 | 1.0 | 1100 | $2,000 | $1.82 | 7d | 1 | 0.89mi |
| 370 E 17th St Chicago Heights, IL | 3.0 | 1.0 | 1058 | $2,600 | $2.46 | 18d | 1 | 1.27mi |
| 417 W Hickory St Unit 2 Chicago Heights, IL | 3.0 | 1.0 | 900 | $1,800 | $2.00 | 22d | 1 | 1.41mi |
| 436 W Hickory St Unit Na Chicago Heights, IL | 3.0 | 1.0 | 1091 | $1,800 | $1.65 | 0d | 1 | 1.48mi |
| 444 Hickory St Unit 2A Chicago Heights, IL | 3.0 | 1.0 | 900 | $1,695 | $1.88 | 0d | 1 | 1.49mi |
Listing history 41 events
-
2026-06-21days on market $149,900 Active 41 DOM
-
2026-06-18days on market $149,900 Active 38 DOM
-
2026-06-17days on market $149,900 Active 37 DOM
-
2026-06-16days on market $149,900 Active 36 DOM
-
2026-06-15days on market $149,900 Active 35 DOM
-
2026-06-13days on market $149,900 Active 33 DOM
-
2026-06-13days on market $149,900 Active 32 DOM
-
2026-06-09days on market $149,900 Active 29 DOM
-
2026-06-08days on market $149,900 Active 28 DOM
-
2026-06-07days on market $149,900 Active 27 DOM
-
2026-06-04days on market $149,900 Active 24 DOM
-
2026-06-03days on market $149,900 Active 23 DOM
-
2026-06-02days on market $149,900 Active 22 DOM
-
2026-06-01days on market $149,900 Active 21 DOM
-
2026-05-31days on market $149,900 Active 20 DOM
-
2026-05-11$149,900 Active
-
2026-05-01historical Contingent - Continue to Show
-
2026-04-30historical
-
2026-04-16Active
-
2024-06-13soldstatus $135,000
-
2024-05-22soldstatus $135,000 Closed 482-char remark
Show marketing remark (482 chars)
This 2 bedroom/1 bath home located on a pleasant, quiet street has been beautifully rehabbed and returned to a true state of modern quality. With neutral colors and decor, the options to make it your own are plentiful. The full length basement allows for tons of storage, or your personal vision of constructing extra rooms. Finally, rest assured in the safety of your vehicles being parked in the large 2-car garage. Contact me for more details, and schedule your personal showing!
-
2024-04-10status Pending 482-char remark
Show marketing remark (482 chars)
This 2 bedroom/1 bath home located on a pleasant, quiet street has been beautifully rehabbed and returned to a true state of modern quality. With neutral colors and decor, the options to make it your own are plentiful. The full length basement allows for tons of storage, or your personal vision of constructing extra rooms. Finally, rest assured in the safety of your vehicles being parked in the large 2-car garage. Contact me for more details, and schedule your personal showing!
-
2024-03-29$130,000 Active 482-char remark
Show marketing remark (482 chars)
This 2 bedroom/1 bath home located on a pleasant, quiet street has been beautifully rehabbed and returned to a true state of modern quality. With neutral colors and decor, the options to make it your own are plentiful. The full length basement allows for tons of storage, or your personal vision of constructing extra rooms. Finally, rest assured in the safety of your vehicles being parked in the large 2-car garage. Contact me for more details, and schedule your personal showing!
-
2024-02-29historical Contingent - Continue to Show
-
2024-02-21historical
-
2024-01-16price
-
2023-12-01price
-
2023-11-07Active
-
2022-11-04soldstatus $43,000 Closed
-
2022-10-22historical Contingent - Continue to Show
-
2022-10-12price $40,000
-
2022-09-08price $50,000
-
2022-08-25price $55,000
-
2022-08-24status Active
-
2022-08-22historical
-
2022-08-15$65,000 Active
-
2008-04-23historical
-
2007-10-25historical
-
2007-10-23
-
2006-01-30
-
2000-05-22soldstatus $46,000
ⓘ Source: listings_history table (triggers on properties + properties_extension) + one-shot
backfill from property_details.listing_events for pre-trigger history.
Tax reassessment forecast IL · Partial reset (capped growth)
- Current annual tax
- $3,314 · $276/mo
- Projected year-2 tax
- $3,358 · $280/mo
- Expected delta
- +$45/yr (+$4/mo · 1.3%)
ⓘ Screening estimate from a state-policy table — verify with the county assessor before closing.
Climate risk First Street
- Flood 6/10 Major FEMA zone X (unshaded) · 68% chance over 30 yrs
- Wildfire 3/10 Moderate
- Heat 3/10 Moderate 7 d/yr ≥101°F today · 16 d/yr by 30 yrs out
- Wind 2/10 Low
- Air quality 2/10 Low 2 unhealthy d/yr today · 2 by 30 yrs out
Nearby sold comps map
Loading sold comps map…
Walkable amenities ~0.75 mi
Loading nearby amenities…
Taxation est. · year 1
- Rental income
- $22,123
- − Mortgage interest
- −$8,397
- − Property taxes
- −$3,314
- − Insurance
- −$750
- − Repairs & maintenance
- −$1,770
- − Management
- −$1,770
- − Depreciation
- −$4,361
- Taxable income
- $1,763
- Est. tax owed @ 24.0%
- −$423
- After-tax cash flow
- $3,558/yr
For passive investors: Depreciation is non-cash, so a rental often shows a tax loss while cash-flowing — sheltering income. Rental losses are passive: they offset passive income freely, and up to $25,000/yr can offset ordinary (W-2) income if you actively participate and your MAGI is under $100k (phasing out to $0 by $150k); unused losses carry forward. On sale, claimed depreciation is recaptured at up to 25%, and gains may owe capital-gains tax (a 1031 exchange can defer both). Figures are a year-1 estimate at your 24.0% rate — not tax advice; consult a CPA.
Schools (NCES district)
- District
- Bloom Twp Hsd 206
- NCES district ID
- 1706420
- Math proficiency
- 8% ▼ -3.00%
- Reading proficiency
- 9% ▼ -8.00%
- Median HH income
- $39,795
- Composite
- 7.4/100
- National rank
- #9952
- State rank
- #591 of 620 in IL
Livability — Chicago Heights
- Score
- 71/100
- State rank
- #339
- US rank
- #6836
Category grades
Schools grade is shown separately in the Schools card above.
Census & demographics
- Census place
- Chicago Heights, IL
- County
- Cook County · 4,486,803 people
- City population
- 52,175
- Metro
- Chicago-Naperville-Elgin, IL-IN-WI
- Population (ZIP)
- 52,175
- Household income
- $62,073
- Rent vs Own
- Severe rent burden
- 1714.0
Population outlook (Cook County) Hauer SSP2
- Today (2025)
- 5,347,519 people
- By 2030
- 5,357,703 · +0.2%
- By 2040
- 5,324,924 · -0.4%
- By 2050
- 5,230,762 · -2.2%
- By 2075
- 4,785,735 · -10.5%
- By 2100
- 4,188,836 · -21.7%
Race, ethnicity, and origin ACS 2023
- Neighborhood character
- Diverse neighborhood (Simpson 0.66)
- Race & ethnicity
- Black 49% Hispanic / Latino 26% White 19% Two or more races 11%
- Hispanic origin (detail)
- Mexican 22% Puerto Rican 2%
- Common ancestry
- Romanian 4% Portuguese 1% Lithuanian 1%
- Foreign-born
- 12% · Canada
- Languages at home
- 76% English-only · Spanish 21% Russian/Polish/Slavic 1% Other Indo-European 1%
Political lean MEDSL · Cook
- 2024 margin
- Solid D (+42.0) · D 70.4% · R 28.4% · Other 1.2%
- 2008→2024 swing
- -11.4pp toward R · 2008: 53.4pp · 2024: 42.0pp
- All cycles
- 2024: D+42.0 2020: D+50.3 2016: D+53.0 2012: D+49.4 2008: D+53.4
Not yet ingested
- Civics
- —
Market trends
- HPI YoY
- ▼ -108.75%
- Current HPI
- 212.4058
- Rent YoY
- ▲ 6.48%
- Metro
- Chicago-Naperville-Elgin, IL-IN-WI
- State GDP YoY
- ▲ 1.59%
- F500 in state
- 60
Industry mix (Fortune 500 HQ in IL)
| Industry | F500 HQs | Revenue |
|---|---|---|
| Insurance | 4 | $201B |
|
||
| Consumer Goods | 4 | $87B |
|
||
| Industrial Machinery | 3 | $64B |
|
||
| Healthcare | 2 | $55B |
|
||
| Retail / Pharmacy | 1 | $148B |
|
||
| Agriculture / Food | 1 | $86B |
|
||
Price history
+225.9% since first listed26 events — show timeline
- 2026-05-11 Listed $149,900 MRED as Distributed by MLS Grid
- 2026-05-01 Contingent — MRED as Distributed by MLS Grid
- 2026-04-30 Listing Removed — MRED as Distributed by MLS Grid
- 2026-04-16 Listed — MRED as Distributed by MLS Grid
- 2024-06-13 Sold (Public Records) $135,000 Public Records
- 2024-05-22 Sold (MLS) $135,000 MRED as Distributed by MLS Grid
- 2024-04-10 Pending — MRED as Distributed by MLS Grid
- 2024-03-29 Listed $130,000 MRED as Distributed by MLS Grid
- 2024-02-29 Contingent — MRED as Distributed by MLS Grid
- 2024-02-21 Listing Removed — MRED as Distributed by MLS Grid
- 2024-01-16 Price Changed — MRED as Distributed by MLS Grid
- 2023-12-01 Price Changed — MRED as Distributed by MLS Grid
- 2023-11-07 Listed — MRED as Distributed by MLS Grid
- 2022-11-04 Sold (MLS) $43,000 MRED as Distributed by MLS Grid
- 2022-10-22 Contingent — MRED as Distributed by MLS Grid
- 2022-10-12 Price Changed $40,000 MRED as Distributed by MLS Grid
- 2022-09-08 Price Changed $50,000 MRED as Distributed by MLS Grid
- 2022-08-25 Price Changed $55,000 MRED as Distributed by MLS Grid
- 2022-08-24 Relisted — MRED as Distributed by MLS Grid
- 2022-08-22 Listing Removed — MRED as Distributed by MLS Grid
- 2022-08-15 Listed $65,000 MRED as Distributed by MLS Grid
- 2008-04-23 Listing Removed — MRED as Distributed by MLS Grid
- 2007-10-25 Listing Removed — MRED as Distributed by MLS Grid
- 2007-10-23 Listed — MRED as Distributed by MLS Grid
- 2006-01-30 Listed — MRED as Distributed by MLS Grid
- 2000-05-22 Sold (Public Records) $46,000 Public Records
Property tax history
+2.4%/yrLatest (2023): $3,314 · +95.0% YoY. Source: county tax records.
Cash-flow waterfall
monthlySold comps — $/sqft
last 12 mo · ≤1 miLoading sold comps…